Abstract
Early atherosclerosis changes perfusion of the arterial wall due to localized proliferation of the vasa vasorum. When contrast agent passes through the artery, some enters the vasa vasorum and increases radiopacity of the arterial wall. Technical challenges to detecting changes in vasa vasorum density include the thin arterial wall, partial volume averaging at the arterial lumen/wall interface and calcification within the wall. We used a photon-counting spectral CT scanner to study carotid arteries of anesthetized pigs and micro-CT of these arteries to quantify vasa vasorum density. The left carotid artery wall was injected with autologous blood to stimulate vasa vasorum angiogenesis. The scans were performed at 25–120 keV; the tube-current-time product was 550 mAs. A 60 mL bolus of iodine contrast agent was injected into the femoral vein at 5mL/s. Two seconds post injection, an axial scan was acquired at every 3 s over 60 s (i.e., 20 time points). Each time point acquired 28 contiguous transaxial slices with reconstructed voxels 0.16 × 0.16 × 1 mm3. Regions-of-interest in the outer 2/3 of the arterial wall and in the middle 2/3 of the lumen were drawn and their enhancements plotted versus time. Lumenal CT values peaked several seconds after injection and then returned towards baseline. Arterial wall CT values peaked concurrent to the lumen. The peak arterial wall enhancement in the left carotid arterial wall correlated with increased vasa vasorum density observed in micro-CT images of the isolated arteries.
Keywords: spectral X-ray CT, X-ray photon-counting CT, arterial wall perfusion, vasa vasorum, intravascular contrast agent
1. INTRODUCTION
Vasa Vasorum, the microscopic vessels that perfuse the muscular wall of the coronary and carotid arteries, have been considered, for several decades, to have a role in the development of atherosclerotic changes in those arterial walls.1,2 The severity of atherosclerotic plaque formation has been shown to be associated with an increased spatial density of local vasa vasorum in the arterial outer wall (adventitia).3,4 As the increase in density of vasa vasorum tends to precede the development of plaques that encroach on the arterial lumen, we propose that quantification of arterial wall vasa vasorum density will provide a means of early detection of plaque development prior to development of arterial lumen narrowing. As the new vasa vasorum that develop tend to be more fragile than normal, they are leakier and prone to overt hemorrhage, which could be a cause of plaque rupture.5
The quantification of vasa vasorum in human subjects presents several technological challenges. Use of intra-arterial ultrasound and optical coherent tomography have been shown6,7 to allow visualization of vasa vasorum and thereby allowing counting of the number-density of vasa vasorum. However, these methods involve selective catheterization of the arteries of interest. Use of computed tomography during passage of a bolus of contrast agent through the vasa vasorum would be less invasive. However, CT imaging has to overcome the following difficulties:
1.1 Limitations in spatial resolution
As vasa vasorum diameters range between 5 and 150 micrometer, it is unlikely that these can be resolved, and thereby counted, using clinically relevant CT scanners which generally have voxel resolution down to 300 micrometer.
The radius of the lumen of a carotid artery is approximately 3 mm. The arterial wall thickness is about 30 % of this arterial lumen radius.8 The wall, in turn, consists of the adventitia (outer two thirds of the wall thickness) and the inner media and intima occupying the inner third of the wall.
1.2. Blood volume in vasa vasorum
The fraction of the cross-section area of the arterial wall that consists of the vasa vasorum lumen is about 10–15 %, hence the increase in opacity of the adventitia would be up to 10–15 % of the opacity in the arterial lumen when both contain the same concentration of contrast agent.9
1.3. CT image signal-to-noise constraint
The CT image signal-to-noise constraint can be alleviated by increasing the number of CT image voxels used to sample a region within the arterial wall and/or increasing the size of the voxels. The problem with increasing the size of the sampling ROI is that this would increase the chance that a local increase in vasa vasorum density being “diluted” by regions of the wall without the angiogenesis. Hence, the ROI location has to be fashioned so as to optimize the trade-off between decreasing noise versus “dilution”. Another problem with larger voxels is the increase of the partial volume effects caused by the inclusion of the outer lumen and/or regions outside the arterial wall which are straddled by the larger CT image voxels.
1.4. Arterial wall calcification
Atherosclerosis frequently results in calcification of the arterial wall.10 Hence, this opacification could corrupt the opacification due to the contrast agent. While the calcium content and distribution in the wall could be determined from a non-contrast scan, this would involve additional radiation exposure. Material decomposition of calcium from spectral CT image data would be performed in a single scan performed during the opacified stage.
1.5. Radiation exposure
The high spatial and density resolution required for the quantification of arterial wall opacification requires radiation exposure commensurate with the voxel size and contrast to noise ratio in the CT image. Photon counting reduces the image noise and suitable selection of the spectral energy bin maximizes the contrast.
2. METHODS
Our animal study was approved by our Institutional Animal Use and Care Committee.
2.1. Animal model
We used a porcine model of enhanced vasa vasorum density in arterial wall originally developed for use in rabbit.6 After anesthesia was induced (Telazol/Ketamine/Xylazine), both carotid arteries were exposed via a mid-line incision of the neck. The left arterial wall was injected in about six sequential locations between the carotid artery bifurcation and a caudal location about 6–7 cm proximal. A 0.1 mL aliquot of autologous blood was injection at each location. The right carotid artery (control) was also exposed but its wall was not injected. The neck incision was closed and the animal allowed to recover from the anesthesia. After six weeks, the animal was re-anesthetized and its neck scanned in our research photon counting CT scanner.11 Twenty-eight, 1 mm thick, transaxial slices incremented at of 0.5 mm intervals (i.e., total cephalo-caudal extent 14 mm) were scanned over a 1.0 second period and repeated every 2 seconds over a 60 second period. After a 15 minute interval (to allow the blood concentration to return towards the pre-injection level),12 we repeated that scan and associated contrast injection 25 mm more caudal along the neck so as to sequentially cover the arterial region-of-interest. Coincident to the start of the CT scan a bolus of 1 mL/kg body weight, iodine-based, contrast agent (Omnipaque® 350 (Iohexol), GE Healthcare, Inc.) was injected into the femoral vein at 5 mL/second followed by a 30 mL saline chaser. The detector pixel size at the axis of rotation was 450 micrometer and the CT image voxel size was 160 micrometer. CT images corresponding to photon energies of 25–120 keV, 25–52 keV and 52–120 keV were obtained at 120 kV and 550 mAs. When the scans were completed, the animal was euthanized and the carotid arteries exposed and injected with Microfil® (Flow Tech, Inc., Carver, MA), a lead-doped silicon-based polymer which hardens after several hours.
2.2. Micro-CT of the excised carotid arteries
The Microfil®-containing carotid arteries were removed from the animal and immersed in a formalin solution overnight. Next, the arteries were placed in a thin-walled plastic cylinder and encased with paraffin. This specimen was then scanned at 18+/− 1 keV in our bench-top micro-CT scanner13 at 20 micrometer detector pixel resolution. Those 20 μm × 20 μm pixel projection data were also used to bin contiguous detector pixels to generate 40 μm × 40 μm, 80 μm × 80 μm, 160 μm × 160 μm, 320 μm × 320 μm and 480 μm × 480 μm sized effective detector pixels. Those reformatted projection data were then used to reconstruct 3D CT images consisting of cubic voxels equal to the pixel side dimension.
2.3. In vivo CT and micro-CT image analysis
The in vivo CT and micro-CT image data were analyzed by use of two concentric annular regions-of-interest of equal area. As illustrated in Figure 1, the radius of the outer outline was positioned at 1.3 times the lumen radius from the center of the lumen.
Figure 1.
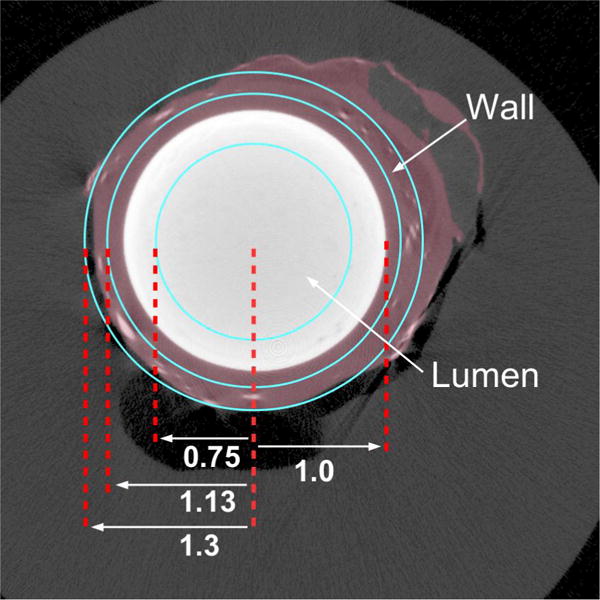
Schematic of regions-of-interest to sample the CT cross-section of the carotid artery lumen and outer wall. White circle is the contrast-filled lumen. The violet region is the wall. Vasa Vasorum show as small white spots in the wall.
The inner location of the outer and inner, annular, regions of interest (ROI) corresponding to the adventitia were set at 1.3 and 1.13 of the lumen radius, and the surface of the central ROI at 0.75 of the lumen radius. This geometry ensured that the inner-most annular ROI was well within the lumen and that the outer annular ROI covered just the arterial wall adventitia. The region between these two ROIs covered the interface between the wall and the lumen, hence it would be subject to partial volume effects at all voxel dimensions, and hence its data were not analyzed.
2.4. Removal of lumen opacification on micro-CT image data
The micro-CT image data, previously reconstructed from the original and reformatted projection data, were again reconstructed after the contrast in the lumen was “removed”. This lumen contrast “removal” from the 20 μm image was accomplished by replacing the attenuation value in the main lumen ROI with a background attenuation value. The CT image data was forward-projected to create a new set of projection data. These projections were then reformatted into the larger detector pixels and reconstructed with the usual tomographic process. This created a set of reconstructed axial images with low attenuation in the lumen. All micro-CT values were in 1,000/cm.
3. RESULTS
The results from the micro-CT image analyses are as follows (Figures 2, 3, 4, 5, 6, and 7).
Figure 2.
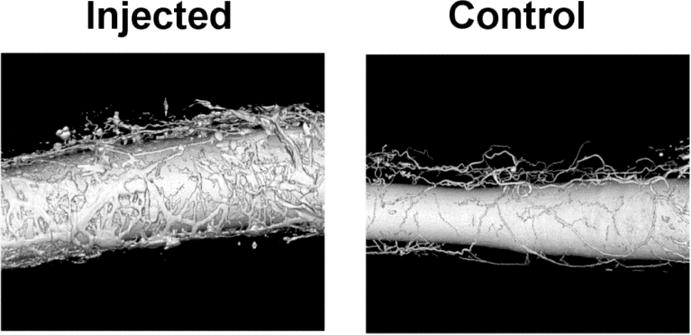
Volume-rendered display of the micro-CT images. Radiopaque Microfil® polymer fills the main lumen of the two carotid arteries and their surrounding vasa vasorum. Note, the great increase in vasa vasorum in the artery that had its wall injected with autologous blood.
Figure 3.
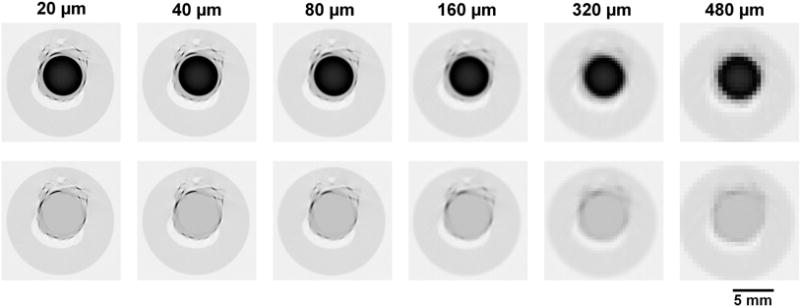
Micro-CT cross-sectional images of the injected artery shown in inverse gray scale to facilitate visualization. Black is highly attenuating and white is air. The upper row shows the same, Microfil® containing artery lumen, cross section reconstructed from the increasingly larger detector pixels from left to right. The lower panels show the micro-CT images after the Microfil® in the artery lumen was “removed” as described in the text.
Figure 4.
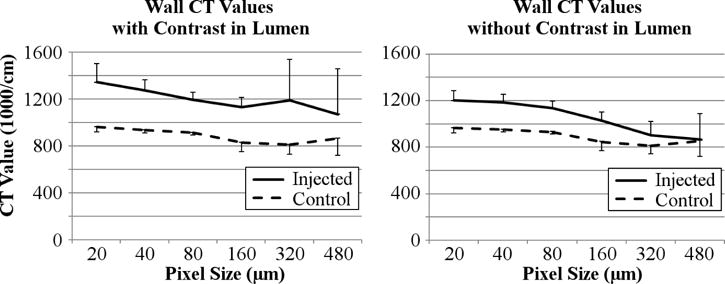
Left panel shows increased micro-CT value of the carotid artery wall region in the ‘injected’ artery wall and in the ‘control’ artery wall at different CT detector pixel sizes (and corresponding CT image voxel sizes). Right panel – same as left panel after the lumen opacity was replaced by background CT values. The vertical bars are standard deviation about the mean computed for the 28 contiguous slices.
Figure 5.
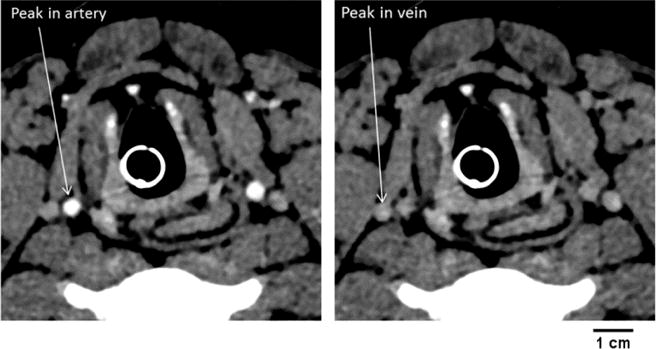
Left panel - A cross-section CT image of the two carotid arteries during the peak opacification phase of the passage of the contrast bolus through the arteries. Right panel – same cross section imaged later during jugular vein peak opacification. These images show that these veins do not touch the outer wall of the artery.
Figure 6.

The time sequence of contrast in the inner lumen ROI, the outer wall ROI and jugular vein at 2 second intervals throughout the scan sequence. The right panel is from the “injected” artery and the left panel is from the control artery. Note the increased peak in the injected artery wall versus the peak in the control artery wall.
Figure 7.
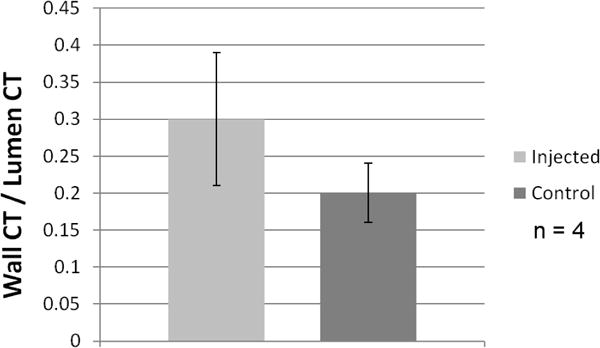
Ratio (mean ± SD) of carotid arterial wall opacity (area under peak deflection above background) relative to arterial lumen opacity (above background) in 6 weeks post injection into arterial wall (25–120 keV).
3.1. The micro-CT data
4. DISCUSSION
We used the carotid artery as surrogate for coronary arteries for two reasons. First, we could not easily apply the arterial preparation (i.e., injection of autologous blood into the arterial wall) to the coronary arteries as this would involve a thoracotomy. Secondly, the carotid arteries are not subject to the considerable cardiogenic movement experienced by the coronary arteries and the research scanner was not equipped with a cardiac-gated scan mode to address the motion of the coronary arteries. Third, the neck diameter allowed the scan field of view of the photon counting detector array to contain the entire neck cross section. Atherosclerosis is a systemic disease of the arterial wall, and the carotid artery is a reasonable surrogate for the coronary artery in terms of incidence and severity of atherosclerosis.14
We chose the vasa vasorum as an index of early atherosclerosis for two reasons. First is the close relationship between the increase in vasa vasorum density in proportion to plaque size,3 which is important as this might allow detection of early plaque formation prior to their encroachment on the arterial lumen.8 Secondly the newly formed (and therefore probably more fragile) vasa vasorum are likely a major contributor to of hemorrhage into the plaque and indeed into the arterial lumen, ie the cause of the ruptured “vulnerable” plaque.5,15,16
Although not present in this animal model, calcification with the arterial wall is a common phenomenon in the presence of atherosclerosis. Hence, in the clinical situation, the calcium must be distinguished from the opacification due to the contrast agent within the wall. Material decomposition can achieve this provided suitable spectral x-ray CT is available.
Although there are several imaging methods used to detect and quantify atherosclerotic plaques,16,17,18 CT as a method for quantifying vasa vasorum density is minimally invasive. The goal of our work is to develop a technique that detects pre-symptomatic atherosclerosis, i.e., before there is an acute arterial lumen occlusion or narrowing of the lumen by the large plaque. This means we need to consider a method that is minimally invasive. Additionally, the overall speed and general availability of a CT examination is convenient for patients and would allow high patient throughput. The CT method has two weaknesses that need to be addressed. One is that the radiation exposure needs to be consistent with existing exams for patients who are asymptomatic, i.e., likely to present because of a family history of early coronary artery disease or stroke. This will require a trade-off between CT image spatial resolution and signal-to-noise ratio versus the radiation exposure needed to achieve the require image quality. The use of photon counting and multi-energy CT imaging with the reduced electronic noise, higher iodine contrast-to-noise-ratio, and potential for improved spatial resolution, may contribute to minimizing the radiation exposure needed. The possible role of algorithmic methods to reduce radiation exposure has yet to be established.19
5. CONCLUSION
In this animal model, the micro-CT estimate of arterial wall vasa vasorum density was quite comparable to that seen in the whole-body CT scan. The increase in carotid artery adventitial radiopacity is related to the increase in vasa vasorum density of adventitia. Hence, we conclude that this signal may be useful for detection of early onset of atherosclerosis.
Acknowledgments
This research was supported in part by NIH Grant, EB016966 and in partnership with Siemens Healthcare. The research photon-counting CT system described herein is not commercially available.
References
- 1.Barger AC, Beeuwkes R, Lainey LL, Silverman KJ. Hypothesis: Vasa Vasorum and neovascularization of human coronary arteries a possible role in the pathophysiology of atherosclerosis. NEJ Med. 1984;310(3):175–177. doi: 10.1056/NEJM198401193100307. [DOI] [PubMed] [Google Scholar]
- 2.Heistad DD. Blood flow through vasa vasorum of coronary arteries in atherosclerotic monkeys. Arteriosclerosis. 1986;6(3):326–331. doi: 10.1161/01.atv.6.3.326. [DOI] [PubMed] [Google Scholar]
- 3.Langheinrich AC, Michniewicz A, Sedding DG, Walker G, Beighley PE, Rau WS, Bohle RM, Ritman EL. Correlation of vasa vasorum neovascularization and plaque progression in aortas of apolipoprotein E−/−/Low density lipoprotein−/− double knockout mice. Arteriosclerosis Throm Vasc J. 2006;26:347–352. doi: 10.1161/01.ATV.0000196565.38679.6d. [DOI] [PubMed] [Google Scholar]
- 4.Ritman EL, Lerman A. The dynamic vasa vasorum. Cardiovasc Res. 2007;75:649–658. doi: 10.1016/j.cardiores.2007.06.020. [DOI] [PMC free article] [PubMed] [Google Scholar]
- 5.Kolodgie FD, Gold HK, Bueke AP, Fowler DR, Kruth HS, Weber DK, Farb A, Guerrero LJ, Hayase M, Kutys R, Narula J, Finn AV, Virmani R. Intraplaque hemorrhage and progression of coronary atheroma. NEJ Med. 2003;349:2316–2325. doi: 10.1056/NEJMoa035655. [DOI] [PubMed] [Google Scholar]
- 6.Lee SC, Carr CL, Davidson BP, Ellegala D, Xie A, Ammi A, Belcik T, Lindner JR. Temporal characterization of the functional density of the vasa vasorum by contrast-enhanced ultrasonogrphy maximum intensity projection imaging. J Am Coll Cardiol Imaging. 2010;3:1265–1272. doi: 10.1016/j.jcmg.2010.08.017. [DOI] [PMC free article] [PubMed] [Google Scholar]
- 7.Aoki T, Rodriguez-Porcel M, Matsuo Y, Cassar A, Kwon TG, Franchi F, Gulati RJ, Kushnata SS, Lennon RJ, Lerman LO, Ritman EL, Lerman A. Evaluation of coronary adventitial vasa vasorum using 3D optical coherence tomography – animal and human studies. Atherosclerosis. 2015;239:203–208. doi: 10.1016/j.atherosclerosis.2015.01.016. [DOI] [PMC free article] [PubMed] [Google Scholar]
- 8.Glagov S, Weisenby E, Koletis CK, Stanhesnaicinius R, Koletis GJ. Compensatory enlargement of human atherosclerosis coronary arteries. NEJ Med. 1987;316(1):1371–1375. doi: 10.1056/NEJM198705283162204. [DOI] [PubMed] [Google Scholar]
- 9.Moritz R, Eaker DR, Langheinrich AC, Jorgensen SM, Bohle RM, Ritman EL. Quantification of Vasa Vasorum density in multi-slice computed tomographic coronary angiograms: Role of computed tomographic image voxel size. J Comput Assist Tomogr. 2010;34(2):273–278. doi: 10.1097/RCT.0b013e3181bb0d32. [DOI] [PMC free article] [PubMed] [Google Scholar]
- 10.Blankenhorn DM. Coronary arterial calcification: A review. Am J Med Sci. 1961;42:1–49. [Google Scholar]
- 11.Yu Z, Leng S, Jorgensen SM, Li Z, Gutjahr R, Chen B, Halaweish A, Kappler S, Yu L, Ritman EL, McCollough C. Evaluation of a conventional imaging performance in a research whole-body CT system with a photon counting detector array. Physics in Med Biol. 2016;61(57):1572–1595. doi: 10.1088/0031-9155/61/4/1572. [DOI] [PMC free article] [PubMed] [Google Scholar]
- 12.Fischer HW. Hemodynamic reaction to angiographic media. A survey and commentary [Review] Radiology. 1968;91(1):66–73. doi: 10.1148/91.1.66. [DOI] [PubMed] [Google Scholar]
- 13.Jorgensen SM, Demirkaya O, Ritman EL. Three-dimensional imaging of vasculature and parenchyma in intact rodent organs using x-ray micro-CT. Am J Physiol, 275 (Heart Circ Physiol) 1998;44:H1103–H1114. doi: 10.1152/ajpheart.1998.275.3.H1103. [DOI] [PubMed] [Google Scholar]
- 14.Galili O, Hermann J, Woodrum J, Sattler KJ, Lerman LO, Lerman A. Adventitial vasa vasorum heterogeneity among different vascular beds. J Vasc Surg. 2004;40:529–535. doi: 10.1016/j.jvs.2004.06.032. [DOI] [PubMed] [Google Scholar]
- 15.Paterson JC. Capillary rupture with intimal hemorrhage as a causative factor in coronary thrombosis. Arch Pathol Lab Med. 1938;25:474–487. [Google Scholar]
- 16.Langheinrich AC, Michniewicz A, Sedding DG, Lai B, Jorgensen SM, Bohle RM, Ritman EL. Quantitative x-ray imaging of intraplaque hemorrhage in aorta of apoE−/−/LAD−/− double knockout mice. Invest Radiol. 2007;42(5):263–273. doi: 10.1097/01.rli.0000258085.87952.ea. [DOI] [PubMed] [Google Scholar]
- 17.Li J, Ma T, Mohor D, Steward E, Yu M, Piao Z, He Y, Sheng KK, Zhou Q, Patel PM, Chem Z. Ultrafast optical-ultrasonic system and miniaturized catheter for imaging and characterizing atherosclerotic plaques in vivo. Sci Report [5:18406], Nature. 2015 doi: 10.1038/srep18406. [DOI] [PMC free article] [PubMed] [Google Scholar]
- 18.Holme MN, Schulz G, Deyhle H, Weitkamp T, Beckmann F, Lobrinus JA, Rikhtegar F, Kurtcuoglu V, Zanette I, Saxer T, Muller B. Complementary X-ray tomography techniques for histology-validated 3D imaging of soft and hard human tissues using plaque-containing blood vessels as examples. Nature Protocols. 2014;9(6):1401–1415. doi: 10.1038/nprot.2014.091. [DOI] [PubMed] [Google Scholar]
- 19.Yu Z, Leng S, Li Z, Ritman E, McCollough C. Spectral PICCS re-construction for photon-counting CT. Proc 13th International Mtg on Fully-3D Image Re-construction in Radiology and Nuclear Medicine. 2015:198–201. [Google Scholar]


