

Abstract
We investigated the in vitro and in vivo anticancer effect of combining lysosomal membrane permeabilization (LMP)-inducing agent N-dodecylimidazole (NDI) with glycolytic inhibitor 2-deoxy-d-glucose (2DG). NDI-triggered LMP and 2DG-mediated glycolysis block synergized in inducing rapid ATP depletion, mitochondrial damage, and reactive oxygen species production, eventually leading to necrotic death of U251 glioma cells but not primary astrocytes. NDI/2DG-induced death of glioma cells was partly prevented by lysosomal cathepsin inhibitor E64 and antioxidant α-tocopherol, suggesting the involvement of LMP and oxidative stress in the observed cytotoxicity. LMP-inducing agent chloroquine also displayed a synergistic anticancer effect with 2DG, whereas glucose deprivation or glycolytic inhibitors iodoacetate and sodium fluoride synergistically cooperated with NDI, thus further indicating that the anticancer effect of NDI/2DG combination was indeed due to LMP and glycolysis block. The two agents synergistically induced ATP depletion, mitochondrial depolarization, oxidative stress, and necrotic death also in B16 mouse melanoma cells. Moreover, the combined oral administration of NDI and 2DG reduced in vivo melanoma growth in C57BL/6 mice by inducing necrotic death of tumor cells, without causing liver, spleen, or kidney toxicity. Based on these results, we propose that NDI-triggered LMP causes initial mitochondrial damage that is further increased by 2DG due to the lack of glycolytic ATP required to maintain mitochondrial health. This leads to a positive feedback cycle of mitochondrial dysfunction, ATP loss, and reactive oxygen species production, culminating in necrotic cell death. Therefore, the combination of LMP-inducing agents and glycolysis inhibitors seems worthy of further exploration as an anticancer strategy.
Keywords: ATP, cancer therapy, glycolysis, lysosome, mitochondrial membrane potential, necrosis (necrotic death), oxidative stress, 2-deoxy-d-glucose, N-dodecylimidazole
Introduction
During carcinogenesis, cancer cells acquire changes in intracellular signaling pathways, cell metabolism, and organelle content/function, which contribute to development of a malignant phenotype. On the other hand, these alterations could also provide specific targets for anticancer therapy. For example, although the changes in lysosomal volume, composition, and cellular distribution promote invasive growth, angiogenesis, and drug resistance, at the same time they can sensitize cancer cells to lysosomal membrane permeabilization (LMP)5 by lysosome-targeting anti-cancer drugs (1). Also, the metabolic phenotype of cancer cells is characterized by preferential dependence on glycolysis for energy production in oxygen-limiting conditions, which confers selective advantage under diminished nutrient supply but renders cancer cells more sensitive to glycolysis inhibition (2). It has been known that combining different approaches can increase the efficiency of cancer therapy, but the effects of simultaneous induction of LMP and glycolysis inhibition have not been systematically investigated.
N-dodecylimidazole (NDI) was synthesized by Firestone et al. (3, 4) among several other compounds designed to combine lysosomotropism with detergent activity. By placing imidazole, an amine of intermediate pK, onto a long hydrocarbon chain, the compound was endowed with the ability to diffuse across lysosomal membrane, where in the low pH environment it becomes protonated and trapped. NDI then develops surfactant properties and disrupts the lysosomal membrane, causing death of both normal and cancer cells by releasing the lysosomal contents into the cytoplasm (5–7). Depending on the concentration of lysosomal detergent and the extent of lysosomal damage, cells eventually die by apoptosis or necrosis (8–11). Because NDI acquires detergent properties under acidic conditions, it was suggested that it might be useful in inducing LMP and selective killing of cells in regions of solid tumors that have reduced extracellular pH due to anaerobic metabolism (12).
The glucose analog 2-deoxy-d-glucose (2DG) is an inhibitor of glycolysis and glucose transport (13). In addition to reducing intracellular ATP levels, 2DG has also been found to alter protein glycosylation, intracellular signaling, and gene expression (13), which eventually leads to oxidative stress, cell cycle arrest, and apoptotic death of cancer cells in vitro (14–18). Although the in vivo anticancer effects of 2DG used as a single agent were rather limited (19, 20), the drug has been found to significantly potentiate anticancer effects of other therapeutic agents (19–21). Also, clinical trials have shown that 2DG in combination with radiotherapy is well tolerated by glioma patients (22, 23). The recent studies demonstrated the synergistic cytotoxicity of the lysosomal blocker chloroquine and 2DG against rhabdomyosarcoma and prostate cancer cells (16, 24), but the possibility that LMP might cooperate with glycolysis inhibition in cancer cell killing has not been directly investigated.
We demonstrate here that LMP inducer NDI and glycolysis inhibitor 2DG synergistically induce ATP depletion, mitochondrial dysfunction, oxidative stress, and subsequent necrotic death in U251 glioma and B16 melanoma cell lines. Importantly, NDI and 2DG synergized in reducing melanoma growth in vivo.
Results
NDI and 2DG Synergize in Killing U251 Glioma Cells
To assess the influence of glycolytic inhibitor 2DG on the anticancer activity of lysosomal detergent NDI, we treated U251 human glioma cells with different doses of both agents, separately or in combination. Although both NDI and 2DG in a dose-dependent manner decreased mitochondrial dehydrogenase activity (measured by 3-(4,5-dimethylthiazol-2-yl)-2, 5-diphenyltetrazolium bromide (MTT) test) and cell numbers (measured by crystal violet staining) in U251 cultures, the effect was more pronounced upon combined treatment (Fig. 1, A and B). Varying the sequence of exposure to NDI and 2DG (30 min preincubation) did not influence the cytotoxic potency of the combination (data not shown). The mathematical analysis revealed a synergistic cytotoxic interaction, as the α values for the combined treatment were significantly >1 for both MTT and crystal violet tests (Fig. 1C). Based on the α values, the concentrations of 40 μm for NDI and 10 mm for 2DG were chosen for further experiments, unless otherwise stated. A time-kinetics study revealed that the synergistic cytotoxicity of NDI and 2DG was observed already after 1 h and then gradually increased up to 24 h (Fig. 1D). Microscopic examination demonstrated that the cell density in cultures treated with each agent alone was somewhat reduced, presumably due to a block in cell proliferation, whereas cell morphology was largely preserved (Fig. 1E). On the other hand, cells exposed to combined treatment lost their polygonal or spindle-like shape and became smaller and more round with less defined edges, indicating the induction of cell death (Fig. 1E). Therefore, NDI and 2DG exert a synergistic cytotoxic effect toward U251 glioma cells.
FIGURE 1.

NDI and 2DG synergize in killing U251 glioma cells. A–C, U251 cells were incubated with different concentrations of NDI (10–80 μm) and 2DG (5–20 mm) for 24 h. Cell viability was determined by MTT (A) and crystal violet (CV) test (B), whereas the α index for synergism/antagonism was calculated for 10 mm 2DG and different concentrations of NDI (C). D and E, U251 cells were incubated with NDI (40 μm) and 2DG (10 mm) alone or in combination. Cell viability was determined by MTT after the indicated time periods (D), whereas cell morphology was examined by phase contrast microscopy after 8 h of treatment (E). A–E, the data in A, B, and D are presented as the mean ± S.D. values of triplicates from a representative of at least three experiments (#, p < 0.05 versus no treatment; *, p < 0.05 versus no treatment and treatment with NDI or 2DG alone). The data in C are presented as the mean ± S.D. values from three independent experiments (*, p < 0.05 denotes the values > 1).
Combination of NDI and 2DG Induces Necrotic Death of U251 Cells
We next examined the type of cell death (apoptotic or necrotic) induced by combination of NDI and 2DG. When applied separately at different concentrations, both drugs failed to induce a significant release of the intracellular enzyme lactate dehydrogenase (LDH) in U251 cell cultures (Fig. 2A), thus suggesting the absence of cell membrane damage. In contrast, combined treatment increased the LDH release in a dose- and time-dependent manner, reflecting the loss of cell membrane integrity as a marker of necrotic death (Fig. 2A). In accordance with the MTT data (Fig. 1D), the LDH release upon combined treatment occurred rapidly, after only 1 h, and gradually increased toward the end (24 h) of the incubation (Fig. 2B). Flow cytometric analysis of the cells treated with either NDI or 2DG alone demonstrated no significant changes in phosphatidylserine exposure or membrane integrity, measured as annexin/propidium iodide (PI) fluorescence after 8 or 24 h of treatment (Fig. 2C). In contrast to chemotherapeutic drug cisplatin, used as a positive control for apoptosis induction, NDI + 2DG treatment induced the increase in numbers of necrotic (annexin+PI+), but not apoptotic cells (annexin+PI−) (Fig. 2C). NDI + 2DG-induced necrotic death was genuine and not secondary to induction of apoptosis, as no increase in apoptotic cells was noticed before the appearance of necrotic cells (data not shown). Consistent with the absence of apoptosis, combination of NDI and 2DG, in contrast to cisplatin, failed to induce the activation of caspases (Fig. 2D), the apoptosis-executing enzymes (25). Transmission electron microscopy (TEM) analysis of NDI + 2DG-treated cells confirmed membrane disintegration and loss of electron density in the cytosol as the main morphological features of necrotic cell death (Fig. 2E).
FIGURE 2.

Combination of NDI and 2DG induces necrotic death of U251 cells. A and B, U251 cells were incubated with different concentrations of NDI (10–80 μm) and 2DG (5–20 mm) for 24 h (A) or with 40 μm NDI and 10 mm 2DG alone or in combination for the indicated time periods (B). Cytotoxicity was determined by LDH release assay, and the data are presented as the mean ± S.D. values of triplicates from a representative of three experiments (*, p < 0.05 versus no treatment and treatment with NDI or 2DG alone). C and D, U251 cells were incubated as in B or with cisplatin (50 μm). Phosphatidylserine externalization (annexin+ cells) and cell membrane damage (PI+ cells) (C) or caspase activation (D) were assessed by flow cytometry after the indicated time periods or 4 h, respectively. The representative dot plots (C) and histograms (D) are shown. E, U251 cells were incubated with combination of NDI (40 μm) and 2DG (10 mm) for 24 h, and cell morphology was examined by electron microscopy (scale bar = 5 μm).
Programmed Cell Death Is Not Involved in NDI + 2DG-induced U251 Cell Killing
In the next set of experiments, we explored possible involvement of different types of programmed cell death, such as apoptosis, ferroptosis, necroptosis, and macroautophagy (hereafter autophagy) (26, 27) in NDI + 2DG-triggered cell killing. The pan-caspase inhibitor QVD-OPH did not affect NDI + 2DG-triggered death of U251 cells (Fig. 3A), although it significantly reduced the cytotoxicity of anti-cancer drug cisplatin (from 71.5 ± 3.9% to 47.9 ± 7.5%; n = 3, p < 0.05). Ferroptosis-inhibiting iron chelators deferoxamine and bathophenanthroline disulfonate (BPDS) also failed to prevent cell death induced by combination of NDI and 2DG (Fig. 3B). Treatment with NDI and 2DG did not increase phosphorylation of necroptosis mediators receptor-interacting protein (RIP) and mixed lineage kinase domain-like protein (MLKL) (Fig. 3C), and their knockdown by RNA interference was unable to rescue U251 cells from NDI + 2DG-induced death (Fig. 3D). Accordingly, necroptosis inhibitor necrostatin-1 failed to reduce NDI + 2DG cytotoxicity (Fig. 3E), although it partly decreased that of cisplatin (from 72.7 ± 1.8% to 59.9 ± 5.0%; n = 3, p < 0.05). The levels of autophagy marker microtubule-associated protein light chain 3B-II (LC3-II), an autophagosome-associated lipidated form of LC3-I (28), were increased in response to NDI and even further augmented in combination with 2DG (Fig. 3F). However, RNA interference-mediated knockdown of crucial autophagy genes autophagy-related 5 (ATG5) and ATG7 did not affect cell death in U251 cultures exposed to NDI, 2DG, or their combination (Fig. 3G). These data indicate that apoptosis, ferroptosis, necroptosis, or autophagy, unlike necrosis, are not involved in NDI + 2DG-induced death of U251 cells.
FIGURE 3.

Programmed cell death is not involved in NDI/2DG cytotoxicity. A–G, U251 cells were incubated with NDI (40 μm) and 2DG (10 mm) alone or in combination. Caspase inhibitor QVD-OPH (A), iron chelators deferoxamine (DFX; 100 μm) and BPDS (10 μm) (B), or necroptosis inhibitor necrostatin-1 (NEC-1) (E) were added 30 min before NDI and/or 2DG. D and G, before treatment, U251 cells were transfected with control, RIP1, and MLKL siRNA (D) or control, ATG5, and ATG7 siRNA (G); the insets show the immunoblot verification of the knockdown efficiency. Cytotoxicity was determined by LDH release assay after 24 h (A, B, D, E, and G), whereas the levels of phosphorylated and total RIP and MLKL (C) or LC3-I and LC3-II (F) were analyzed by immunoblot after 2 h and quantified by densitometry. The data are presented as the mean ± S.D. values of triplicates from a representative of three experiments (A, B, D, E, and G) or mean ± S.D. values from three independent experiments (C and F) (#, p < 0.05 versus no treatment; *, p < 0.05 versus no treatment and treatment with NDI or 2DG alone).
NDI and 2DG Synergistically Induce Mitochondrial Depolarization and Oxidative Stress in U251 Cells
Necrotic cell death is often mediated by mitochondrial membrane depolarization and oxidative stress (29). Flow cytometric analysis demonstrated that NDI, and to a lesser extent 2DG, induced a moderate time-dependent mitochondrial depolarization in U251 cells, reflected in a reduced fluorescence (FL2) of MitoTracker Red (Fig. 4A). The exposure to both agents synergistically augmented mitochondrial depolarization, which was clearly visible after only 15 min of treatment (Fig. 4A). The loss of mitochondrial membrane potential in NDI + 2DG-treated cells was also confirmed by fluorescent microscopy of MitoTracker-stained cells (Fig. 4B) and the increase in green/red fluorescence (FL1/FL2) ratio of the mitochondrial potential-sensitive dye JC-1 (Fig. 4C). The observed mitochondrial depolarization was followed by a synergistic increase in the intracellular concentration of mitochondria-derived superoxide, detected by MitoSOX red fluorescence (FL2) after 15 min of combined treatment (Fig. 4D). Accordingly, total production of reactive oxygen species (ROS), measured as dihydrorhodamine 123 (DHR) fluorescence (FL1) (Fig. 4E), as well as the levels of malondialdehyde (MDA) as a marker of lipid peroxidation (Fig. 4F), were also synergistically increased by NDI + 2DG treatment. The antioxidant α-tocopherol (30) markedly reduced mitochondrial depolarization (Fig. 4G), ROS production (Fig. 4H), and the cytotoxicity (Fig. 4I) of NDI/2DG combination. Ultrastructural TEM analysis demonstrated that 2DG, NDI, and their combination, with the increasing potency, caused the appearance of mitochondria with electron-dense matrix and dilated cristae (Fig. 5, A and B), consistent with reversible mitochondrial damage (31). However, a significant increase in the numbers of irreversibly injured swollen mitochondria with hypodense matrix and discontinued cristae or their remnants (32) was observed only in the presence of both agents (Fig. 5, A and B). Consistent with the increased accumulation of an autophagy marker LC3-II (Fig. 3F), NDI alone, and particularly in combination with 2DG, caused the appearance of autophagic vesicles containing cytoplasmic material (Fig. 5, A and C). We also observed some “empty” electron-lucent vesicles resembling dilated lysosomes (Fig. 5A) as previously described in cells treated with the LMP-inducing lysosomal inhibitor chloroquine (33). These results demonstrate that the necrotic cell death triggered by NDI/2DG combination depends on the synergistic induction of mitochondrial damage and oxidative stress, associated with autophagic/lysosomal vacuolation.
FIGURE 4.

Combination of NDI and 2DG induces mitochondrial depolarization and oxidative stress in U251 cells. A–F, U251 cells were incubated with NDI (40 μm) and 2DG (10 mm) alone or in combination for the indicated time periods (A, C–F) or 1 h (B), and mitochondrial membrane potential and ROS production were determined by flow cytometry. Mitochondrial depolarization was assessed by measuring MitoTracker Red (FL2) fluorescence (A) or JC-1 green/red (FL1/FL2) fluorescence ratio (C), superoxide production was analyzed by measuring MitoSOX Red (FL2) fluorescence (D), and total ROS production was determined by measuring DHR (FL1) fluorescence (E). Fluorescent microscopy of MitoTracker-stained cells was used to visualize mitochondrial depolarization (B), whereas lipid peroxidation was determined by MDA assay (F). Representative micrographs are shown in B, whereas the data are presented as the mean ± S.D. values from three independent experiments (A and C–E) or mean ± S.D. values of triplicates from a representative of three experiments (F) (#, p < 0.05 versus no treatment (dashed line); *, p < 0.05 versus no treatment and treatment with NDI or 2DG alone). G–I, U251 cells were incubated with NDI (40 μm) and/or 2DG (10 mm) in the presence or absence of antioxidant α-tocopherol (10 μm). Mitochondrial depolarization (G) and ROS production (H) were determined by flow cytometry after 1 h, whereas the cytotoxicity was assessed by LDH release assay after 24 h (I). The data are presented as the mean ± S.D. values from three independent experiments (G and H) or mean ± S.D. values of triplicates from a representative of three experiments (*, p < 0.05 versus NDI + 2DG treatment).
FIGURE 5.

Combination of NDI and 2DG induces mitochondrial damage. A–C, U251 cells were incubated with NDI (40 μm) and 2DG (10 mm) alone or in combination for 4 h. A, ultrastructural electron microscopy analysis demonstrated the presence of electron-dense mitochondria with dilated cristae (plain arrows) and large vesicles with or without cytoplasmic content (full arrowheads) in NDI- and NDI + 2DG-treated cells as well as swollen mitochondria with hypodense matrix and discontinued cristae (empty arrowheads) in NDI + 2DG-treated cells. B and C, quantification of damaged mitochondria (B) and intracellular vesicles (C) in cells exposed to NDI and 2DG alone or in combination (#, p < 0.05 versus no treatment; *, p < 0.05 versus no treatment and treatment with NDI or 2DG alone; n ≥ 60 cells per treatment).
Synergistic Cytotoxicity of NDI and 2DG Depends on LMP Induction
Because NDI is a lysosomal detergent, we explored the involvement of NDI-triggered LMP in the synergistic cytotoxicity of NDI/2DG combination. The induction of LMP was assessed by staining with the lysosomotropic fluorochromes acridine orange and LysoTracker Green. The ratio of red/green fluorescence (FL3/FL1) of acridine orange as well as the intensity of LysoTracker green fluorescence (FL1) reflect the amount of lysosomal acidic content. The flow cytometric analysis of NDI-treated cells demonstrated a time-dependent reduction in FL3/FL1 ratio of acridine orange (Fig. 6A) and LysoTracker (FL1) fluorescence (Fig. 6B), indicating a decrease in lysosomal acidic content. The effect was observed after 15 min of NDI addition and gradually became more prominent during the next 45 min. Although 2DG failed to exert similar effects, it significantly potentiated NDI-induced decrease in acridine orange FL3/FL1 ratio and LysoTracker fluorescence (FL1) after 1 h of treatment (Fig. 6, A and B). Accordingly, fluorescent microscopy of acridine orange-stained U251 cells demonstrated that the treatment with NDI/2DG combination for 1 h caused an almost complete disappearance of red-fluorescing lysosomes (Fig. 6C), which is consistent with the induction of LMP and subsequent loss of lysosomal content. The observed synergistic induction of LMP was partly prevented by α-tocopherol (Fig. 6D), suggesting the involvement of ROS. Treatment with the cysteine cathepsin inhibitor E64 restored the viability of NDI + 2DG-exposed U251 cells to a certain extent (Fig. 6E), indicating that lysosomal cysteine proteases contributed to cell death. The LMP-inducing lysosomotropic agent chloroquine (9, 10, 34–36) readily mimicked the synergistic contribution of NDI in causing cytotoxicity to 2DG-exposed U251 cells (Fig. 6F). On the other hand, a proton pump inhibitor bafilomycin A1 at the concentration (100 nm) that increases lysosomal pH without apparently causing LMP (35–38), did not synergize with 2DG in killing U251 cells (Fig. 6F). Therefore, it appears that the synergistic cytotoxicity of NDI and 2DG is at least partly mediated by LMP induction.
FIGURE 6.
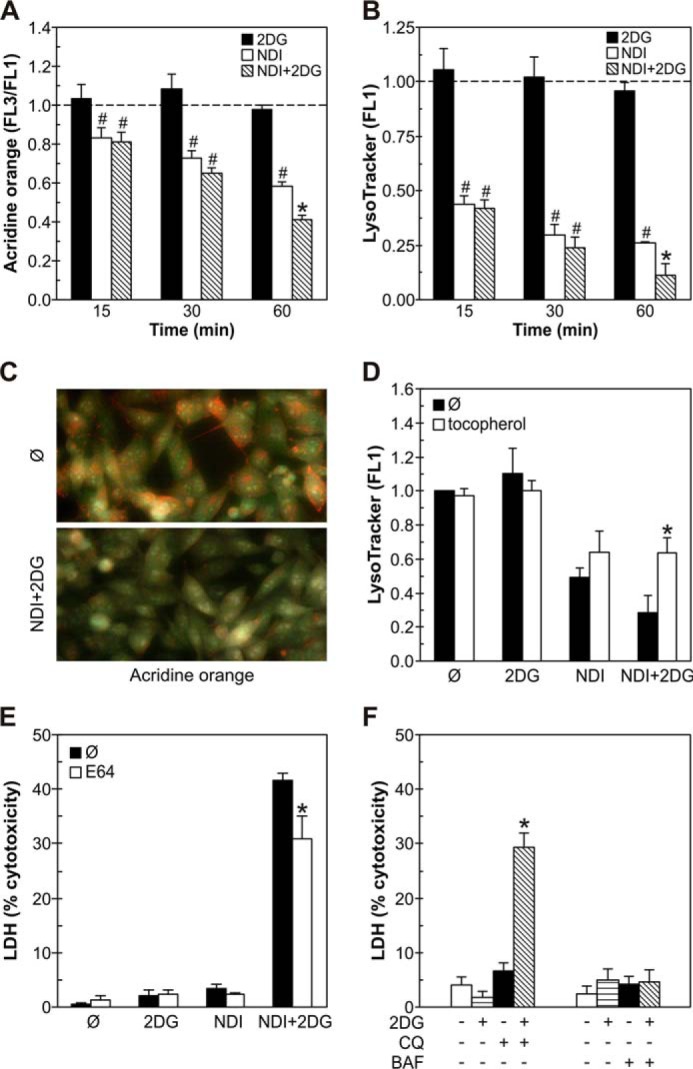
Synergistic cytotoxicity of NDI and 2DG depends on LMP induction. A–C, U251 cells were incubated with NDI (40 μm) and 2DG (10 mm) alone or in combination for the indicated time periods (A and B) or 1 h (C). Cells were stained with lysosomal dyes acridine orange (A and C) or LysoTracker Green (B), and their fluorescence was analyzed by flow cytometry (A and B) or fluorescent microscopy (C). The data are presented as the mean ± S.D. values from three independent experiments (#, p < 0.05 versus no treatment (dashed line); *, p < 0.05 versus no treatment and treatment with NDI or 2DG alone). D, U251 cells were incubated for 1 h with NDI (40 μm) and 2DG (10 mm) alone or in combination in the presence or absence of the antioxidant α-tocopherol (10 μm). The fluorescence (FL1) of LysoTracker-stained cells was assessed by flow cytometry, and the results are presented as the mean ± S.D. values of triplicates from a representative of three experiments (*, p < 0.05 versus corresponding treatment without α-tocopherol). E and F, U251 cells were incubated with NDI (40 μm) and 2DG (10 mm) alone or in combination in the presence or absence of cathepsin inhibitor E64 (50 μm) (E) or with 2DG (10 mm) in the presence or absence of lysosomal inhibitors chloroquine (CQ; 20 μm) or bafilomycin A1 (BAF; 100 nm) (F). The cytotoxicity was determined after 24 h by LDH release assay. The data are presented as the mean ± S.D. values of triplicates from a representative of three experiments (*, p < 0.05 versus corresponding treatment without E64 (E) or versus no treatment and treatment with NDI or 2DG alone (F)).
Synergistic Cytotoxicity of NDI and 2DG Is Associated with ATP Depletion
Because ATP-generating oxidative phosphorylation takes place in mitochondria, which were damaged by NDI, and 2DG is a well known inhibitor of ATP-producing glycolysis, we next investigated the role of energetic stress in the synergistic cytotoxicity of combined treatment. Glucose deprivation as well as glycolytic blockers iodoacetate and sodium fluoride (NaF) (39, 40) mimicked 2DG-mediated synergistic potentiation of NDI cytotoxicity (Fig. 7, A–C), thus supporting the involvement of glycolysis inhibition in this effect. Although both NDI and 2DG alone in a time-dependent manner rapidly reduced the ATP levels in U251 cells, the energy depletion was significantly more pronounced in the cells exposed to both drugs simultaneously (Fig. 7D). Expectedly, the observed decrease in ATP levels was associated with the activation of AMP-activated protein kinase (AMPK) (Fig. 7E), an intracellular energy sensor activated by the increase in AMP/ATP ratio (41). Although each drug alone was able to stimulate the phosphorylation of AMPK and its direct target Raptor, the greatest increase in AMPK/Raptor activity was observed upon combined treatment (Fig. 7E). Thus, our results suggest that NDI-triggered LMP and 2DG-mediated glycolysis inhibition synergistically kill U251 glioma cells through energy depletion.
FIGURE 7.

Synergistic cytotoxicity of NDI and 2DG depends on ATP depletion. A and B, U251 cells were incubated for 24 h with NDI (10–40 μm) in medium with or without glucose. The cell viability was measured by MTT test, and α index for synergism/antagonism was calculated (A), whereas the cytotoxicity was determined by LDH release assay (B). The data are presented as the mean ± S.D. of triplicates from a representative of three experiments (A, upper panel, and B; *, p < 0.05 versus treatment with NDI in medium with glucose) or the mean ± S.D. from three independent experiments (A, lower panel; *, p < 0.05 for α index values of >1). C, U251 cells were incubated for 24 h with NDI (40 μm) in the presence or absence of glycolysis inhibitors iodoacetate (IA; 1.5 mm) or NaF (3 mm), and LDH release assay for cytotoxicity was performed. The data are presented as the mean ± S.D. of triplicates from a representative of three experiments (*, p < 0.05 versus all other treatments). D and E, U251 cells were incubated with NDI (40 μm) and 2DG (10 mm) alone or in combination for the indicated time periods (D) or 2 h (E). The intracellular ATP concentration was determined by bioluminescence assay (D), whereas the levels of phosphorylated and total AMPK and Raptor were analyzed by immunoblots and quantified by densitometry (E) (#, p < 0.05 versus no treatment; *, p < 0.05 versus no treatment and treatment with NDI or 2DG alone).
NDI and 2DG Synergize in Inducing ATP Depletion, Mitochondrial Depolarization, LMP, Oxidative Stress, and Necrotic Death in B16 Melanoma Cells
We next explored if the synergistic cytotoxicity of NDI and 2DG is restricted to U251 glioma cells. In contrast to U251 cells, primary rat astrocytes were almost insensitive to NDI, 2DG, or combined treatment, as demonstrated by crystal violet staining (Fig. 8A) and LDH release test (Fig. 8B). On the other hand, NDI and 2DG readily synergized in reducing cell numbers (Fig. 8C) and inducing cell membrane damage (Fig. 8D) in B16 mouse melanoma cells. In accordance with the data obtained in U251 cells, NDI and 2DG synergized in the induction of ATP depletion (Fig. 8E), mitochondrial depolarization (Fig. 8F), lysosomal permeabilization (Fig. 8G), and oxidative stress (Fig. 8H). Similar results were also observed in C6 rat astroglioma and L929 mouse fibrosarcoma cells (not shown). These findings indicate that similar mechanisms involving energy depletion, mitochondrial depolarization, LMP, and oxidative stress are involved in the synergistic toxicity of NDI and 2DG to different types of cancer cells, whereas non-transformed cells are resistant.
FIGURE 8.

NDI and 2DG synergize in inducing ATP depletion, mitochondrial depolarization, LMP, oxidative stress, and necrotic death in B16 melanoma cells. A–D, U251 cells and primary rat astrocytes were incubated with NDI (40 μm) and 2DG (10 mm) alone or in combination (A and B), whereas B16 mouse melanoma cells were treated with NDI and 2DG at the indicated concentrations (C and D). Cell viability was determined after 24 h by crystal violet (CV) staining (A and C) or LDH release assay (B and D). E–H, B16 cells were incubated with NDI (40 μm) and 2DG (10 mm) alone or in combination for the indicated time periods (E) or 1 h (F–H). Intracellular ATP concentration was determined by bioluminescence assay (E), whereas the fluorescence intensity of MitoTracker Red (F), acridine orange (G), and DHR (H) was analyzed by flow cytometry. The data are presented as the mean ± S.D. values of triplicates from a representative of three experiments (A–E) or mean ± S.D. values from three independent experiments (F–H) (#, p < 0.05 versus no treatment; *, p < 0.05 versus no treatment and treatment with NDI or 2DG alone).
NDI and 2DG Suppress Melanoma Growth in Vivo
Finally, we investigated the possible therapeutic potential of NDI/2DG combination in a mouse melanoma model. Although each drug alone apparently decreased melanoma growth to a certain extent, the differences in the mean tumor weight did not reach statistical significance (Fig. 9A). On the other hand, the mice treated with both NDI and 2DG, compared with control tumor-bearing animals, displayed a significant reduction in tumor volume mass (Fig. 9A). Hematoxylin-eosin (HE) staining demonstrated the presence of massive necrosis in melanoma tissue, but not in the kidneys, livers, or spleens of mice exposed to combined treatment (Fig. 9B). Therefore, the lysosomal detergent NDI and glycolytic inhibitor 2DG synergistically suppress melanoma growth in vivo by inducing necrotic death of cancer cells without causing overt toxicity to healthy tissues.
FIGURE 9.
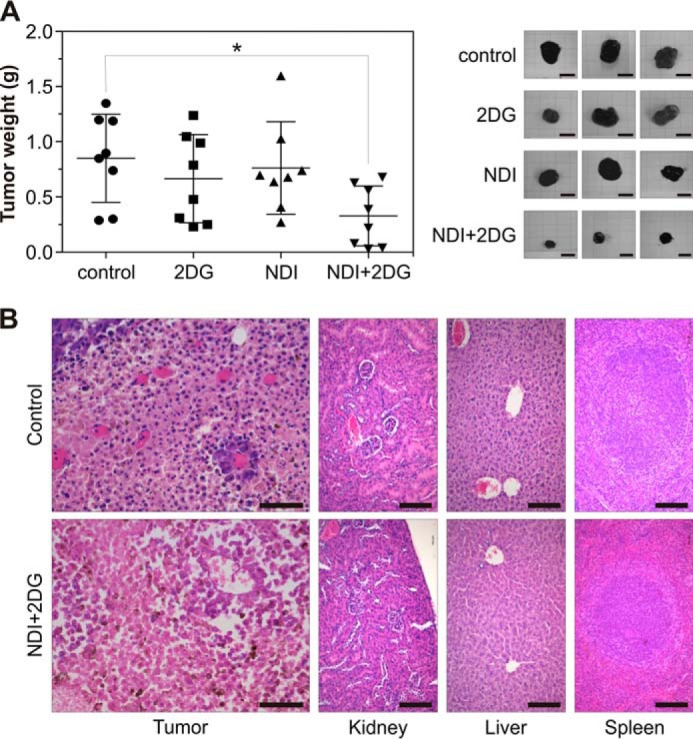
NDI and 2DG suppress melanoma growth in vivo. A and B, 5 days after subcutaneously injection of B16 melanoma cells (3 × 10⁵ cells/mouse), C57Bl/6 mice (n = 8 per group) received oraly 2DG (450 mg/kg) and NDI (100 mg/kg) alone or in combination for the next 16 (A) or 9 days (B). The control group received saline. A, the tumor weight was measured at autopsy, and representative tumors were photographed (scale bar = 1 cm). The results from one of two experiments with similar results are shown, and the data are presented as the mean ± S.D. values (*, p < 0.05 versus control). B, representative micrographs of HE-stained samples of tumor (scale bar = 50 μm), kidney, liver, and spleen (scale bar = 100 μm) tissues from control or NDI + 2DG-treated mice are shown.
Discussion
In the present study we demonstrate a synergistic cooperation between the lysosomal detergent NDI and glycolytic inhibitor 2DG in killing cancer cells. NDI-triggered LMP and 2DG-mediated glycolysis block caused rapid ATP depletion, mitochondrial damage, and oxidative stress, eventually leading to necrotic death of cancer cells in vitro and tumor regression in vivo. Using pharmacological and genetic approaches, we have shown that caspase-dependent apoptosis, iron-dependent ferroptosis, RIP/MLKL-dependent necroptosis, and ATG5/ATG7-dependent autophagy, as distinctive forms of programmed cell death (26, 27), were probably not involved in NDI/2DG cytotoxicity. Our findings are consistent with the proposed role of mitochondrial depolarization, ATP depletion, oxidative stress, and lysosomal disruption in the induction of necrotic cell death (29) as well as with the general concept that the cells with mitochondrial and lysosomal damage are more likely to die by necrosis than apoptosis if their energy resources are low (42, 43). Importantly, another LMP-inducing agent, chloroquine, also displayed a synergistic anticancer effect with 2DG, whereas glycolytic inhibitors iodoacetate and NaF synergistically cooperated with NDI, thus strongly arguing that the observed anticancer effects of NDI and 2DG in combination were indeed due to LMP and glycolysis block, respectively. The involvement of LMP in the cytotoxic action of NDI was further supported by the protective effect of cathepsin inhibitor E64 as well as by the inability of bafilomycin A1, a lysosome-alkalizing agent that does not cause LMP (35–38), to mimic the NDI effect. Although it has recently been shown that chloroquine and 2DG synergize in killing rhabdomyosarcoma and prostate cancer cells (16), our data provide further mechanistic insight into the anticancer interaction of LMP and glycolysis block as well as confirm the in vivo efficiency of this approach.
Both NDI and 2DG alone and their combination in particular were able to trigger rapid ATP decrease in cancer cells and cause energetic stress, as reflected in the activation of the intracellular energy sensor AMPK and its direct target Raptor. Although ATP reduction was a logical consequence of the glycolysis inhibition by 2DG, the connection between NDI-induced LMP and ATP decrease seems less obvious. Our experiments suggest that NDI caused ATP depletion through mitochondrial depolarization and subsequent decrease in oxidative phosphorylation. TEM analysis also revealed the ability of NDI to cause condensation of mitochondrial matrix, which is a known consequence of mitochondrial membrane potential decline (44). These results agree with the findings that other LMP inducers can cause mitochondrial membrane depolarization by cathepsin-dependent and cathepsin-independent mechanisms, the latter possibly involving lysosomal lipases and/or Bcl-2 family members Bax and Bak (36, 37, 45, 46). An incomplete cytoprotective effect of E64 is consistent with the involvement of cysteine cathepsin-independent mechanisms in NDI/2DG-induced mitochondrial and cell damage. It should be noted that NDI has also been found to accumulate in mitochondria (5), so we could not exclude the possibility that mitochondrial dysfunction in our study was partly caused in an LMP-independent manner. 2DG, on the other hand, did not trigger overt mitochondrial damage alone but markedly increased that induced by NDI, as reflected in further loss of mitochondrial membrane potential and TEM-confirmed increase in mitochondrial swelling and degeneration. This could be explained by the fact that mitochondrially stressed cells strive to maintain their mitochondrial potential by hydrolyzing glycolytically generated ATP by F1-ATPase and using the energy to drive the transport of protons across the mitochondrial membrane (47). However, if glycolysis is blocked, this mechanism becomes nonfunctional, and cells succumb to death, as seen when cancer cells were simultaneously exposed to mitochondria-targeting drugs and 2DG (20, 48). We, therefore, propose that NDI-triggered LMP causes initial mitochondrial depolarization that is further increased by 2DG due to the lack of glycolytic ATP required to maintain mitochondrial health, eventually leading to a vicious positive feedback cycle of mitochondrial dysfunction and ATP loss.
The synergistic increase in the levels of MitoSOX, total ROS (DHR), and lipid peroxidation (MDA) as well as the cytoprotection afforded by the antioxidant treatment indicate the important role of oxidative stress in NDI/2DG cytotoxicity. The association of mitochondrial depolarization and superoxide production in NDI/2DG-treated cells is consistent with the fact that the collapse of the mitochondrial membrane potential triggers an increase in superoxide generation by the electron transfer chain (49). This can lead to formation of other ROS, such as H2O2 and hydroxyl radical, and further perpetuation of mitochondrial dysfunction through oxidation of mitochondrial DNA, aconitases, and membrane lipid moieties and facilitation of mitochondrial permeability transition (49). It is also known that oxidative stress-derived H2O2 can enter lysosomes in the vicinity of uncoupled mitochondria and undergo Fenton-type reactions catalyzed by redox-active iron released from iron-containing proteins digested during autophagy (8–10). The hydroxyl radicals generated in this way are extremely reactive and induce lipid peroxidation that can result in destabilization of the lysosomal membrane (8). Whether this occurs in and/or contributes to NDI/2DG-triggered cell death is debatable, as iron chelators failed to exert protection. Even so, lysosomes are extremely vulnerable to hydrogen peroxide because they do not contain H2O2-degrading enzymes, such as catalase or glutathione peroxidases (8). Accordingly, it is possible that the late synergistic enhancement of lysosomal damage during NDI/2DG treatment was caused by mitochondria-derived ROS, as indeed indicated by the ability of α-tocopherol to prevent synergistic induction of LMP. This implies that during the late stages of NDI/2DG-triggered cell damage detrimental positive feedback loops become even more complex, including oxidative stress-mediated lysosomal destabilization that might further potentiate initial mitochondrial depolarization and ATP loss. The released lysosomal enzymes, oxidative stress, and ATP depletion lead to digestion of cytosolic substrates, damage of membrane lipids, and loss of function of homeostatic ion pumps/channels, respectively, eventually culminating in necrotic cell demise.
Energy stress, mitochondrial damage, and oxidative stress are major triggers of autophagy, a macromolecule recycling process in which cytoplasmic content is sequestered in autophagosomal vesicles and degraded upon their fusion with lysosomes (50). Although possibly functioning as a distinct form of programmed cell death in certain situations, autophagy mainly promotes cell survival during energy stress and other adverse conditions (51). For example, ROS-producing depolarized mitochondria are targeted for autophagic removal in a process called mitophagy (52), which reduces oxidative stress and allows residual, undamaged mitochondria to repopulate and rescue the cell (53, 54). 2DG has been found to induce autophagy through activation of the intracellular energy sensor AMPK (55). We have observed that ATP loss induced by NDI/2DG treatment was associated with activation of AMPK and its target Raptor as well as with the increase of LC3-II levels and numbers of autophagic vesicles. However, based on results with other lysosomal inhibitors (28), NDI-triggered increase in LC3-II accumulation and autophagolysosome numbers is more likely to stem from lysosomal inhibition-mediated block in autophagic proteolysis than from autophagy activation. Conversely, the further induction of autophagic markers seen upon 2DG addition probably reflects a genuine increase in autophagosome synthesis, which is more readily revealed when their degradation is blocked by lysosomal inhibition (28). Therefore, one could hypothesize that NDI-mediated lysosomal inhibition killed 2DG-exposed cells at least partly by blocking the protective autophagic response triggered by energy depletion. This, however, would seem unlikely, as bafilomycin A1, a vacuolar (H+)-ATPase inhibitor that alkalizes lysosomes and prevents autophagic proteolysis (28) without causing LMP (35–38), as well as knockdown of autophagy-essential genes ATG5 and ATG7 (56, 57), failed to mimic the synergistic cooperation of NDI and 2DG. This might seem to contradict the findings showing the increase in 2DG cytotoxicity upon pharmacological or genetic inhibition of autophagy, but it should be noted that the effect in these studies was observed after prolonged (48–72 h) incubation of autophagy-deficient cells with 2DG (16, 24, 58, 59). Although this issue requires further exploration, our results nevertheless indicate that autophagy does not play a significant role in modulating rapid NDI/2DG-triggered necrotic death.
Finally, we demonstrated that oral administration of NDI/2DG treatment efficiently reduced tumor progression in a mouse model of melanoma, thus confirming the feasibility of such a therapeutic approach. Although the anticancer effect of NDI to the best of our knowledge has not been investigated in vivo, a few studies reported tumor growth reduction (60) and antimetastatic activity of 2DG in animal models (61). However, in most of the studies 2DG was ineffective when applied alone but stimulated the anticancer activity of various other chemotherapeutics (19, 62–65). Similarly, in our experiments neither 2DG nor NDI were efficient alone (albeit a tendency toward tumor size reduction was noticeable), whereas simultaneous administration of both agents caused significant melanoma regression associated with the massive induction of necrotic tumor cell death in vivo. Importantly, the treatment did not show any gross or microscopic toxicity to major organs, such as liver, kidney, and spleen. Furthermore, the in vitro experiments confirmed that primary rat astrocytes were markedly less sensitive to NDI/2DG combination than glioma and melanoma cell lines. The apparent resistance of normal cells to NDI/2DG treatment might stem from the fact that tumor cells rely more on glycolysis than their normal counterparts (66), which is reflected in higher sensitivity to glucose deprivation of U251 glioma cells compared with primary astrocytes (67). Besides, cancer cells are found to be more susceptible to LMP than normal cells, due to relatively large lysosomes (68, 69), and increased expression and/or activity of certain cysteine cathepsins (70). Accordingly, differentiated HL-60 promyelocytes were less sensitive to NDI than undifferentiated HL-60 cells (7). It is, therefore, conceivable that selective targeting of cancer cells could be efficiently achieved by combination of LMP and glycolysis inhibition.
In conclusion, the synergistic induction of necrotic death in cancer cells exposed to LMP inducer NDI and glycolysis inhibitor 2DG proceeds via complex network of positive feedback loops involving lysosomal damage, mitochondrial depolarization, ATP loss, and oxidative stress, causing tumor regression in vivo without apparent toxicity. Additional studies are required to examine the exact temporal and causal relationships between the observed phenomena as well as the mechanisms and extent of their involvement in NDI + 2DG-triggered necrosis of cancer cells. Nevertheless, our results support further exploration of an anticancer strategy based on a combined treatment with lysosomal detergents and glycolysis inhibitors.
Experimental Procedures
Cell Culture
The human glioma cell line U251 MG and mouse melanoma cell line B16-F0 were obtained from the European Collection of Animal Cell Cultures (Salisbury, UK). Primary astrocytes were isolated from the brains of newborn Albino Oxford rats as previously described (71). The cells were maintained at 37 °C in a humidified atmosphere with 5% CO2 in a HEPES (20 mm)-buffered RPMI 1640 cell culture medium with l-glutamine supplemented with 5% fetal bovine serum, 1 mm sodium pyruvate, and 1% of antibiotic/antimycotic mixture (all from PAA, Pasching, Austria). The cells were harvested using a conventional trypsinization procedure with trypsin/EDTA and seeded in 96-well flat-bottom plates (1 × 10⁴ cells/well) for the cell viability assessment, 24-well plates (1 × 10⁵ cells/well) for the flow cytometric analysis, or 100-mm Petri dishes (2 × 10⁶ cells) for the electron microscopy and immunoblotting. Cells were rested for 24 h and then treated with NDI and/or 2DG in the presence or absence of antioxidant α-tocopherol, cysteine cathepsin inhibitor E64, glycolysis inhibitors sodium iodoacetate and NaF, lysosomal inhibitors bafilomycin A1 and chloroquine, caspase inhibitor QVD-OPH, necroptosis inhibitor necrostatin-1, or iron chelators deferoxamine and BPDS, as described under “Results” and in the figure legends (Fig. 1–8). NDI was obtained from Princeton Global Synthesis (Bristol, PA), necrostatin-1 was from Santa Cruz Biotechnology (Santa Cruz, Dallas, TX), and other reagents were from Sigma. Each compound was added to cells 30 min before NDI and/or 2DG. The control cells were incubated with the appropriate amount (≤0.1%) of vehicle (dimethyl sulfoxide for NDI, bafilomycin, QVD-OPH, and necrostatin-1, or ethanol for α-tocopherol).
Cell Viability and Cytotoxicity Assays
Crystal violet staining of adherent, viable cells and measurement of mitochondria-dependent reduction of MTT (Sigma) to formazan as an indicator of the mitochondrial dehydrogenase activity were used to determine cell viability. The release of the intracellular enzyme LDH as a marker of cell membrane damage was used to assess the number of dead cells. The assays were performed exactly as previously described (72). The results were presented as % of the crystal violet/MTT absorbance, corresponding to the number of viable cells. The percentage of dead cells was determined by LDH assay using the formula ((E − C)/(T − C)) × 100, where E is the experimental absorbance of treated cells, C is the control absorbance of medium without cells, and T is the absorbance corresponding to the maximal (100%) LDH release of Triton X-100-lysed cells.
Synergism Assessment
The type of interaction (additive, synergistic, or antagonistic) between the two treatments was evaluated using the equation α = SF2DG × SFNDI/SF2DG+NDI, where SF2DG and SFNDI represent surviving fractions after 2DG and NDI treatments, respectively, and SF2DG+NDI is the surviving fraction after combined treatment. In this analysis α = 1 indicates an additive effect, α > 1 indicates a synergistic effect, and α < 1 indicates an antagonistic effect (73).
Analysis of Apoptosis and Necrosis
Apoptotic and necrotic cell death was analyzed by double staining with annexin V-FITC and PI (both from BD Biosciences) in which annexin V binds to cells with exposed phosphatidylserine, whereas PI labels the cells with membrane damage. Staining was performed according to the manufacturer's instructions, and the green (FL1) and red (FL2) fluorescence of annexin−PI− (viable), annexin+PI− (apoptotic), and annexin+PI+ (necrotic) cells was analyzed with FACSCalibur flow cytometer (BD Biosciences) equipped with CellQuest software.
Caspase Activation
Activation of caspases, the enzymes involved in the execution of apoptotic cell death, was measured by flow cytometry after labeling the cells with a cell-permeable, FITC-conjugated pan-caspase inhibitor (ApoStat; R&D Systems, Minneapolis, MN) according to the manufacturer's instructions. The increase in green fluorescence (FL1) as a measure of caspase activity was determined using FACSCalibur flow cytometer, and the results are expressed as the % of cells with active caspases.
Measurement of Mitochondrial Membrane Potential
Mitochondrial membrane potential was assessed using JC-1 (Sigma), a lipophilic cation that has the property of aggregating upon membrane polarization, forming an orange-red fluorescent compound. If the mitochondrial membrane potential is disturbed, the dye cannot access the transmembrane space and remains or reverts to its green monomeric form. Cells were stained with JC-1 as described by the manufacturer, and the green monomers and red aggregates were detected by flow cytometry. The results are presented as a green/red fluorescence ratio (mean FL1/FL2, arbitrarily set to 1 in control samples), the increase of which reflects mitochondrial depolarization. Mitochondrial membrane potential was also assessed using MitoTracker Red CMXRos (Life Technologies). The cells were stained with MitoTracker Red as described by the manufacturer and analyzed under Leica DMIL inverted fluorescent microscope equipped with Leica Microsystems DFC320 camera and Leica Application Suite software (Leica Microsystems, Wetzlar, Germany). Alternatively, MitoTracker Red-stained cells were trypsinized and washed, and the mean intensity of red fluorescence (FL2), corresponding to mitochondrial potential, was determined by flow cytometry using a FACSCalibur flow cytometer and CellQuest software. The results are presented relative to the FL2 value of the untreated cells, which was arbitrarily set to 1.
ROS Production and Lipid Peroxidation
Intracellular production of ROS and mitochondrial superoxide generation were determined using redox-sensitive fluorescent probes DHR and MitoSOX Red (both from Thermo Fisher Scientific, Waltham, MA), respectively. DHR (2 μm) was added to cell cultures at the beginning of treatment, whereas MitoSOX Red (5 μm) was added during the last 10 min of treatment. Cells were detached by trypsinization and washed in PBS, and the mean intensity of green (FL1) or red (FL2) fluorescence, corresponding to total ROS production or mitochondrial superoxide generation, respectively, was determined using a FACSCalibur flow cytometer and CellQuest software. The results are presented relative to the FL1 (DHR) or FL3 (MitoSOX Red) value of the untreated cells, which was arbitrarily set to 1. MDA, an indicator of lipid peroxidation, was measured using a colorimetric thiobarbituric acid assay as previously described (74). The results are expressed as -fold change of absorbance intensity (535 nm) compared with control, untreated cells.
Lysosomal Staining
Lysosomes were stained with acridine orange or LysoTracker Green (Thermo Fisher Scientific). At the end of incubation, cells were washed with PBS, stained with acridine orange (1 μm) for 15 min at 37 °C, washed again, and analyzed under the Leica DMIL inverted fluorescent microscope. Lysosomes appeared as orange/red fluorescent cytoplasmic vesicles, whereas nuclei were stained green. Alternatively, acridine orange-stained cells were trypsinized and analyzed by flow cytometry using a FACSCalibur flow cytometer. The acidic lysosomal content was quantified as red/green fluorescence ratio (mean FL3/FL1), and the results are presented relative to the value obtained in untreated cells, which was arbitrarily set to 1. For the staining with LysoTracker Green, cells were washed with PBS and incubated with LysoTracker Green (100 nm) for 5 min at 37 °C. Cells were then trypsinized and washed, and the mean intensity of green fluorescence (FL1), as a measure of lysosomal acidic content, was determined using a FACSCalibur flow cytometer and CellQuest software. The results are presented relative to the FL1 value obtained in untreated cells, which was arbitrarily set to 1.
Intracellular ATP Measurement
The intracellular concentration of ATP was determined using ATP Bioluminescence Assay Kit HS II (Roche Applied Science) according to the manufacturer's instructions. Luminescence was measured by Chameleon microplate reader (Hidex, Turku, Finland).
TEM Analysis
Trypsinized tumor cells were fixed in 3% glutaraldehyde in cacodylate buffer, post-fixed in 1% osmium tetroxide, dehydrated in graded alcohols, and then embedded in Epoxy medium (Sigma). The ultrathin sections were stained in uranyl acetate and lead citrate and examined using a Morgagni 268D electron microscope (FEI, Hillsboro, OR). The images were acquired using a MegaView III CCD camera equipped with iTEM software (Olympus Soft Imaging Solutions, Münster, Germany). The sections and micrographs for the analysis were selected by using Systematic Uniform Random Sampling (75), and the numbers of intact/damaged mitochondria and cytoplasmic vesicles were determined in at least 60 cells for each treatment.
Immunoblotting
After washing away the dead cells, the remaining adherent cells were lysed in lysis buffer (30 mm Tris-HCl, pH 8.0, 150 mm NaCl, 1% Nonidet P-40, and protease/phosphatase inhibitor mixture; all from Sigma) on ice for 30 min and centrifuged at 14,000 × g for 15 min at 4 °C, and the supernatants were collected. Equal protein amounts from each sample were separated by SDS-PAGE and transferred to nitrocellulose membranes (Bio-Rad). Rabbit anti-human antibodies against RIP (SC-7881), MLKL (SC-165024) (Santa Cruz Biotechnology) and AMPKα (#2603), phospho-AMPKα (Thr-172; #2535), Raptor (#2280), phospho-Raptor (Ser-792; #2083), LC3B (#2775), ATG5 (#12994), ATG7 (#8558), phospho-MLKL (Ser-358; #91689), phospho-RIP (Ser-166; #65746), and actin (#4967) (Cell Signaling Technology, Beverly, MA) were used as primary antibodies, whereas peroxidase-conjugated goat anti-rabbit IgG (Jackson ImmunoResearch Laboratories, West Grove, PA) was used as a secondary antibody. Specific protein bands were visualized by enhanced chemiluminescence using ChemiDoc MP Imaging System (Bio-Rad). The protein levels were quantified by densitometry using ImageJ software (National Institutes of Health, Bethesda, MA) and expressed relative to total protein signals (for phosphorylated proteins) or actin (for LC3-II). The results are presented relative to the signal intensity of the untreated control, which was arbitrarily set to 1.
RNA Interference
The transfection of U251 cells with small interfering RNA (siRNA) against human autophagy-related ATG5, ATG7 (Qiagen, Hilden, Germany), RIP, and MLKL (Santa Cruz Biotechnology) or appropriate negative control siRNA was performed using Lipofectamine 2000 (Thermo Fisher Scientific) according to the manufacturer's instructions. After transfection, cells were allowed to grow 24 h before being used for experiments.
In Vivo Induction and Treatment of Melanoma
Primary tumors were induced by subcutaneous injection of 3 × 10⁵ B16 melanoma cells in the dorsal lumbosacral region of syngeneic 5–6 week-old female C57Bl/6 mice (Institute of Biomedical Research, Galenika a.d., Belgrade, Serbia). The mice (n = 32) were kept under a 12:12 h light-dark cycle at 22 ± 2 °C, and their health status was monitored according to Federation of European Laboratory Animal Science Associations (FELASA) guidelines (76). They received standard balanced diet for laboratory mice (D. D. Veterinarski zavod Subotica, Subotica, Serbia) and water ad libitum. Five days after tumor implantation, the animals were randomly divided into four groups (n = 8 per group) using the GraphPad QuickCalcs online calculator (GraphPad Software, La Jolla, CA). The following treatments were administrated daily by oral gavage: 1, control (300 μl of saline solution); 2, NDI (100 mg/kg in 300 μl of saline solution); 3, 2DG (450 mg/kg in 300 μl of saline solution); 4, NDI + 2DG (100 mg/kg of NDI + 450 mg/kg of 2DG in 300 μl of saline solution). At day 14 or 21 after tumor implantation the mice were sacrificed by cervical dislocation following sodium pentobarbitone anesthesia (200 mg/kg i.p.). The tumors were excised, and their weights were measured. Parts of tumors, spleens, kidneys, and livers were fixed in 4% formalin solution and embedded in paraffin. Serial tissue sections (4 μm thick) were deparaffinized in xylol and serial alcohol and were later used for HE staining. Digital images of HE-stained sections were made on an Olympus BX41TF light microscope (Olympus, Tokyo, Japan) equipped with a digital camera. All animal experiments were approved by the Local Animal Care Committee (School of Medicine, University of Belgrade) and conducted in compliance with the Guidelines for the Welfare and Use of Animals in Cancer Research (77).
Statistical Analysis
The statistical significance of the differences was analyzed by t test or analysis of variance followed by Student-Newman-Keuls test for multiple comparisons. A p value of less than 0.05 was considered statistically significant.
Author Contributions
V. T., L. H.-T., and R. A. F. designed the study and wrote the paper. M. K. and K. A.-C. performed cell culture, viability/cytotoxicity assays, fluorescent microscopy, and ATP measurements. V. P. and B. R. performed flow cytometry. M. B. and M. M. performed immunoblotting. A. M. and V. B. performed electron microscopy and histochemistry analysis. M. K., S. P., and N. Z. performed in vivo treatments and tissue isolation.
This work was supported by Ministry of Education, Science, and Technological Development of the Republic of Serbia Grants 41025 (to V. T.) and 173053 (to L. H.-T.). The authors declare that they have no conflicts of interest with the contents of this article.
- LMP
- lysosomal membrane permeabilization
- NDI
- N-dodecylimidazole
- 2DG
- 2-deoxy-d-glucose
- LDH
- lactate dehydrogenase
- AMPK
- AMP-activated protein kinase
- ATG
- autophagy-related
- BPDS
- bathophenanthroline disulfonate
- DHR
- dihydrorhodamine
- HE
- hematoxylin-eosin
- LC3
- microtubule-associated protein 1 light-chain 3
- MDA
- malondialdehyde MLKL mixed lineage kinase domain-like protein
- MTT
- 3-(4,5-dimethylthiazol-2-yl)-2,5-diphenyltetrazolium bromide
- PI
- propidium iodide
- RIP
- receptor interacting protein
- ROS
- reactive oxygen species
- SF
- surviving fraction
- TEM
- transmission electron microscopy
- MitoSOX
- mitochondrial superoxide
- MLKL protein
- mixed lineage kinase domain-like protein
- QVD-OPH
- Quinoline-Val-Asp-CH2-O-Ph.
References
- 1. Kallunki T., Olsen O. D., and Jäättelä M. (2013) Cancer-associated lysosomal changes: friends or foes? Oncogene 32, 1995–2004 [DOI] [PubMed] [Google Scholar]
- 2. Ganapathy-Kanniappan S., and Geschwind J. F. (2013) Tumor glycolysis as a target for cancer therapy: progress and prospects. Mol. Cancer 12, 152. [DOI] [PMC free article] [PubMed] [Google Scholar]
- 3. Firestone R. A., Pisano J. M., and Bonney R. J. (1979) Lysosomotropic agents. 1. Synthesis and cytotoxic action of lysosomotropic detergents. J. Med. Chem. 22, 1130–1133 [DOI] [PubMed] [Google Scholar]
- 4. Firestone R. A., Pisano J. M., Bailey P. J., Sturm A., Bonney R. J., Wightman P., Devlin R., Lin C. S., Keller D. L., and Tway P. C. (1982) Lysosomotropic agents. 4. Carbobenzoxyglycylphenylalanyl, a new protease-sensitive masking group for introduction into cells. J. Med. Chem. 25, 539–544 [DOI] [PubMed] [Google Scholar]
- 5. Miller D. K., Griffiths E., Lenard J., and Firestone R. A. (1983) Cell killing by lysosomotropic detergents. J. Cell Biol. 97, 1841–1851 [DOI] [PMC free article] [PubMed] [Google Scholar]
- 6. Wilson P. D., Firestone R. A., and Lenard J. (1987) The role of lysosomal enzymes in killing of mammalian cells by the lysosomotropic detergent N-dodecylimidazole. J. Cell Biol. 104, 1223–1229 [DOI] [PMC free article] [PubMed] [Google Scholar]
- 7. Wilson P. D., Hreniuk D., and Lenard J. (1989) Reduced cytotoxicity of the lysosomotropic detergent N-dodecylimidazole after differentiation of HL60 promyelocytes. Cancer Res. 49, 507–510 [PubMed] [Google Scholar]
- 8. Terman A., Kurz T., Gustafsson B., and Brunk U. T. (2006) Lysosomal labilization. IUBMB Life 58, 531–539 [DOI] [PubMed] [Google Scholar]
- 9. Boya P., and Kroemer G. (2008) Lysosomal membrane permeabilization in cell death. Oncogene 27, 6434–6451 [DOI] [PubMed] [Google Scholar]
- 10. Repnik U., and Turk B. (2010) Lysosomal-mitochondrial cross-talk during cell death. Mitochondrion 10, 662–669 [DOI] [PubMed] [Google Scholar]
- 11. Aits S., and Jäättelä M. (2013) Lysosomal cell death at a glance. J. Cell Sci. 126, 1905–1912 [DOI] [PubMed] [Google Scholar]
- 12. Boyer M. J., Horn I., Firestone R. A., Steele-Norwood D., and Tannock I. F. (1993) pH dependent cytotoxicity of N-dodecylimidazole: a compound that acquires detergent properties under acidic conditions. Br. J. Cancer 67, 81–87 [DOI] [PMC free article] [PubMed] [Google Scholar]
- 13. Dwarakanath B. S. (2009) Cytotoxicity, radiosensitization, and chemosensitization of tumor cells by 2-deoxy-d-glucose in vitro. J. Cancer Res. Ther. 5, S27–S31 [DOI] [PubMed] [Google Scholar]
- 14. Zhang D., Li J., Wang F., Hu J., Wang S., and Sun Y. (2014) 2-Deoxy-d-glucose targeting of glucose metabolism in cancer cells as a potential therapy. Cancer Lett. 355, 176–183 [DOI] [PubMed] [Google Scholar]
- 15. Zagorodna O., Martin S. M., Rutkowski D. T., Kuwana T., Spitz D. R., and Knudson C. M. (2012) 2-Deoxyglucose-induced toxicity is regulated by Bcl-2 family members and is enhanced by antagonizing Bcl-2 in lymphoma cell lines. Oncogene 31, 2738–2749 [DOI] [PMC free article] [PubMed] [Google Scholar]
- 16. Ramírez-Peinado S., León-Annicchiarico C. L., Galindo-Moreno J., Iurlaro R., Caro-Maldonado A., Prehn J. H., Ryan K. M., and Muñoz-Pinedo C. (2013) Glucose-starved cells do not engage in prosurvival autophagy. J. Biol. Chem. 288, 30387–30398 [DOI] [PMC free article] [PubMed] [Google Scholar]
- 17. Kurtoglu M., Gao N., Shang J., Maher J. C., Lehrman M. A., Wangpaichitr M., Savaraj N., Lane A. N., and Lampidis T. J. (2007) Under normoxia, 2-deoxy-d-glucose elicits cell death in select tumor types not by inhibition of glycolysis but by interfering with N-linked glycosylation. Mol. Cancer Ther. 6, 3049–3058 [DOI] [PubMed] [Google Scholar]
- 18. Bell S. E., Quinn D. M., Kellett G. L., and Warr J. R. (1998) 2-deoxy-d-glucose preferentially kills multidrug-resistant human KB carcinoma cell lines by apoptosis. Br. J. Cancer 78, 1464–1470 [DOI] [PMC free article] [PubMed] [Google Scholar]
- 19. Maschek G., Savaraj N., Priebe W., Braunschweiger P., Hamilton K., Tidmarsh G. F., De Young L. R., and Lampidis T. J. (2004) 2-deoxy-d-glucose increases the efficacy of adriamycin and paclitaxel in human osteosarcoma and non-small cell lung cancers in vivo. Cancer Res. 64, 31–34 [DOI] [PubMed] [Google Scholar]
- 20. Cheng G., Zielonka J., Dranka B. P., McAllister D., Mackinnon A. C. Jr, Joseph J., and Kalyanaraman B. (2012) Mitochondria-targeted drugs synergize with 2-deoxyglucose to trigger breast cancer cell death. Cancer Res. 72, 2634–2644 [DOI] [PMC free article] [PubMed] [Google Scholar]
- 21. Cheong J. H., Park E. S., Liang J., Dennison J. B., Tsavachidou D., Nguyen-Charles C., Wa Cheng K., Hall H., Zhang D., Lu Y., Ravoori M., Kundra V., Ajani J., Lee J. S., Ki Hong W., and Mills G. B. (2011) Dual inhibition of tumor energy pathway by 2-deoxyglucose and metformin is effective against a broad spectrum of preclinical cancer models. Mol. Cancer Ther. 10, 2350–2362 [DOI] [PMC free article] [PubMed] [Google Scholar]
- 22. Mohanti B. K., Rath G. K., Anantha N., Kannan V., Das B. S., Chandramouli B. A., Banerjee A. K., Das S., Jena A., Ravichandran R., Sahi U. P., Kumar R., Kapoor N., Kalia V. K., Dwarakanath B. S., and Jain V. (1996) Improving cancer radiotherapy with 2-deoxy-d-glucose: phase I/II clinical trials on human cerebral gliomas. Int. J. Radiat. Oncol. Biol. Phys. 35, 103–111 [DOI] [PubMed] [Google Scholar]
- 23. Singh D., Banerji A. K., Dwarakanath B. S., Tripathi R. P., Gupta J. P., Mathew T. L., Ravindranath T., and Jain V. (2005) Optimizing cancer radiotherapy with 2-deoxy-d-glucose dose escalation studies in patients with glioblastoma multiforme. Strahlenther Onkol. 181, 507–514 [DOI] [PubMed] [Google Scholar]
- 24. Wang L., Wang J., Xiong H., Wu F., Lan T., Zhang Y., Guo X., Wang H., Saleem M., Jiang C., Lu J., and Deng Y. (2016) Co-targeting hexokinase 2-mediated Warburg effect and ULK1-dependent autophagy suppresses tumor growth of PTEN- and TP53-deficiency-driven castration-resistant prostate cancer. EBioMedicine 7, 50–61 [DOI] [PMC free article] [PubMed] [Google Scholar]
- 25. Los M., Mozoluk M., Ferrari D., Stepczynska A., Stroh C., Renz A., Herceg Z., Wang Z. Q., and Schulze-Osthoff K. (2002) Activation and caspase-mediated inhibition of PARP: a molecular switch between fibroblast necrosis and apoptosis in death receptor signaling. Mol. Biol. Cell 13, 978–988 [DOI] [PMC free article] [PubMed] [Google Scholar]
- 26. Fuchs Y., and Steller H. (2015) Live to die another way: modes of programmed cell death and the signals emanating from dying cells. Nat. Rev. Mol. Cell Biol. 16, 329–344 [DOI] [PMC free article] [PubMed] [Google Scholar]
- 27. Yang W. S., and Stockwell B. R. (2016) Ferroptosis: death by lipid peroxidation. Trends Cell Biol. 26, 165–176 [DOI] [PMC free article] [PubMed] [Google Scholar]
- 28. Rubinsztein D. C., Cuervo A. M., Ravikumar B., Sarkar S., Korolchuk V., Kaushik S., and Klionsky D. J. (2009) In search of an “autophagomometer.” Autophagy 5, 585–589 [DOI] [PubMed] [Google Scholar]
- 29. Zong W. X., and Thompson C. B. (2006) Necrotic death as a cell fate. Genes Dev. 20, 1–15 [DOI] [PubMed] [Google Scholar]
- 30. Traber M. G., and Atkinson J. (2007) Vitamin E, antioxidant and nothing more. Free Radic. Biol. Med. 43, 4–15 [DOI] [PMC free article] [PubMed] [Google Scholar]
- 31. Hackenbrock C. R. (1966) Ultrastructural bases for metabolically linked mechanical activity in mitochondria. I. Reversible ultrastructural changes with change in metabolic steady state in isolated liver mitochondria. J. Cell Biol. 30, 269–297 [DOI] [PMC free article] [PubMed] [Google Scholar]
- 32. Def Webster H., and Ames A. (1965) Reversible and irreversible changes in the fine structure of nervous tissue during oxygen and glucose deprivation. J. Cell Biol. 26, 885–909 [DOI] [PMC free article] [PubMed] [Google Scholar]
- 33. Yoon Y. H., Cho K. S., Hwang J. J., Lee S. J., Choi J. A., and Koh J. Y. (2010) Induction of lysosomal dilatation, arrested autophagy, and cell death by chloroquine in cultured ARPE-19 cells. Invest. Ophthalmol. Vis. Sci. 51, 6030–6037 [DOI] [PubMed] [Google Scholar]
- 34. Dehay B., Ramirez A., Martinez-Vicente M., Perier C., Canron M. H., Doudnikoff E., Vital A., Vila M., Klein C., and Bezard E. (2012) Loss of P-type ATPase ATP13A2/PARK9 function induces general lysosomal deficiency and leads to Parkinson disease neurodegeneration. Proc. Natl. Acad. Sci. U.S.A. 109, 9611–9616 [DOI] [PMC free article] [PubMed] [Google Scholar]
- 35. Seitz C., Hugle M., Cristofanon S., Tchoghandjian A., and Fulda S. (2013) The dual PI3K/mTOR inhibitor NVP-BEZ235 and chloroquine synergize to trigger apoptosis via mitochondrial-lysosomal cross-talk. Int. J. Cancer 132, 2682–2693 [DOI] [PubMed] [Google Scholar]
- 36. Boya P., Gonzalez-Polo R. A., Poncet D., Andreau K., Vieira H. L., Roumier T., Perfettini J. L., and Kroemer G. (2003) Mitochondrial membrane permeabilization is a critical step of lysosome-initiated apoptosis induced by hydroxychloroquine. Oncogene 22, 3927–3936 [DOI] [PubMed] [Google Scholar]
- 37. Boya P., Andreau K., Poncet D., Zamzami N., Perfettini J. L., Metivier D., Ojcius D. M., Jäättelä M., and Kroemer G. (2003) Lysosomal membrane permeabilization induces cell death in a mitochondrion-dependent fashion. J. Exp. Med. 197, 1323–1334 [DOI] [PMC free article] [PubMed] [Google Scholar]
- 38. Denamur S., Tyteca D., Marchand-Brynaert J., Van Bambeke F., Tulkens P. M., Courtoy P. J., and Mingeot-Leclercq M. P. (2011) Role of oxidative stress in lysosomal membrane permeabilization and apoptosis induced by gentamicin, an aminoglycoside antibiotic. Free Radic. Biol. Med. 51, 1656–1665 [DOI] [PubMed] [Google Scholar]
- 39. Mueller W. M., Gregoire F. M., Stanhope K. L., Mobbs C. V., Mizuno T. M., Warden C. H., Stern J. S., and Havel P. J. (1998) Evidence that glucose metabolism regulates leptin secretion from cultured rat adipocytes. Endocrinology 139, 551–558 [DOI] [PubMed] [Google Scholar]
- 40. Malhotra R., and Brosius F. C. 3rd. (1999) Glucose uptake and glycolysis reduce hypoxia-induced apoptosis in cultured neonatal rat cardiac myocytes. J. Biol. Chem. 274, 12567–12575 [DOI] [PubMed] [Google Scholar]
- 41. Hardie D. G., Ross F. A., and Hawley S. A. (2012) AMPK: a nutrient and energy sensor that maintains energy homeostasis. Nat. Rev. Mol. Cell Biol. 13, 251–262 [DOI] [PMC free article] [PubMed] [Google Scholar]
- 42. Kim J. S., He L., and Lemasters J. J. (2003) Mitochondrial permeability transition: a common pathway to necrosis and apoptosis. Biochem. Biophys. Res. Commun. 304, 463–470 [DOI] [PubMed] [Google Scholar]
- 43. Sato T., Machida T., Takahashi S., Murase K., Kawano Y., Hayashi T., Iyama S., Takada K., Kuribayashi K., Sato Y., Kobune M., Takimoto R., Matsunaga T., Kato J., and Niitsu Y. (2008) Apoptosis supercedes necrosis in mitochondrial DNA-depleted Jurkat cells by cleavage of receptor-interacting protein and inhibition of lysosomal cathepsin. J. Immunol. 181, 197–207 [DOI] [PubMed] [Google Scholar]
- 44. Gottlieb E., Armour S. M., Harris M. H., and Thompson C. B. (2003) Mitochondrial membrane potential regulates matrix configuration and cytochrome c release during apoptosis. Cell Death Differ. 10, 709–717 [DOI] [PubMed] [Google Scholar]
- 45. Lee J., Repasy T., Papavinasasundaram K., Sassetti C., and Kornfeld H. (2011) Mycobacterium tuberculosis induces an atypical cell death mode to escape from infected macrophages. PLoS ONE 6, e18367. [DOI] [PMC free article] [PubMed] [Google Scholar]
- 46. Ghosh M., Carlsson F., Laskar A., Yuan X. M., and Li W. (2011) Lysosomal membrane permeabilization causes oxidative stress and ferritin induction in macrophages. FEBS Lett. 585, 623–629 [DOI] [PubMed] [Google Scholar]
- 47. Chinopoulos C. (2011) Mitochondrial consumption of cytosolic ATP: not so fast. FEBS Lett. 585, 1255–1259 [DOI] [PubMed] [Google Scholar]
- 48. Liu H., Hu Y. P., Savaraj N., Priebe W., and Lampidis T. J. (2001) Hypersensitization of tumor cells to glycolytic inhibitors. Biochemistry 40, 5542–5547 [DOI] [PubMed] [Google Scholar]
- 49. Orrenius S., Gogvadze V., and Zhivotovsky B. (2007) Mitochondrial oxidative stress: implications for cell death. Annu. Rev. Pharmacol. Toxicol. 47, 143–183 [DOI] [PubMed] [Google Scholar]
- 50. Parzych K. R., and Klionsky D. J. (2014) An overview of autophagy: morphology, mechanism, and regulation. Antioxid. Redox Signal. 20, 460–473 [DOI] [PMC free article] [PubMed] [Google Scholar]
- 51. Yonekawa T., and Thorburn A. (2013) Autophagy and cell death. Essays Biochem. 55, 105–117 [DOI] [PMC free article] [PubMed] [Google Scholar]
- 52. Wang K., and Klionsky D. J. (2011) Mitochondria removal by autophagy. Autophagy 7, 297–300 [DOI] [PMC free article] [PubMed] [Google Scholar]
- 53. Colell A., Ricci J. E., Tait S., Milasta S., Maurer U., Bouchier-Hayes L., Fitzgerald P., Guio-Carrion A., Waterhouse N. J., Li C. W., Mari B., Barbry P., Newmeyer D. D., Beere H. M., and Green D. R. (2007) GAPDH and autophagy preserve survival after apoptotic cytochrome c release in the absence of caspase activation. Cell 129, 983–997 [DOI] [PubMed] [Google Scholar]
- 54. Tait S. W., Parsons M. J., Llambi F., Bouchier-Hayes L., Connell S., Muñoz-Pinedo C., and Green D. R. (2010) Resistance to caspase-independent cell death requires persistence of intact mitochondria. Dev. Cell 18, 802–813 [DOI] [PMC free article] [PubMed] [Google Scholar]
- 55. Ben Sahra I., Tanti J. F., and Bost F. (2010) The combination of metformin and 2-deoxyglucose inhibits autophagy and induces AMPK-dependent apoptosis in prostate cancer cells. Autophagy 6, 670–671 [DOI] [PubMed] [Google Scholar]
- 56. Matsushita M., Suzuki N. N., Obara K., Fujioka Y., Ohsumi Y., and Inagaki F. (2007) Structure of Atg5.Atg16, a complex essential for autophagy. J. Biol. Chem. 282, 6763–6772 [DOI] [PubMed] [Google Scholar]
- 57. Komatsu M., Waguri S., Ueno T., Iwata J., Murata S., Tanida I., Ezaki J., Mizushima N., Ohsumi Y., Uchiyama Y., Kominami E., Tanaka K., and Chiba T. (2005) Impairment of starvation-induced and constitutive autophagy in Atg7-deficient mice. J. Cell Biol. 169, 425–434 [DOI] [PMC free article] [PubMed] [Google Scholar]
- 58. Xi H., Kurtoglu M., Liu H., Wangpaichitr M., You M., Liu X., Savaraj N., and Lampidis T. J. (2011) 2-Deoxy-d-glucose activates autophagy via endoplasmic reticulum stress rather than ATP depletion. Cancer Chemother Pharmacol. 67, 899–910 [DOI] [PMC free article] [PubMed] [Google Scholar]
- 59. DiPaola R. S., Dvorzhinski D., Thalasila A., Garikapaty V., Doram D., May M., Bray K., Mathew R., Beaudoin B., Karp C., Stein M., Foran D. J., and White E. (2008) Therapeutic starvation and autophagy in prostate cancer: a new paradigm for targeting metabolism in cancer therapy. Prostate 68, 1743–1752 [DOI] [PMC free article] [PubMed] [Google Scholar]
- 60. Mack P., Ahrén B., Jeppsson B., Kan Z., and Bengmark S. (1988) Influence of 2-deoxy-d-glucose and arterial ischaemia on glucose oxidation and growth of liver cancer in the rat. Eur. J. Cancer Clin. Oncol. 24, 1433–1437 [DOI] [PubMed] [Google Scholar]
- 61. Sottnik J. L., Lori J. C., Rose B. J., and Thamm D. H. (2011) Glycolysis inhibition by 2-deoxy-d-glucose reverts the metastatic phenotype in vitro and in vivo. Clin. Exp. Metastasis 28, 865–875 [DOI] [PubMed] [Google Scholar]
- 62. Kim S. M., Yun M. R., Hong Y. K., Solca F., Kim J. H., Kim H. J., and Cho B. C. (2013) Glycolysis inhibition sensitizes non-small cell lung cancer with T790M mutation to irreversible EGFR inhibitors via translational suppression of Mcl-1 by AMPK activation. Mol. Cancer Ther. 12, 2145–2156 [DOI] [PubMed] [Google Scholar]
- 63. Fath M. A., Diers A. R., Aykin-Burns N., Simons A. L., Hua L., and Spitz D. R. (2009) Mitochondrial electron transport chain blockers enhance 2-deoxy-d-glucose induced oxidative stress and cell killing in human colon carcinoma cells. Cancer Biol. Ther. 8, 1228–1236 [DOI] [PMC free article] [PubMed] [Google Scholar]
- 64. Tagg S. L., Foster P. A., Leese M. P., Potter B. V., Reed M. J., Purohit A., and Newman S. P. (2008) 2-Methoxyoestradiol-3,17-O,O-bis-sulphamate and 2-deoxy-d-glucose in combination: a potential treatment for breast and prostate cancer. Br. J. Cancer 99, 1842–1848 [DOI] [PMC free article] [PubMed] [Google Scholar]
- 65. Simons A. L., Fath M. A., Mattson D. M., Smith B. J., Walsh S. A., Graham M. M., Hichwa R. D., Buatti J. M., Dornfeld K., and Spitz D. R. (2007) Enhanced response of human head and neck cancer xenograft tumors to cisplatin combined with 2-deoxy-d-glucose correlates with increased 18F-FDG uptake as determined by PET imaging. Int. J. Radiat. Oncol. Biol. Phys. 69, 1222–1230 [DOI] [PMC free article] [PubMed] [Google Scholar]
- 66. Warburg O. (1956) On the origin of cancer cells. Science 123, 309–314 [DOI] [PubMed] [Google Scholar]
- 67. Jelluma N., Yang X., Stokoe D., Evan G. I., Dansen T. B., and Haas-Kogan D. A. (2006) Glucose withdrawal induces oxidative stress followed by apoptosis in glioblastoma cells but not in normal human astrocytes. Mol. Cancer Res. 4, 319–330 [DOI] [PubMed] [Google Scholar]
- 68. Glunde K., Guggino S. E., Solaiyappan M., Pathak A. P., Ichikawa Y., and Bhujwalla Z. M. (2003) Extracellular acidification alters lysosomal trafficking in human breast cancer cells. Neoplasia 5, 533–545 [DOI] [PMC free article] [PubMed] [Google Scholar]
- 69. Ono K., Kim S. O., and Han J. (2003) Susceptibility of lysosomes to rupture is a determinant for plasma membrane disruption in tumor necrosis factor α-induced cell death. Mol. Cell Biol. 23, 665–676 [DOI] [PMC free article] [PubMed] [Google Scholar]
- 70. Palermo C., and Joyce J. A. (2008) Cysteine cathepsin proteases as pharmacological targets in cancer. Trends Pharmacol. Sci. 29, 22–28 [DOI] [PubMed] [Google Scholar]
- 71. McCarthy K. D., and de Vellis J. (1980) Preparation of separate astroglial and oligodendroglial cell cultures from rat cerebral tissue. J. Cell Biol. 85, 890–902 [DOI] [PMC free article] [PubMed] [Google Scholar]
- 72. Kaludjerović G. N., Miljković D., Momcilović M., Djinović V. M., Mostarica Stojković M., Sabo T. J., and Trajković V. (2005) Novel platinum(IV) complexes induce rapid tumor cell death in vitro. Int. J. Cancer 116, 479–486 [DOI] [PubMed] [Google Scholar]
- 73. Drewinko B., Loo T. L., Brown B., Gottlieb J. A., and Freireich E. J. (1976) Combination chemotherapy in vitro with adriamycin. Observations of additive, antagonistic, and synergistic effects when used in two-drug combinations on cultured human lymphoma cells. Cancer Biochem. Biophys. 1, 187–195 [PubMed] [Google Scholar]
- 74. Vucicevic L., Misirkic-Marjanovic M., Paunovic V., Kravic-Stevovic T., Martinovic T., Ciric D., Maric N., Petricevic S., Harhaji-Trajkovic L., Bumbasirevic V., and Trajkovic V. (2014) Autophagy inhibition uncovers the neurotoxic action of the antipsychotic drug olanzapine. Autophagy 10, 2362–2378 [DOI] [PMC free article] [PubMed] [Google Scholar]
- 75. Gundersen H. J., Jensen E. B., Kiêu K., and Nielsen J. (1999) The efficiency of systematic sampling in stereology: reconsidered. J. Microsc. 193, 199–211 [DOI] [PubMed] [Google Scholar]
- 76. Nicklas W., Baneux P., Boot R., Decelle T., Deeny A. A., Fumanelli M., and Illgen-Wilcke B. (2002) Recommendations for the health monitoring of rodent and rabbit colonies in breeding and experimental units. Lab. Anim. 36, 20–42 [DOI] [PubMed] [Google Scholar]
- 77. Workman P., Aboagye E. O., Balkwill F., Balmain A., Bruder G., Chaplin D. J., Double J. A., Everitt J., Farningham D. A., Glennie M. J., Kelland L. R., Robinson V., Stratford I. J., Tozer G. M., Watson S., Wedge S. R., and Eccles S. A. (2010) Guidelines for the Welfare and Use of Animals in Cancer Research. Br. J. Cancer 102, 1555–1577 [DOI] [PMC free article] [PubMed] [Google Scholar]