Abstract
Guanosine-5′-monophosphate reductase (GMPR) catalyzes the reduction of GMP to IMP and ammonia with concomitant oxidation of NADPH. Here we investigated the structure and dynamics of enzyme-bound substrates and cofactors by measuring 31P relaxation rates over a large magnetic field range using high resolution field cycling NMR relaxometry. Surprisingly, these experiments reveal differences in the low field relaxation profiles for the monophosphate of GMP compared with IMP in their respective NADP+ complexes. These complexes undergo partial reactions that mimic different steps in the overall catalytic cycle. The relaxation profiles indicate that the substrate monophosphates have distinct interactions in E·IMP·NADP+ and E·GMP·NADP+ complexes. These findings were not anticipated by x-ray crystal structures, which show identical interactions for the monophosphates of GMP and IMP in several inert complexes. In addition, the motion of the cofactor is enhanced in the E·GMP·NADP+ complex. Last, the motions of the substrate and cofactor are coordinately regulated; the cofactor has faster local motions than GMP in the deamination complex but is more constrained than IMP in that complex, leading to hydride transfer. These results show that field cycling can be used to investigate the dynamics of protein-bound ligands and provide new insights into how portions of the substrate remote from the site of chemical transformation promote catalysis.
Keywords: biophysics, dehydrogenase, enzyme catalysis, nuclear magnetic resonance (NMR), nucleoside/nucleotide biosynthesis, GMPR, cofactor dynamics
Introduction
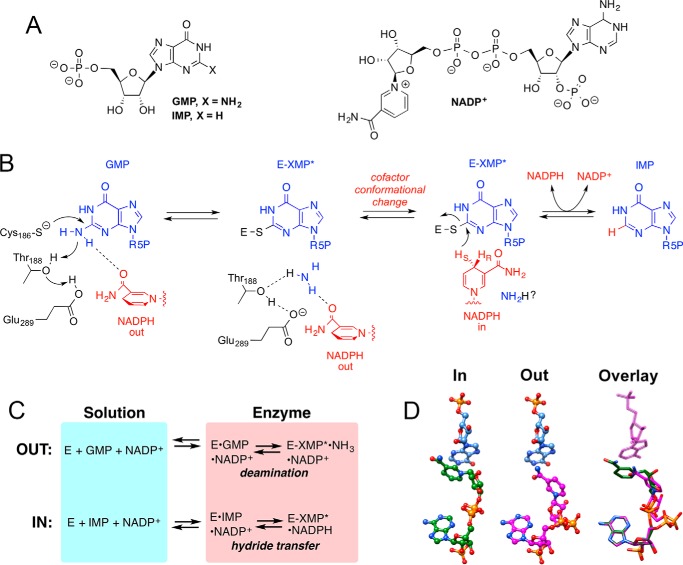
Enzymes modulate the dynamics of bound substrates and cofactors. Although this modulation is a critical feature of catalysis, few studies have addressed the dynamics of bound ligands experimentally. Guanosine-5′-monophosphate reductase (GMPR)3 presents an excellent opportunity to investigate the dynamics of substrate and cofactor conformations in an enzyme active site. GMPR catalyzes the reductive deamination of GMP to IMP and NH3 with concomitant oxidation of NADPH (Fig. 1). This enzyme plays an important role in the interconversion of guanine and adenine nucleotides and can also provide a route for GMP biosynthesis in ammonia-rich environments. The enzyme is a homotetramer of 37-kDa subunits. The GMPR monomer has a (β/α)8 structure, also known as a TIM barrel, which is the most common enzyme fold, and contains the standard phosphate binding loop that is found throughout the TIM barrel superfamily (1, 2). The reaction consists of two different chemical transformations, deamination and hydride transfer (3). In the deamination step, Cys186 attacks C2 of GMP to create a covalent thioimidate intermediate (E-XMP*; Fig. 1, A and B). The ammonia leaving group is activated by proton relay through the Thr188-Glu289 dyad. Approximately 15–20% of the enzyme accumulates as E-XMP* during the steady state. The second step involves hydride transfer from NADPH to E-XMP*, producing IMP. GMPR also catalyzes two partial reactions: 1) GMP reacts to form ∼20% E-XMP*·NH3 in the presence of NADP+, and 2) in the absence of ammonia, IMP and NADP+ react to form ∼20% E-XMP*·NADPH (Fig. 1C) (3).
FIGURE 1.
The GMPR reaction. A, structures of substrates and cofactor. B, the proposed mechanism. C, partial reactions catalyzed by GMPR. D, the superimposed IN and OUT IMP and cofactor conformations as found in the x-ray crystal structure of E·IMP·NADPH (PDB entry 2C6Q). In the overlay, IMP from the OUT conformation is displayed as green lines, visible through the transparent magenta sticks of IMP from the IN conformation. This figure was rendered with UCSF Chimera (27).
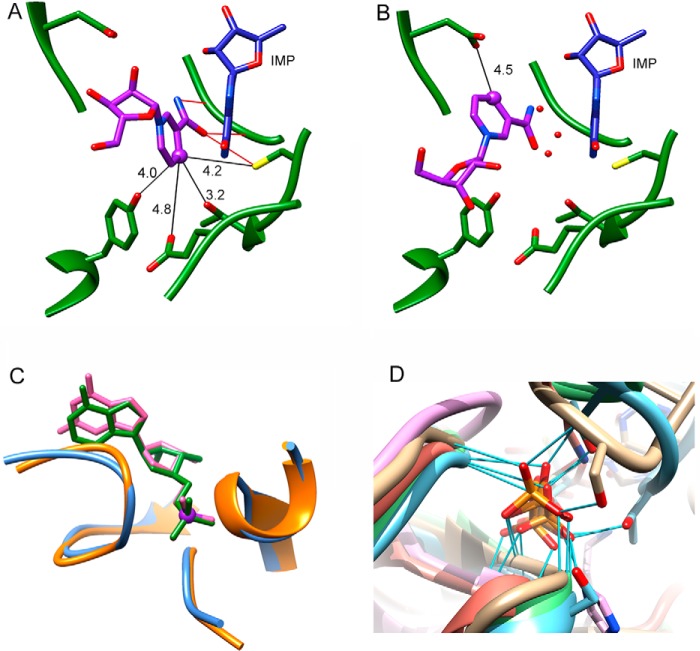
How does GMPR catalyze two different chemical transformations at the same active site? X-ray crystal structures of the GMPR complex with IMP and NADPH revealed the presence of two different cofactor conformations (Fig. 1D) (3). In the “IN” conformation, the nicotinamide ring of the cofactor is stacked parallel against the purine base of IMP, in an alignment suitable for hydride transfer. In the “OUT” conformation, the nicotinamide is far away from the purine ring, as would be required for the deamination step. In addition, in the IN conformation, the nicotinamide predominantly interacts with atoms from protein and IMP (Figs. 1D and 2A), whereas in the OUT conformation, the nicotinamide moves away from IMP and interacts with several water molecules (Fig. 2B). The cofactor diphosphates also change position, whereas the adenosine portion of the cofactor, including the monophosphate, remains in the same position. Likewise, the position of IMP, including the monophosphate, is unchanged in the two complexes (Fig. 1D). The position of IMP observed in the NADPH complex is very similar to that of GMP in the binary E·GMP complex (Fig. 2C) (4). The substrate monophosphates bind in the standard phosphate binding site found in many (β/α)8 proteins. These observations suggest that the interactions of the substrate monophosphate remain constant throughout the catalytic cycle.
FIGURE 2.
Interactions of substrate and cofactors with GMPR. A, interaction of nicotinamide riboside (purple) in the IN conformation (PDB code 2C6Q; subunit B). Residues within 5 Å of nicotinamide are shown (the diphosphates and 2′-phosphoadenosine are omitted for clarity). The distances are depicted by black lines and have Å units. Nicotinamide hydrogen bonds are presented by red lines. IMP is depicted in blue, and GMPR is shown in green. B, interactions of the nicotinamide riboside portion of NADP+ (purple) in the OUT conformation (PDB code 2C6Q; subunit A). The red spheres represent additional water molecules that were found in the OUT conformation within 3.5 Å of inosine. C, substrate phosphate group binding in GMPR. Structure and interaction of phosphate group in E·GMP (backbone in orange and GMP in magenta; PDB code 2A7R) and E·IMP·NADPH (backbone in steel blue and IMP in green; PDB code 2C6Q) crystal structures. D, superposition of the standard phosphate binding site in (β/α)8 barrel proteins. Representatives of five different (β/α)8 superfamilies are shown (2): GMPR (2C6Q, chain A) (tan); thiamine phosphate synthase (2TPS, chain A) (blue); quinolinate phosphoribosyltransferase (1QPR, chain A) (pink); triose-phosphate isomerase (1TPH, chain 1) (green); and ribulose-bisphosphate carboxylase/oxygenase (1RBL, chain A) (orange). The hydrogen bonds between the phosphate group and the protein residues are depicted by light blue lines. This figure was rendered with UCSF Chimera (27).
Although there is some experimental support for the catalytic relevance of the IN and OUT conformations (3), it is important to recognize that the E·IMP·NADPH complex is inert and may not actually mimic catalytically competent complexes. More importantly, the static views provided by the x-ray crystal structure do not provide any information about the dynamics of bound substrates and cofactors.
We used an underappreciated NMR technique, subtesla high resolution field cycling NMR relaxometry (5–9), to study the dynamics of GMP, IMP, and NADP+ 31P nuclei when bound to GMPR. Field cycling relaxometry, particularly of 1H, is a mature field (10–12). Major components of the sample (often solvent) dominate the relaxation profile because all chemical shifts overlap as the field decreases. The extension of field cycling to a “high resolution” mode provides a way of separating the relaxation rates for multiple species in solution. The experiment consists of polarizing spins of molecules at high field, shuttling the sample to low field for relaxation, and then returning the sample back to the high field to measure the resultant magnetization of each nucleus of interest (5, 6). This provides a way to measure spin-lattice relaxation rates over a wide magnetic field range (from 11.7 down to 0.003 T) for multiple molecules binding to the same protein or macromolecular complex regardless of its size. Variations of this technique have monitored 31P resonances for soluble ligands binding to membrane-localized proteins (13) and identified specific phospholipid binding sites on proteins transiently bound to membranes (14–16).
For a small molecule in solution, chemical shift anisotropy (CSA) dominates the 31P spin-lattice relaxation rate, R1, in high magnetic fields; by comparison, the dipolar contribution to relaxation is very small. However, if the small molecule spends part of its time bound in a larger complex, such as an enzyme, then the observed R1 is a weighted average of the very small R1 of the free population and the much larger R1 of the bound population. This effect depends on magnetic field strength, the ratio of ligand to protein, and the proximity of the 31P to proton dipoles in either the small molecule or the enzyme.
Our field cycling results demonstrate a difference in the dynamics of bound substrates and cofactors in GMPR, as measured by correlation time. This finding is in contrast to crystal structures of the complexes, which suggest comparable interactions of substrates with the protein. Relaxation profiles show the importance of the substrate phosphate group in the catalytic reaction and how ligand dynamics change in each step of the reaction. These observations are not consistent with the conventional view that such distal phosphate groups simply tether their substrates to the active site. Instead, the phosphate group must actively participate in the catalytic cycle.
Results
IMP and GMP Are in Fast Exchange with GMPR
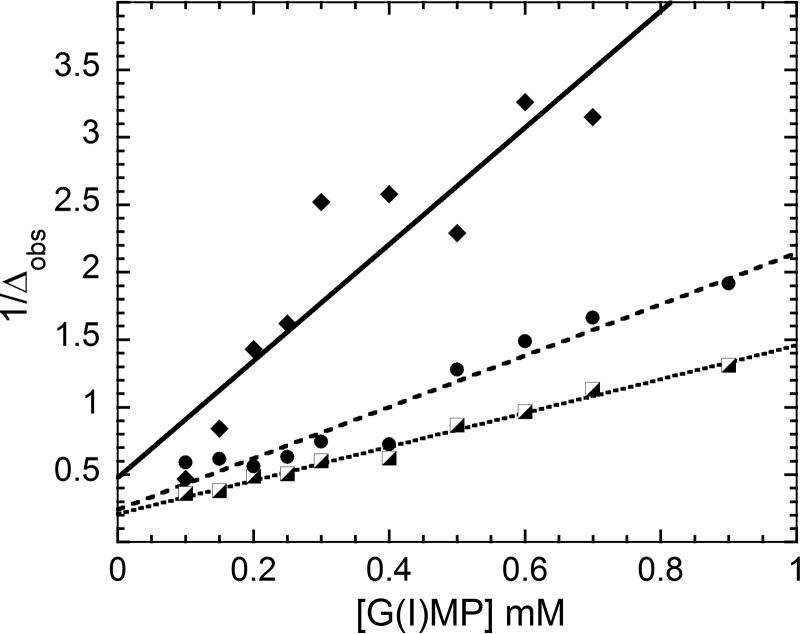
To compare the relaxation properties of two different ligand complexes, the ligands must both be in fast exchange, and the exchange must occur on the same time scale. To confirm that IMP and GMP have similar exchange properties in their respective NADP+ complexes, we monitored the NMR line widths of the H2 and H8 protons upon the addition of GMPR (hypoxanthine (8.5 and 8.1 ppm) and guanine (8.1 ppm), respectively; Fig. 3). The chemical shifts of these protons are well resolved. The concentration of IMP or GMP was varied between 0.1 and 1.2 mm at fixed enzyme and NADP+ concentrations (0.05 and 0.06 mm, respectively). The average dissociation constants are 165 ± 36 and 110 ± 60 μm for IMP and GMP, respectively. These results indicate that IMP and GMP bind to the protein in the fast exchange regime, and GMPR should be saturated with each substrate ligand under the conditions of the field cycling experiments. Thus, any difference in extracted field cycling parameters must derive from different time-averaged proximities of the substrate monophosphates to protons inside the active site. Likewise, NADP+ binds to the protein in the fast exchange regime. NMR line width analysis of well resolved cofactor protons (nicotinamide (9.2 ppm) and adenosine (8.3 ppm)) gave average dissociation constants of 120 ± 50 and 40 ± 10 μm for E·IMP·NADP+ and E·GMP·NADP+ complexes, respectively.
FIGURE 3.
Changes in the line width of GMP and IMP protons in the presence of GMPR and NADP+. The plot shows the reciprocal of the change in ligand line width with an increase of [L]0 (total ligand concentration) at constant protein and NADP+ concentrations: GMP H8 (8.1 ppm; filled diamonds); IMP, H2 (8.5 ppm; half-filled squares) and H8 (8.1 ppm; filled circles). Here line width is defined as a full width of the 1H resonance at half-height as measured at 800 MHz.
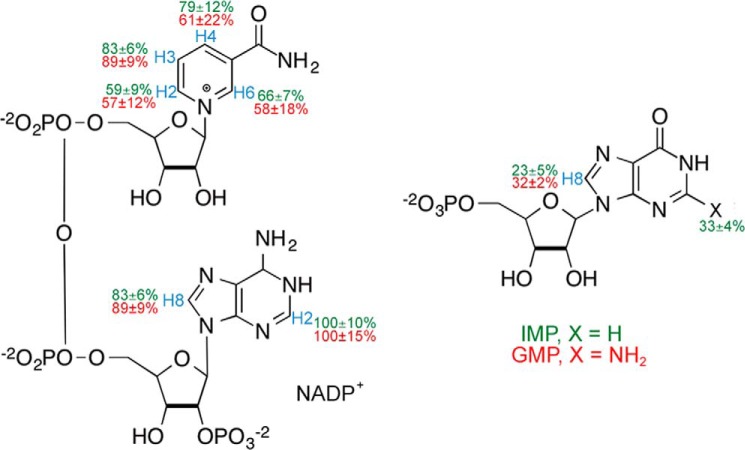
We also performed saturation transfer difference 1H NMR (STD-NMR) experiments at 800 MHz to characterize the substrate and cofactor binding epitopes (17). In this method, the selective saturation of some protein signals is efficiently spread throughout the protein by spin diffusion (intramolecular NOEs). Magnetization also transfers to ligand protons in contact with the protein surface (intermolecular NOEs). If the free and bound ligand states are in fast exchange, saturation can be observed in the free ligand signal. Furthermore, the transfer of magnetization will be more efficient with a much stronger corresponding STD signal for those hydrogen atoms of the ligand establishing close contacts to the protein surface. The STD signals of H2 and H8 of the adenosine moiety of NADP+ are similar in both complexes, suggesting that the interactions of this portion of the cofactor with protein are the same. This finding is also consistent with the x-ray crystal structure of the E·IMP·NADPH complex, which shows that the adenosine portion of the cofactor has identical interactions in both the IN and OUT conformations (3). The STD signals of the nicotinamide protons are also similar, although there is much greater error associated with the GMP complex, perhaps reflecting a more dynamic cofactor in the E·GMP·NADP+ (see below). The crystal structure suggests that three protein residues are within 4 Å of H4 in the IN cofactor conformation, whereas only one protein residue is near H4 in the OUT conformation (Figs. 2 (A and B) and 4). Although the errors in measuring the STD signal are significant, all protons from the nicotinamide except H4 show the same average effect in the two ternary complexes. Thus, H4 may have an increased STD signal in the E·IMP·NADP+ complex because the cofactor is spending more time in the IN conformation in E·IMP·NADP+ than in E·GMP·NADP+. In contrast to the cofactor, the STD results show slightly different, but statistically real, protein-to-ligand magnetization transfer for the H8 of IMP and GMP in both complexes (Fig. 4) with a higher value, 32 ± 2% for GMP compared with 23 ± 3% for IMP. The magnitude of the STD for this substrate proton is also considerably smaller than that for the cofactor protons. The crystal structures show the same protein-ligand interactions for the purine bases of IMP and GMP (Fig. 2C). However, the STD results suggest that there may be a difference in substrate interactions with the protein.
FIGURE 4.
Epitope mapping of G(I)MP and NADP+. STD-NMR results for 2 mm IMP/GMP and NADP+ in the presence of 40 μm GMPR. Protons are labeled in blue. The relative degree of saturation of the individual hydrogens is mapped onto the structure and normalized to the largest STD intensity of hydrogen H2 for adenosine for E·IMP·NADP+ (X = H, green) and E·GMP·NADP+ (X = NH2, red). For more explanation, see “Experimental Procedures.”
In summary, these NMR experiments show that 1) ligands are in fast exchange between protein bound and free states, and 2) on fast time scales, the cofactor engages in similar interactions with the protein, whereas there is a small difference for the substrate with a higher magnetization transfer for GMP. However, these experiments do not really address dynamics and environments of the bound ligand species on a slower time scale that might shed light on catalysis.
The Low Field Values of R1 of Substrate 31P Nuclei Increase When Bound to GMPR
31P field cycling experiments were used to determine the relaxation rates of 31P nuclei in the E·IMP·NADP+ and E·GMP·NADP+ complexes and compare the conformational dynamics of substrates and cofactors during the GMPR reaction. As noted above, E·IMP·NADP+ undergoes a partial reaction to E-XMP*·NADPH, which involves the structural and functional features of the IN cofactor conformation. Likewise, E·GMP·NADP+ undergoes the partial deamination reaction, which is believed to require the OUT conformation. Typical one-dimensional 31P spectra for different relaxation delays at 0.2 T are shown in Fig. 5, in this case for the cofactor diphosphate resonances in the E·GMP·NADP+ complex.
FIGURE 5.
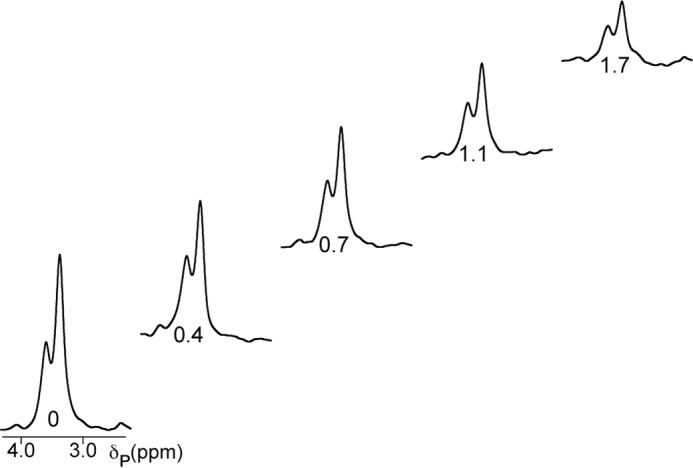
31P spectra from the R1 experiment at 0.2 T for the NADP+ diphosphate resonances. The sample contains 0.4 mm GMPR, 1.6 mm GMP, and NADP+ in 75 mm Tris-HCl, pH 7.8. The relaxation delay time in seconds spent at 0.2 T is shown below each spectrum.
In the absence of enzyme, the 31P resonances in all of the phosphorylated small molecules exhibit a small constant value of R1 at low fields (<1 T) that rises at higher fields (>4 T) due to CSA relaxation. The inset in Fig. 6 shows this increase in R1 at high fields for the IMP 31P. The value of τ for this relaxation mechanism is <1 ns. This behavior is typical for 31P in small molecules in solution.
FIGURE 6.
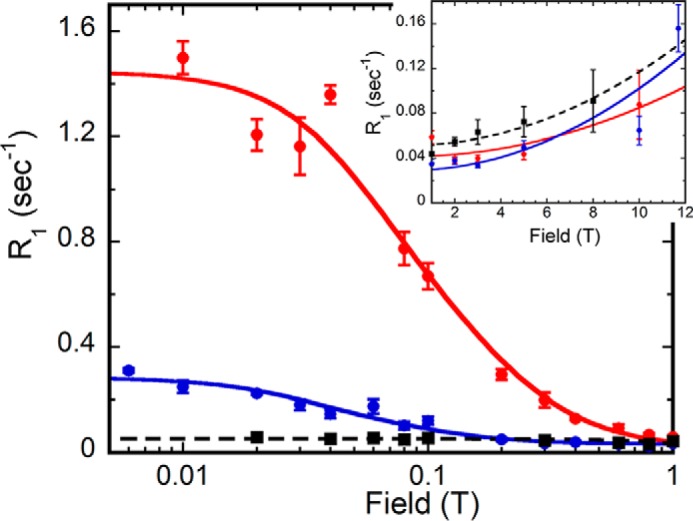
Field dependence of substrate monophosphates R1 in the presence and the absence of GMPR. Samples (E·IMP·NADP+ in red, E·GMP·NADP+ in blue, IMP/NADP+ in black) are in 75 mm Tris-HCl, pH 7.8, 100 mm KCl, 1 mm DTT, and 0.5 mm EDTA with 24% D2O. The lines represent the best fit of Equation 6 to these data. The inset shows the high field part of the same data expanded for clarity. Error bars, S.E.
When GMPR was added to the IMP/NADP+ sample, the values of R1 increased significantly at low field (Fig. 6 and Table 1). Such increases are expected if free substrate is in fast exchange with enzyme-bound substrate. In terms of the spectral densities used to describe the relaxation behavior (see “Experimental Procedures”), this occurs when ω2 τ2 ≪ 1. The increase in R1 at low fields occurs because the ligand is more effectively relaxed (with correlation time τ) by nearby protons when it is bound to the tetrameric enzyme. These 31P-1H dipolar interactions can be intermolecular (via proton residues on the enzyme) as well as intramolecular (the P-O-C-H interactions). In the presence of enzyme, the effective value of the correlation time τ for the bound IMP dipolar interaction shown in Fig. 6 was 45 ± 2 ns. At least three different field cycling experiments were performed with each ternary complex, wherein individual R1 data were acquired at a minimum of 15 different fields. In the case of IMP in the E·IMP·NADP+ complex, the average over all of the experiments was 55 ± 12 ns (Table 1).
TABLE 1.
Relaxation parameters for 31P for E·NADP+ complexes of IMP and GMP extracted from field cycling experiments
| 31P | Complex | τa | R0a | τ /R0 (× 108)a |
|---|---|---|---|---|
| ns | s−1 | |||
| IMP | IMP·NADP+ | 55 ± 12 | 1.9 ± 0.9 | 3.3 ± 1.1b |
| GMP | GMP·NADP+ | 72 ± 13 | 0.30 ± 0.02 | 24 ± 5b |
| NADP+ monophosphate | IMP·NADP+ | 103 ± 23 | 2.9 ± 1.2 | 3.8 ± 0.9 |
| GMP·NADP+ | 47 ± 11 | 0.6 ± 0.1 | 8.6 ± 2.3 | |
| NADP+ diphosphates | IMP·NADP+ | 88 ± 13 | 1.4 ± 0.3 | 6.6 ± 1.2 |
| 82 ± 17 | 1.6 ± 0.3 | 5.1 ± 0.9 | ||
| GMP·NADP+ | 44 ± 5 | 0.5 ± 0.2 | 9.2 ± 2.4 | |
| 45 ± 8 | 0.5 ± 0.1 | 9.3 ± 2.5 |
a Each τ, R0, and τ/R0 entry is the average of values determined in at least three independent experiments; the error is the S.D.
b One field cycling experiment; the error is S.E.
GMP in the E·GMP·NADP+ complex also showed an increase in R1 at low fields (Fig. 6). The value of τ for protein-bound GMP was 64 ± 10 ns in the experiment shown. The average τ from several experiments was 72 ± 13 ns, similar to that of IMP (Table 1).
Substrate Proximity to Effective Relaxer Protons Varies in Cofactor Complexes with GMPR
STD-NMR experiments showed similar binding epitopes for both substrates bound to GMPR, at least in reference to the purine rings. Superposition of the structures of the E·IMP·NADPH and E·GMP complexes shows that the substrate phosphate groups are perfectly aligned, as are the surrounding protein residues (Fig. 2C). Crystal structures of E·IMP·NADPH and E·GMP show that the substrate phosphate groups bind to the standard phosphate binding site in the (β/α)8 barrel protein superfamily (Fig. 2D) (1, 2). These observations suggest that substrate phosphate groups also bind at the same site in E·IMP·NADP+ and E·GMP·NADP+ complexes.
Surprisingly, although the values of τ are similar, field cycling shows that the values of R0 (the relaxation rate extrapolated to zero field) for the 31P nuclei of IMP and GMP are strikingly different in the two NADP+ complexes (Fig. 6 and Table 1). R0 is related to the averaged distance of the 31P to the protons that relax it. The value of R0 for the 31P of GMP is lower than that of IMP by more than a factor of 6 (Table 1), suggesting a significant difference in the binding dynamics of the two substrates.
The sixth root of the ratio τ/R0 is proportional to the distance between the 31P nuclei and relaxer protons. The value of τ/R0 is almost 8-fold higher for GMP than IMP. The calculated reff, the on-enzyme distance between the 31P and nearby relaxer protons, is correspondingly higher for the 31P of GMP. The extrapolated 31P–1H distances for the substrate phosphate are 4.1 ± 0.2 Å for E·GMP·NADP+ and 2.9 ± 0.2 Å for E·IMP·NADP+. Because both GMP and IMP bind in the fast exchange regime in their respective NADP+ complexes, these results suggest that the 31P of GMP is not proximal to the protons that contribute to dipolar relaxation of IMP in the ternary complex.
The Substrate Monophosphates Have Similar Dynamics in the Binary Complexes
To explain the loss of the dipolar relaxation, we compared the relaxation rates of 31P nuclei in the binary E·IMP and E·GMP complexes (Fig. 7). In the absence of cofactor, IMP and GMP have similar values of τ: 43 ± 6 ns for IMP and 43 ± 4 ns for GMP. Values of R0 are also similar for both E·IMP and E·GMP complexes (2.3 and 2.1 s−1, respectively), as are the values of τ/R0 (1.9 and 2.0 × 10⁻⁸ s2, respectively). Note that the observation of an increase in R0 at low field indicates that IMP and GMP bind to the protein in the fast exchange regime. These observations suggest that the substrate 31P nuclei are in the same environment in both E·IMP and E·GMP binary complexes.
FIGURE 7.
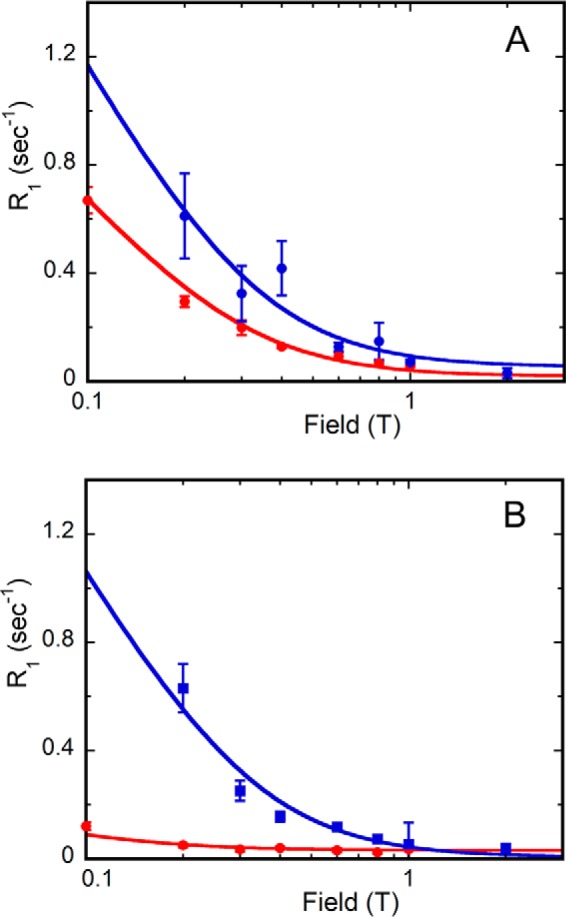
Magnetic field dependence of substrate phosphate 31P R1 in the presence and absence of NADP+. Substrate is binding to GMPR alone (blue) or with NADP+ added (red). A, E·IMP; B, E·GMP. Error bars, S.E.
Although the relaxation of the 31P of IMP is similar in both the binary and ternary complexes (Fig. 7A), the value of R0 for GMP was significantly smaller when NADP+ was present (2.1 s−1 for E·GMP and 0.30 ± 0.02 s−1 for E·GMP·NADP+; Fig. 7B). These differences must derive from different proximities of the substrate monophosphates to relaxer protons (either intramolecular or intermolecular) in the presence of cofactor. Thus, the field cycling experiments indicate that the deamination reaction involves a conformation of GMP and/or a phosphate binding site distinct from those observed in the x-ray crystal structures.
Cofactor in E·GMP·NADP+ Has More than One Bound Conformation
The x-ray crystal structures suggested that the relaxation of the cofactor diphosphates would be different in the IMP and GMP complexes. Although relaxation of the diphosphates is expected to have a homonuclear 31P-O–31P dipolar contribution, we reasoned that this contribution would be the same in all complexes because only two bonds separate the 31P nuclei. The value of τ for the adenosine monophosphate 31P nucleus was comparable with those of the diphosphates within a given complex, suggesting that the correlation time reflected behavior of the whole cofactor molecule. However, the values of τeff for the cofactor 31P nuclei were longer for E·IMP·NADP+ than for E·GMP·NADP+ (82–103 versus 44–47 ns, respectively; Table 1).
The values of R0 change in proportion to the τ values, so that the values of τ/R0 for the three 31P nuclei are similar for the cofactor in both complexes (3.8–6.6 × 10⁻⁸ and 8.6–9.3 × 10⁻⁸ s2 for the IMP and GMP complexes, respectively; Table 1), with no significant change in the extrapolated 31P–1H distances:E·IMP·NADP+, 2.8 ± 0.2 Å for monophosphate and 3.0 ± 0.1 Å for diphosphates; E·GMP·NADP+, 3.1 ± 0.1 Å for monophosphate and 3.2 ± 0.1 Å for diphosphates. These observations suggest that the cofactor 31P occupies the same site in both complexes but that a dynamic process associated with cofactor binding is different.
Several processes contribute to the value of τ, including overall rotation of the complex and conformational exchange of the protein and/or small molecule. Rotational relaxation will be dominated by the tumbling of the protein, which should be the same for all bound ligands unless the oligomerization state of the protein is different in the two complexes. Therefore, we measured the diffusional properties of the complexes with dynamic light scattering using exactly the same concentration of enzymes and ligands as for field cycling experiments. The diffusion coefficients (μm2/s) and hydrodynamic radii (nm) of E·IMP·NADP+ and E·GMP·NADP+ are the same within error: 53.2 ± 0.1 μm2/s and 4.6 ± 0.1 nm for E·IMP·NADP+ and 52.1 ± 1.5 μm2/s and 4.7 ± 0.1 nm for E·GMP·NADP+. These results indicate that the two complexes have the same oligomeric state. The measured hydrodynamic radii are similar to the radius of gyration calculated from the crystal structure of the GMPR tetramer in complex with IMP and NADPH (Rg = 4.2 nm, calculated with HydroPro (18) using PDB code 2C6Q (3)). Hence, the different values of τ must derive from changes in cofactor conformational dynamics within the complexes.
The value of τ estimated from the molecular weight using Stokes law for spherical proteins is ∼70 ns (5), which is similar to that observed for the cofactor in the E·IMP·NADP+ complex (Table 1). Thus, we propose that the cofactor possesses a more rigid conformation in E·IMP·NADP+ such that τ is dominated by protein tumbling (τ = 80–100 ns). There are several possible explanations for the smaller values of τ for cofactor in E·GMP·NADP+: 1) the protein environment of NADP+ has enhanced flexibility but not altered relaxer proton distance (because τ/R0 is similar for both ternary complexes); 2) there are two populations of the E·GMP·NADP+ complex, one with τ and R0 comparable with the IMP ternary complex and the other with a shorter τ such that both field dependence profiles overlap; and 3) the NADP+ in the E·GMP·NADP+ complex has significant internal motion.
Fig. 8A shows how these three models affect the analysis of the field dependence for one E·GMP·NADP+ experiment. In the case of the first model, the NADP+ 31P nuclei in the complex are characterized by a single τ = 37 ± 6 ns and R0 = 0.43 ± 0.02 s −1, shown by the thin black line.
FIGURE 8.
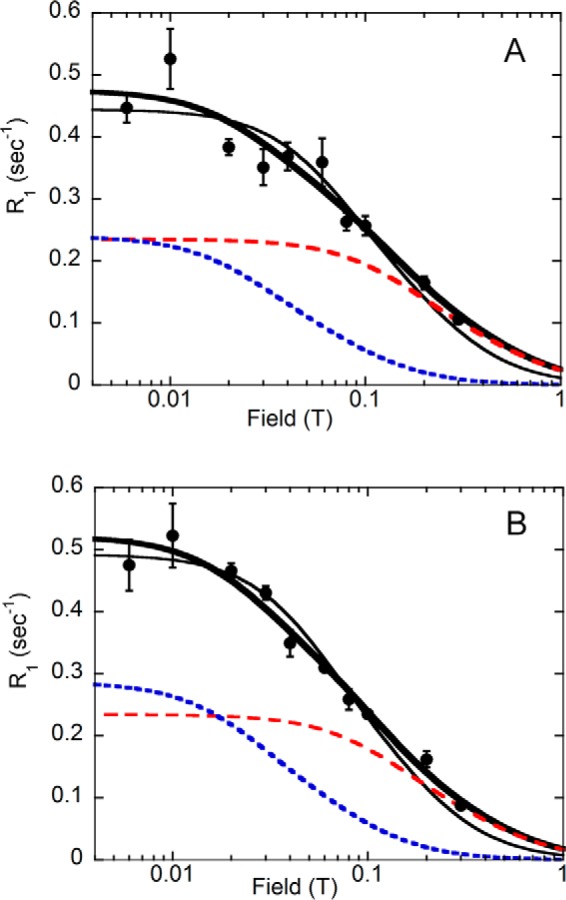
Magnetic field dependence of R1 for NADP+31P in the E·GMP·NADP+ complex. NADP+ diphosphates are shown in A, and the NADP+ monophosphate is shown in B. The thin line represents a fit to Equation 6 with a single correlation time (37 and 45 ns for the diphosphate and monophosphate, respectively) and R0 of 0.5 and 0.6 s−1 for the di- and monophosphates, respectively. The thick line represents the best fit with Equation 1 and Equation 2, which describe two distinct dipolar contributions to the observed cofactor 31P R1: 1) a lower field component (blue dashed line) characterized by a long correlation time and R0 consistent with overall rotation of the protein complex with values taken from the E·IMP·NADP+ complex (Table 1) and 2) a second contribution (red dashed line) with a shorter correlation time (16 ns) and reduced R0 values (0.28 and 0.26 s−1 for the di- and monophosphates) that dominates the relaxation around 0.1 T. The parameter F, the fractional contribution of the slower τ, was found to be 0.16 and 0.10 for the diphosphate and monophosphate, respectively. Error bars, S.E.
For the other two explanations, the observed R1 at each magnetic field will be a combination of two different τ, R0 contributions (Equations 1 and 2).
 |
For case 2 (i.e. two distinct populations of protein), F is the fraction of protein where the NADP+ motion has a correlation time consistent with overall rotation of the protein complex (90 ns) and R0 comparable with the E·IMP·NADP+ complex (1.5 s−1). Parameters for the fraction of protein (1 − F) with a shorter correlation time can be extracted by fitting the observed data to the sum of two Equations 2, with one representing protein tumbling and the other a faster motion. For these analyses, only fields less than 0.4 T were used to avoid any complication from CSA relaxation. One obtains F = 0.16, so that only 16% of the total complex has values of τ and R0 comparable with the cofactor in the E·IMP·NADP+ complex, whereas the other 84% of the ternary complex is characterized by τ = 16 ± 9 ns and R0 = 0.28 ± 0.07 s−1. The two dashed lines (Fig. 8) show the contribution of each of these species to the observed R1.
Equation 1 also describes explanation 3, where relaxation is due to the internal motions of the bound cofactor as well as the overall rotation of the enzyme complex (19). The extracted numbers are the same, but here F is usually represented by S2, an order parameter squared. Here, the S2 is defined as the fraction of R1 contributed by overall rotational motion of the complex, and then (1 − S2) indicates the portion of R1 due to the internal motion of the bound diphosphates. Because (1 − S2) is close to 1, this means that the NADP+ diphosphates have considerable internal motion in the GMP ternary complex, characterized by τ = 16 ± 9 ns. This motion provides the major pathway for relaxing the 31P at fields between 0.01 and 1 T (red line in Fig. 8A).
The same analysis (Equation 1) for cofactor monophosphate parallels the diphosphate results (Fig. 8B). For case 1, the monophosphate in the complex yields a single τ = 45 ± 4 ns and R0 = 0.49 ± 0.02 s−1. For case 2, we used 100 ns and 2.9 s−1 for τ and R0, respectively, because these values characterized substrate in the E·IMP·NADP+ complex. Only 10% of the total complex has values of τ and R0 comparable with the cofactor in the E·IMP·NADP+ complex, whereas the other 90% of the ternary complex is characterized by τ = 19 ± 7 ns and R0 = 0.26 ± 0.05 s−1. For explanation 3, the internal motion of the cofactor monophosphate provides a major pathway for relaxing the 31P, especially at fields around 0.1 T. We suggest that this internal motion is the major relaxation pathway for the NADP+ in the GMP ternary complex.
Relative Dynamics of Substrate and Cofactor Change during the GMPR Catalytic Cycle
If overall protein tumbling dominates dipolar relaxation of the bound small molecules, the values of τ are expected to be similar for all of the phosphates within a given complex. However, this is not the case. The value of τ for the 31P nucleus of GMP is longer than those for the cofactor 31Ps within the E·GMP·NADP+ (72 ± 13 versus 44–47 ns; Table 1 and Fig. 9, A and B). In contrast, the value of τ for the 31P of IMP is shorter than those for the cofactor 31P nuclei within the E·IMP·NADP+ complex (55 versus 82–103 ns). These observations suggest that the relative dynamics of the substrate and cofactor change during the catalytic cycle. The cofactor is more dynamic (i.e. has faster local motions) than GMP during deamination, whereas the phosphate of IMP is less constrained than the cofactor in the complex, leading to hydride transfer (Fig. 10).
FIGURE 9.
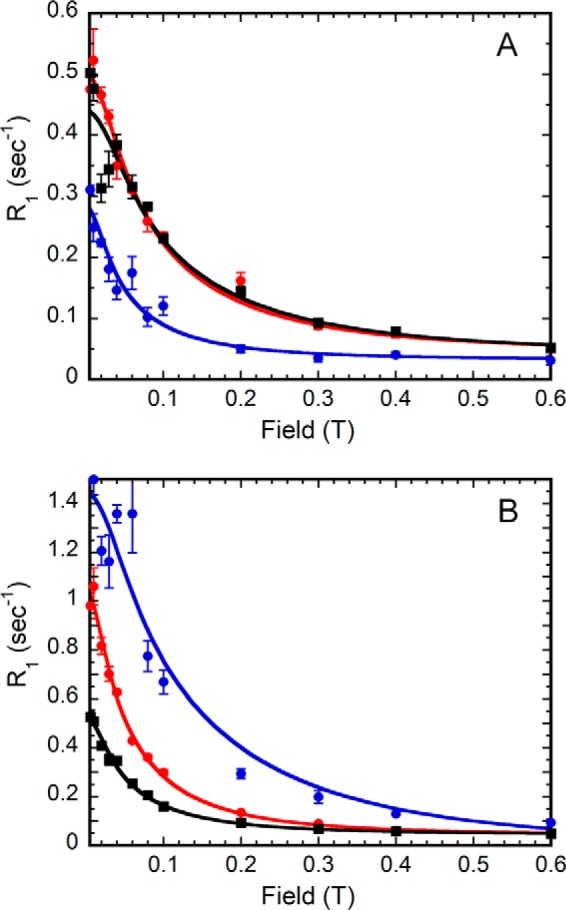
Comparison of field dependence profiles of 31P in substrate and cofactor in each E·NADP+ ternary complex. For the E·GMP·NADP+ (A) and E·IMP·NADP+ (B) profiles, substrate monophosphate is blue, NADP+ monophosphate is red, and NADP+ diphosphates are black. Error bars, S.E.
FIGURE 10.
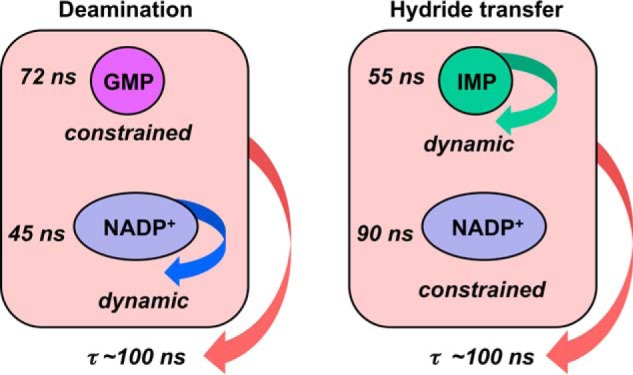
Dynamic properties of ternary complexes. Field cycling experiments suggest that the substrate monophosphate is more dynamic than the cofactor in the E·GMP·NADP+ complex but less dynamic in the E·IMP·NADP+ complex.
Discussion
Catalysis is an inherently dynamic process, dependent on the motions of both substrate and enzyme. Although x-ray crystallography allows important insights into the mechanisms of enzyme catalysis, these structures are only static views of usually inert complexes and can therefore be misleading. Molecular mechanics/molecular dynamics simulations can provide information about reaction dynamics, but the size of the enzyme often requires the dynamic regions to be constrained to a portion of the protein in the immediate vicinity of the chemical transformation, so that the contribution of more distal regions is not considered. Our work shows that high resolution field cycling provides a means to monitor the dynamics of catalytically competent complexes, providing new and unanticipated insights into catalysis.
In the case of GMPR, all of the available crystal structures suggested that the monophosphates of IMP and GMP have identical interactions (Fig. 2C). Moreover, these interactions are found in many other (β/α)8 enzymes (Fig. 2D). These observations suggest that the monophosphates serve as anchors that tether the reactive portion of the substrate to the active site, a role consistent with a uniform binding interaction as proposed by Burbaum et al. (20) or the Jencks Circe effect (21). Our field cycling experiments reveal that, in the catalytically active E·GMP·NADP+ complex, the monophosphate of GMP is farther from relaxer protons than is that of IMP in its catalytically active NADP+ complex. This could occur by the ternary complex stabilizing the GMP conformation so that the 31P-O–C–1H is maximally extended (reducing intramolecular dipolar relaxation), by reducing the effect of nearby protein relaxer protons (intermolecular dipolar relaxation), or by a combination of both. Our observation indicates that the interactions of the substrate monophosphate change during the catalytic cycle. Thus, the substrate monophosphate is intimately coupled with the chemical transformations. The importance of the phosphate moiety was not suspected before the field cycling experiments and probably would not have been considered in molecular mechanics/molecular dynamics simulations of the reaction.
This work demonstrates the utility of field cycling NMR to study the dynamics of phosphorus-containing substrates inside an enzyme active site and clearly shows the importance of substrate dynamics in the catalytic cycle. We propose that the different relaxation behavior of the E·GMP·NADP+ and E·IMP·NADP+ complexes reflects the dynamic properties of different steps in the catalytic cycle of GMPR. In the deamination step, the bound monophosphate of GMP is less effectively relaxed than IMP. This could occur intramolecularly by stabilization of an extended GMP conformation that does not occur with bound IMP. However, the lower R0 for bound GMP may also result from a change in proton density around the monophosphate contributed by the protein. The increased R0 for GMP in the binary complex, with a correlation time similar to what is observed in the ternary complex, is consistent with significant protein contribution to 31P dipolar relaxation. The τ for the GMP in E·GMP·NADP+ is also longer than that for the cofactor. The internal motion of the cofactor is likely to be coordinated with the OUT conformation of the cofactor.
In contrast, in the hydride transfer step, the monophosphate of substrate IMP is more effectively relaxed by protons than GMP, and cofactor is more rigid because the τ for the three 31P nuclei are all longer and comparable with overall tumbling of the complex. Whether changes in the effectiveness of substrate dipolar relaxation occur intra- or intermolecularly, the net result is that the two substrates are bound differently in the ternary complex, and this is correlated with the conformational behavior of the cofactor.
Last, completion of the catalytic cycle requires the transition between these two dynamic states. As shown in Fig. 1B, the deamination reaction occurs in the OUT conformation, producing E-XMP* and ammonia. The ammonia must move to allow the nicotinamide to access the IN conformation required for hydride transfer. The ammonia is missing from E·IMP·NADP+ complex, perhaps accounting for the less dynamic conformational state of the cofactor in this complex. We suggest that the movement of NH3 gates the transition between the two dynamic states, and future work will investigate this hypothesis.
Experimental Procedures
Materials
NADP+ was obtained from Roche Diagnostics. IMP was purchased from MP Biomedicals. GMP was purchased from Sigma. D2O (99.9%), deuterated Tris-d11 (98%), was obtained from Cambridge Isotopes.
Overexpression and Purification of Escherichia coli GMPR
Expression and purification of recombinant E. coli GMPR was carried out as described previously (3) with modifications to increase production of purified enzyme. The crude cell lysate from a 6-liter culture was loaded onto nickel-nitrilotriacetic acid-agarose resin (Molecular Cloning Laboratories Inc.) and incubated overnight. The resin was washed with 5, 30, and 60 mm imidazole buffer 1 (100 mm potassium phosphate, pH 7.8, 500 mm KCl, 1 mm β-mercaptoethanol, 10% glycerol). GMPR was eluted at 250 mm imidazole buffer 1. The fractions with high GMPR activity were collected and dialyzed against buffer 2 (75 mm Tris-HCl, pH 7.8, 100 mm KCl, 1 mm DTT, 0.5 mm EDTA, 5% glycerol). The protein purity was verified by SDS-gel electrophoresis. The protein concentration was determined by A280 using the extinction coefficient calculated with ProtParam (22). Protein was concentrated using Amicon Ultra centrifugal 10K filters for NMR samples.
Kd Measurements
One-dimensional NMR spectra were recorded on a Bruker Avance spectrometer operating at 800.13 MHz (1H) and equipped with TXI cryoprobe and pulsed field gradients. All experiments were performed at 25 °C. NMR data were processed and analyzed using TOPSPIN (Bruker Biospin Inc.). For the analysis of the line shape of the 1H resonance of substrates in the presence of GMPR, a linearization method for chemical exchange of ligand was used (23). When the ligand is present in excess to the protein concentration, [L] = [L]0, [L]0 ≫ [P]0, the ligand line width can be expressed in the following relationship,
where [P]0 represents protein concentration, [L]0 is total ligand concentration, and Δobs and Δmax are the observed and maximum change in ligand line width, respectively. Kd is obtained from the slope and the y intercept of a plot of 1/Δobs versus [L]0.
STD-NMR Experiments
All STD experiments were acquired on the 800-MHz spectrometer using 40 μm GMPR and 2 mm substrates in 75 mm deuterated Tris-HCl, pH 7.8, 100 mm KCl, 0.5 mm DTT. All experiments were performed at 20 °C with 1600 scans and selective saturation of protein resonances at −0.7 ppm using a train of 50-ms Gaussian-shaped radio frequency pulses at −0.7 and −30 ppm for the on-resonance and off-resonance spectra, respectively (1-ms delay between pulses) for total saturation times ranging from 0.6 to 7 s. The off-resonance frequency was set at a value that is far from any ligand or protein signal. This signal was used as a reference signal intensity, Ioff. The on-resonance frequency was for selective irradiation of aliphatic protein signals, and its intensity was set as Ion. NMR data were processed and analyzed using TOPSPIN (Bruker Biospin Inc.). The measured intensities Ioff and Ion were used to calculate the fractional STD signal using the following equations,
and
where [L]T and [E]T are the total ligand and protein concentrations, respectively. The epitope mapping was obtained by calculating the slope of the STDAF build-up curve at a saturation time of 0 s (24). Saturation data were fitted to an exponential equation, STDAF = STDAF(max)(1 − exp(−ksatt)), where STD is the STD signal intensity of a given proton at saturation time t, STDAF(max) is the maximal STD intensity at long saturation times, and ksat represents the observed saturation rate constant. Multiplication of STDAF(max) and ksat yields the slope of the curve at t = 0 s.
Dynamic Light Scattering
The dynamic light scattering (DLS) experiments were performed using an ALV goniometer. Absolute Rayleigh ratios of aqueous solutions were determined by using pure toluene as a standard (25). The radii rH of GMPR complexes were obtained from DLS measurements in 75 mm Tris-HCl, pH 7.8, 100 mm KCl, 1 mm DTT, 0.5 mm EDTA using 0.4 mm GMPR and 1.6 mm G(I)MP and NADP+ (26). All samples were filtered through 0.2-μm GSWP filters before being analyzed.
High Resolution 31P Field Cycling NMR Measurements
Each sample was prepared by mixing enzyme with ligands stock solutions, either IMP/NADP+ or GMP/NADP+, to obtain 400 μm GMPR and 1.6 mm ligands in the 75 mm Tris-HCl, pH 7.8, with 100 mm KCl, 1 mm DTT, and 0.5 mm EDTA. Buffer contained 24% D2O. The 31P field cycling spin-lattice relaxation rate (R1) measurements were taken at 25 °C on a Varian INOVA 500 spectrometer using a standard 10-mm Varian probe in a device that was built to move the sample from the conventional sample probe location (at 11.7 T) to a higher position within or above the magnet, where the magnetic field can be as low as 0.04 T (5). To program lower fields, down to 0.006 T, a permanent magnet was mounted at the top of the superconducting magnet dewar. Relaxation experiments at a given field strength were typically 3–6 h long (depending on field strength), each with 6–7 programmed delay times. Data were analyzed with an exponential function to extract the spin-lattice relaxation rate R1 = 1/T1.
31P Field Cycling NMR Data Analysis
Spectra were plotted, and intensities were measured by Vnmr 6.1c software. Dependence of R1 on magnetic field allows the extraction of the effective correlation time (τ) for the ligand bound to GMPR and the dipolar relaxation rate extrapolated for zero field (R0), as described by Equation 6,
 |
where CSA = CLωP2J(ωP) + CHωP2H2. Here J(τ,ω) is the spectral density function and equal to 2τ/(1 + ωP2τ2); CL and CH are low frequency and high frequency contributions of the CSA interaction to relaxation; and ωH and ωP are the proton and 31P gyromagnetic ratios multiplied by magnetic field, H (in teslas). The contribution CLωP2J(ωP) was introduced to account for relaxation occurring in the region from 0.5 to 4 T that could otherwise not be accounted for by dipolar and the CSA detected at high fields (3). As such it is an empirical “correction.” In this work, we ignore CSA except to improve fits of the data. The averaged distance from the nearest protons to the 31P is proportional to the sixth root of τ/R0,
where h is Planck's constant, μ0 is the permeability of free space, and γP and γH are the gyromagnetic ratios for 31P and 1H. We define reff as the on-enzyme distance between the 31P and nearby protons that are responsible for the dipolar relaxation. It is not normalized to a specific number of protons because that is not known.
Author Contributions
M. M. R., A. R., and M. F. R. designed the experiments. M. M. R. conducted the experiments. M. M. R. and M. F. R. analyzed the data. L. H. conceived the idea for the project. M. M. R., M. F. R., and L. H. wrote the paper.
Acknowledgments
We thank Jerome Fung and Seth Fraden for help with the DLS experiments. Molecular graphics images were produced using the UCSF Chimera package from the Computer Graphics Laboratory, University of California, San Francisco (supported by National Institutes of Health Grant P41 RR-01081).
This work was supported by National Institutes of Health Grant GM054403 (to L. H.). The authors declare that they have no conflicts of interest with the contents of this article. The content is solely the responsibility of the authors and does not necessarily represent the official views of the National Institutes of Health.
- GMPR
- guanosine monophosphate reductase
- DLS
- dynamic light scattering
- STD
- saturation transfer difference
- CSA
- chemical shift anisotropy
- T
- tesla
- PDB
- Protein Data Bank.
References
- 1. Wilmanns M., Hyde C. C., Davies D. R., Kirschner K., and Jansonius J. N. (1991) Structural conservation in parallel β/α-barrel enzymes that catalyze three sequential reactions in the pathway of tryptophan biosynthesis. Biochemistry 30, 9161–9169 [DOI] [PubMed] [Google Scholar]
- 2. Nagano N., Orengo C. A., and Thornton J. M. (2002) One fold with many functions: the evolutionary relationships between TIM barrel families based on their sequences, structures and functions. J. Mol. Biol. 321, 741–765 [DOI] [PubMed] [Google Scholar]
- 3. Patton G. C., Stenmark P., Gollapalli D. R., Sevastik R., Kursula P., Flodin S., Schuler H., Swales C. T., Eklund H., Himo F., Nordlund P., and Hedstrom L. (2011) Cofactor mobility determines reaction outcome in the IMPDH and GMPR (β-α)8 barrel enzymes. Nat. Chem. Biol. 7, 950–958 [DOI] [PMC free article] [PubMed] [Google Scholar]
- 4. Li J., Wei Z., Zheng M., Gu X., Deng Y., Qiu R., Chen F., Ji C., Gong W., Xie Y., and Mao Y. (2006) Crystal structure of human guanosine monophosphate reductase 2 (GMPR2) in complex with GMP. J. Mol. Biol. 355, 980–988 [DOI] [PubMed] [Google Scholar]
- 5. Redfield A. G. (2012) High-resolution NMR field-cycling device for full-range relaxation and structural studies of biopolymers on a shared commercial instrument. J. Biomol. NMR 52, 159–177 [DOI] [PubMed] [Google Scholar]
- 6. Roberts M. F., and Redfield A. G. (2004) High-resolution 31P field cycling NMR as a probe of phospholipid dynamics. J. Am. Chem. Soc. 126, 13765–13777 [DOI] [PubMed] [Google Scholar]
- 7. Charlier C., Khan S. N., Marquardsen T., Pelupessy P., Reiss V., Sakellariou D., Bodenhausen G., Engelke F., and Ferrage F. (2013) Nanosecond time scale motions in proteins revealed by high-resolution NMR relaxometry. J. Am. Chem. Soc. 135, 18665–18672 [DOI] [PMC free article] [PubMed] [Google Scholar]
- 8. Pravdivtsev A. N., Yurkovskaya A. V., Vieth H.-M., and Ivanov K. L. (2014) High resolution NMR study of T1 magnetic relaxation dispersion. IV. Proton relaxation in amino acids and Met-enkephalin pentapeptide. J. Chem. Phys. 141, 155101. [DOI] [PubMed] [Google Scholar]
- 9. Clarkson M. W., Lei M., Eisenmesser E. Z., Labeikovsky W., Redfield A., and Kern D. (2009) Mesodynamics in the SARS nucleocapsid measured by NMR field cycling. J. Biomol. NMR 45, 217–225 [DOI] [PMC free article] [PubMed] [Google Scholar]
- 10. Steele R. M., Korb J.-P., Ferrante G., and Bubici S. (2016) New applications and perspectives of fast field cycling NMR relaxometry. Magn. Reson. Chem. 54, 502–509 [DOI] [PubMed] [Google Scholar]
- 11. Grebenkov D. S., Goddard Y. A., Diakova G., Korb J.-P., and Bryant R. G. (2009) Dimensionality of diffusive exploration at the protein interface in solution. J. Phys. Chem. B 113, 13347–13356 [DOI] [PMC free article] [PubMed] [Google Scholar]
- 12. Hsieh C.-J., Chen Y.-W., and Hwang D. W. (2013) Effects of cholesterol on membrane molecular dynamics studied by fast field cycling NMR relaxometry. Phys. Chem. Chem. Phys. 15, 16634–16640 [DOI] [PubMed] [Google Scholar]
- 13. Pu M., Feng J., Redfield A. G., and Roberts M. F. (2009) Enzymology with a spin-labeled phospholipase C: soluble substrate binding by 31P NMR from 0.005 to 11.7 T. Biochemistry 48, 8282–8284 [DOI] [PMC free article] [PubMed] [Google Scholar]
- 14. Pu M., Orr A., Redfield A. G., and Roberts M. F. (2010) Defining specific lipid binding sites for a peripheral membrane protein in situ using subtesla field-cycling NMR. J. Biol. Chem. 285, 26916–26922 [DOI] [PMC free article] [PubMed] [Google Scholar]
- 15. Gradziel C. S., Wang Y., Stec B., Redfield A. G., and Roberts M. F. (2014) Cytotoxic amphiphiles and phosphoinositides bind to two discrete sites on the Akt1 PH domain. Biochemistry 53, 462–472 [DOI] [PubMed] [Google Scholar]
- 16. Wei Y., Stec B., Redfield A. G., Weerapana E., and Roberts M. F. (2015) Phospholipid-binding sites of phosphatase and tensin homolog (PTEN): exploring the mechanism of phosphatidylinositol 4,5-bisphosphate activation. J. Biol. Chem. 290, 1592–1606 [DOI] [PMC free article] [PubMed] [Google Scholar]
- 17. Mayer M., and Meyer B. (2001) Group epitope mapping by saturation transfer difference NMR to identify segments of a ligand in direct contact with a protein receptor. J. Am. Chem. Soc. 123, 6108–6117 [DOI] [PubMed] [Google Scholar]
- 18. Ortega A., Amorós D., and García de la Torre J. (2011) Prediction of hydrodynamic and other solution properties of rigid proteins from atomic- and residue-level models. Biophys. J. 101, 892–898 [DOI] [PMC free article] [PubMed] [Google Scholar]
- 19. Lipari G., and Szabo A. (1982) Model-free approach to the interpretation of nuclear magnetic-resonance relaxation in macromolecules. 2. Analysis of experimental results. J. Am. Chem. Soc. 104, 4559–4570 [Google Scholar]
- 20. Burbaum J. J., Raines R. T., Albery W. J., and Knowles J. R. (1989) Evolutionary optimization of the catalytic effectiveness of an enzyme. Biochemistry 28, 9293–9305 [DOI] [PubMed] [Google Scholar]
- 21. Jencks W. P. (1975) Binding energy, specificity, and enzymic catalysis: the Circe effect. Adv. Enzymol. Relat. Areas Mol. Biol. 43, 219–410 [DOI] [PubMed] [Google Scholar]
- 22. Gasteiger E., Hoogland C., Gattiker A., Duvaud S., Wilkins M. R., Appel R. D., and Bairoch A. (2005) Protein identification and analysis tools on the ExPASy server. in The Proteomics Protocols Handbook (Walker J. M., ed) pp. 571–607, Humana Press, New York [Google Scholar]
- 23. Fielding L. (2007) NMR methods for the determination of protein-ligand dissociation constants. Prog. NMR Spectrosc. 51, 219–242 [DOI] [PubMed] [Google Scholar]
- 24. Mayer M., and James T. L. (2004) NMR-based characterization of phenothiazines as a RNA binding scaffold. J. Am. Chem. Soc. 126, 4453–4460 [DOI] [PubMed] [Google Scholar]
- 25. Kaye W., and Havlik A. J. (1973) Low-angle laser light-scattering: absolute calibration. Appl. Optics 12, 541–550 [DOI] [PubMed] [Google Scholar]
- 26. Bloustine J., Virmani T., Thurston G. M., and Fraden S. (2006) Light scattering and phase behavior of lysozyme-poly(ethylene glycol) mixtures. Phys. Rev. Lett. 96, 087803 [DOI] [PubMed] [Google Scholar]
- 27. Pettersen E. F., Goddard T. D., Huang C. C., Couch G. S., Greenblatt D. M., Meng E. C., and Ferrin T. E. (2004) UCSF Chimera: a visualization system for exploratory research and analysis. J. Comp. Chem. 25, 1605–1612 [DOI] [PubMed] [Google Scholar]


