

Abstract
The calcium-sensing receptor (CaSR) is activated by various cations, cationic compounds, and amino acids. In the present study we investigated the effect of glucose on CaSR in HEK293 cells stably expressing human CaSR (HEK-CaSR cells). When glucose concentration in the buffer was raised from 3 to 25 mm, a rapid elevation of cytoplasmic Ca2+ concentration ([Ca2+]c) was observed. This elevation was immediate and transient and was followed by a sustained decrease in [Ca2+]c. The effect of glucose was detected at a concentration of 4 mm and reached its maximum at 5 mm. 3-O-Methylglucose, a non-metabolizable analogue of glucose, reproduced the effect of glucose. Sucrose also induced an elevation of [Ca2+]c in HEK-CaSR cells. Similarly, sucralose was nearly as effective as glucose in inducing elevation of [Ca2+]c. Glucose was not able to increase [Ca2+]c in the absence of extracellular Ca2+. The effect of glucose on [Ca2+]c was inhibited by NPS-2143, an allosteric inhibitor of CaSR. In addition, NPS-2143 also inhibited the [Ca2+]c responses to sucralose and sucrose. Glucose as well as sucralose decreased cytoplasmic cAMP concentration in HEK-CaSR cells. The reduction of cAMP induced by glucose was blocked by pertussis toxin. Likewise, sucralose reduced [cAMP]c. Finally, glucose increased [Ca2+]c in PT-r parathyroid cells and in Madin-Darby canine kidney cells, both of which express endogenous CaSR. These results indicate that glucose acts as a positive allosteric modulator of CaSR.
Keywords: beta cell (B-cell), calcium, cyclic AMP (cAMP), G protein-coupled receptor (GPCR), glucose, calcium-sensing receptor, sweet taste receptor
Introduction
The calcium-sensing receptor (CaSR)2 was originally identified in parathyroid cells as a receptor that regulates secretion of parathyroid hormone by sensing changes in the concentration of extracellular calcium (1). Elevation of extracellular Ca2+ is detected by this receptor, and phospholipase C is activated leading to elevation of cytoplasmic Ca2+ concentration ([Ca2+]c) (1). The molecular structure of CaSR was revealed by the expression cloning of CaSR from the bovine parathyroid gland (2). CaSR is a glycosylated protein with a molecular mass of ∼120 KDa and belongs to the family C of G protein-coupled receptors (GPCRs). It has a large extracellular domain, namely the Venus flytrap domain (VFTD), and like other members of the family C GPCR, CaSR forms a dimer to exert its function. In addition to parathyroid glands, CaSR is expressed in tissues involved in the regulation of Ca2+ homeostasis including kidney, intestine, and bone. This receptor is also expressed in various other tissues and organs including neurons and glial cells (3) and may modulate the function of these cells (3–5). Although CaSR was identified as a receptor sensing extracellular Ca2+, many studies revealed that CaSR is in fact activated by a variety of ligands. Those include various cations such as Mg2+, Mn2+, Sr2+, Ni2+, and Gd3+, amino acids, polypeptides, aminoglycosides, and polyamines (4, 5). Among them, a principal agonist for CaSR is Ca2+, which binds to a pocket in the VFTD (6). Binding Ca2+ to the binding pocket in the VFTD may cause a conformational change in the receptor molecule, which eventually activates trimeric G proteins, leading to activation of the effector molecules. Amino acids bind to an adjacent site in the VFTD and act as allosteric activators of CaSR (4).
An interesting feature of CaSR is that various synthetic allosteric modulators bind to domains other than VFTD, especially the transmembrane domain, and modulate the function of CaSR in positive and negative manners. For example, calcimimetics bind to the transmembrane domain and stabilize the receptor in the active form (5). Conversely, NPS-2143, an allosteric inhibitor of CaSR, binds to the transmembrane domain of CaSR and may stabilize the inactive conformation of CaSR (7). In addition to the above-mentioned agonists, CaSR is also activated by the bitter compound named denatonium (8).
We have been studying the cell-surface receptor activated by glucose in pancreatic β-cells and enteroendocrine cells (9–11). During the course of study, we found that physiological concentrations of glucose activate CaSR expressed in HEK293 cells. In the present study we characterized the effect of glucose and other compounds presenting sweet taste on CaSR in HEK293 cells stably expressing human CaSR (HEK-CaSR cells). The results indicate that glucose acts as an allosteric modulator of CaSR.
Results
Effect of Ca2+ on [Ca2+]c in HEK-CaSR Cells
We established HEK293 cells stably expressing human CaSR (hCaSR). As shown in Fig. 1A, HEK-CaSR cells expressed a considerably high amount of mRNA for hCaSR compared with that in parental HEK293 cells. Fig. 1B shows the protein expression of CaSR in HEK-CaSR cells. As can been seen, CaSR was detected in HEK-CaSR but not in HEK293 cells. Immunocytochemistry revealed that a considerable amount of CaSR was expressed on the cell surface of HEK-CaSR cells (Fig. 1C). We then monitored changes in [Ca2+]c in HEK-CaSR cells using fluo-8. In the presence of 2.5 mm extracellular calcium, oscillation of [Ca2+]c was observed in 34.0 ± 2.0% (mean ± S.E., n = 3) of the cells examined (Fig. 1D). In the presence of 1.3 mm extracellular calcium, oscillation of [Ca2+]c was observed in 16.2 ± 1.0% (n = 3) of the cells (Fig. 1E). The amplitude and frequency of the peaks of [Ca2+]c in the presence of 1.3 mm extracellular calcium were considerably lower compared with those in the presence of 2.5 mm extracellular calcium. In the absence of extracellular calcium, no oscillation of [Ca2+]c was observed (Fig. 1F). Note that oscillation of [Ca2+]c was not observed in naïve HEK293 cells in the presence of 1.3 and 2.5 mm Ca2+ (Fig. 1G). The addition of cinacalcet, an allosteric activator of CaSR (12), induced a large transient elevation of [Ca2+]c in the presence of 1.3 mm extracellular calcium in HEK-CaSR cells (Fig. 1H). In HEK293 cells, cinacalcet did not affect [Ca2+]c (Fig. 1I).
FIGURE 1.
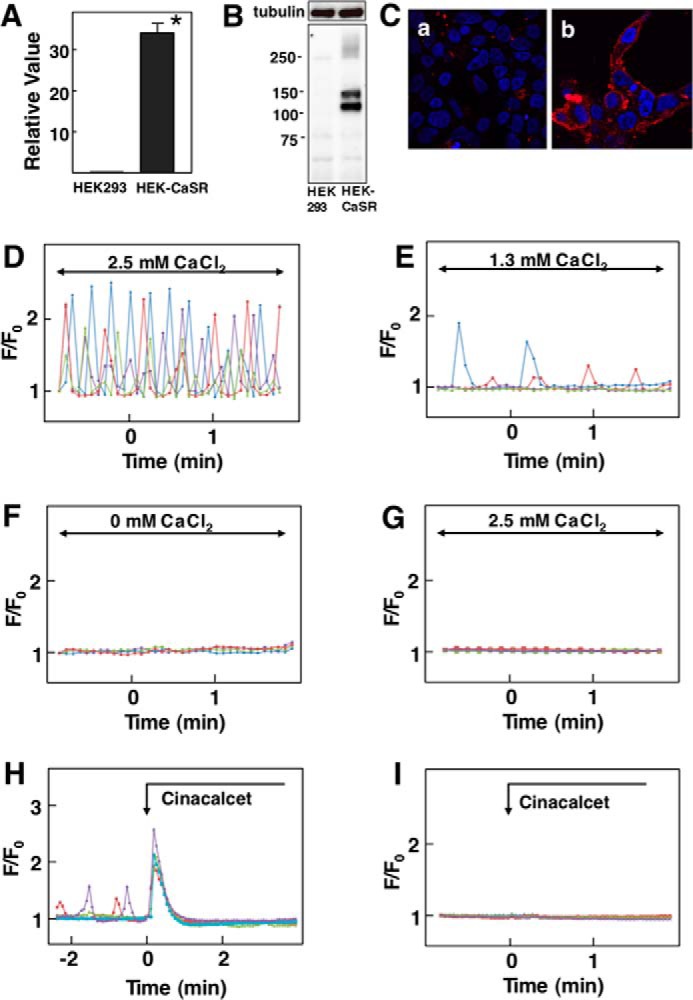
Effect of Ca2+ on [Ca2+]c in HEK-CaSR cells. A, expression of CaSR in HEK-CaSR Cells. mRNA for CaSR was measured by quantitative RT-PCR in HEK-CaSR and parental HEK293 cells and expressed as relative to that of GAPDH. Values are the mean ± S.E. for 12 measurements. *, p < 0.0001 versus HEK cells. B, protein expression of CaSR in HEK-CaSR cells. Cell lysates obtained from HEK293 and HEK-CaSR cells were separated by SDS-PAGE, and immunoblotting was done by using anti-CaSR antibody. C, immunocytochemistry of CaSR in HEK-CaSR cells. HEK293 (a) or HEK-CaSR (b) cells were stained with anti-flag antibody (red). D, changes in [Ca2+]c in HEK-CaSR cells in the presence of 2.5 mm extracellular calcium. Results are representative of three experiments. E, changes in [Ca2+]c in HEK-CaSR cells in the presence of 1.3 mm extracellular calcium. Results are representative of three experiments. F, changes in [Ca2+]c in HEK-CaSR cells in the absence of extracellular calcium. Results are representative of four experiments. G, changes in [Ca2+]c in HEK293 cells in the presence of 2.5 mm extracellular calcium. H, effect of cinacalcet on [Ca2+]c in HEK-CaSR cells. Cinacalcet (5 μm) was added as indicated. I, effect of cinacalcet on [Ca2+]c in HEK293 cells. Cinacalcet (5 μm) was added as indicated.
Effect of Glucose on [Ca2+]c in HEK-CaSR Cells
In the presence of 1.3 mm extracellular calcium, oscillation of [Ca2+]c was observed in some cells. When ambient glucose concentration was raised from 3 mm to 25 mm, an application of the high concentration of glucose induced an immediate transient elevation of [Ca2+]c in 64.1 ± 9.9% (n = 8) of the cells examined (Fig. 2A). The peak of [Ca2+]c was followed by a sustained decrease in [Ca2+]c. The biphasic response of [Ca2+]c was not due to changes in osmolarity as 25 mm N-methylglucamine and mannitol did not affect [Ca2+]c (data not shown). It is of note that glucose did not affect [Ca2+]c in parental HEK293 cells (Fig. 2B). A lower concentration of glucose, for example 8 mm, induced a similar pattern of changes in [Ca2+]c in HEK-CaSR cells, and the magnitude of the peak of [Ca2+]c and the area under the curve (AUC) of the peak were nearly identical compared with those obtained in cells stimulated by 25 mm glucose (Fig. 2C). Fig. 2D depicts the dose-response relationship for glucose-induced elevation of [Ca2+]c. At high concentrations of glucose, [Ca2+]c response was observed in 60–70% of the cells. As depicted, 5.0 mm glucose induced [Ca2+]c response in almost all of the cells. It should be noted that to observe the effect of glucose on [Ca2+]c, ambient glucose should be kept at a low concentration, for example 3 mm. The effect of glucose on [Ca2+]c was not observed when the ambient glucose was kept at 5.5 mm. This is probably because 5.5 mm glucose induces nearly maximal allosteric stimulation. Glucose-induced changes in [Ca2+]c were inhibited by U73122, a nonspecific inhibitor of phospholipase C, and [Ca2+]c response to 25 mm glucose was observed in only 25% of the cells in the presence of 10 μm U73122 (13). An inactive analogue of U73122 was not effective. In addition, YM-254890, an inhibitor of Gq (14), completely inhibited glucose-evoked changes in [Ca2+]c (Fig. 2E). Note that in the presence of YM254890, basal oscillation of [Ca2+]c was not observed. We also examined the effect of glucose on the activation of protein kinase C (PKC). To this end, we monitored the translocation of MARCKS from the plasma membrane to cytosol. As shown in Fig. 2F, the addition of glucose induced an increase in MARCKS in the cytosol. We next determined whether or not glucose modulated the sensitivity of CaSR to Ca2+. To this end we measured the response of CaSR to Ca2+ in different ambient glucose concentrations. As shown in Fig. 2G, glucose did not affect the sensitivity of CaSR to Ca2+.
FIGURE 2.
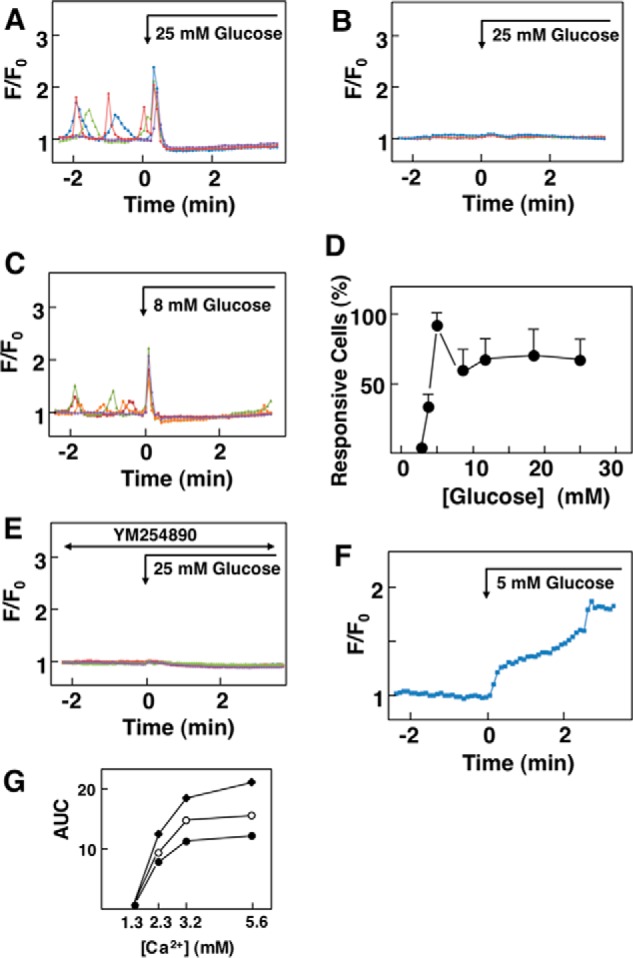
Effect of glucose on [Ca2+]c in HEK-CaSR cells. A, effect of glucose on [Ca2+]c in HEK-CaSR cells. Glucose concentration in medium was raised from 3 to 25 mm as indicated by the arrow. Results are representative of those obtained in eight experiments. B, effect of 25 mm glucose on [Ca2+]c in HEK293 cells. Glucose concentration was raised from 3 to 25 mm in naive HEK293 cells, and changes in [Ca2+]c were monitored. Results are representative of two experiments. C, effect of 8 mm glucose on [Ca2+]c in HEK-CaSR cells. Glucose concentration was raised from 3 to 8 mm glucose. Results are representative of five experiments. D, dose-response relationship for the effect of glucose. Effects of various concentrations of glucose were examined as in B and C, and the percentages of those responsive to glucose cells were counted. Values are the mean ± S.E. of five to eight experiments. E, effect of YM254890 on glucose-induced changes in [Ca2+]c. YM254890 (10 μm) was added 30 min before the addition of 25 mm glucose. Results are representative of three experiments. F, effect of glucose on the activity of PKC. HEK-CaSR cells transfected with MARCKS-GFP were stimulated by 5 mm glucose. Changes in the MARCKS-GFP fluorescence in the cytosol were monitored. Results are representative of three experiments. G, effect of glucose on the sensitivity of CaSR to Ca2+. Extracellular Ca2+ concentration was raised from 1.3 to 2.3, 3.2, or 5.6 mm in the presence of 3 (●), 5 (○), and 8 mm (♦) glucose. [Ca2+]c responses were measured, and AUC of the first peak was calculated. Values are the mean of five determinations.
Elevation of [Ca2+]c induced by glucose was dependent on extracellular calcium; glucose did not induce a peak of [Ca2+]c in the absence of extracellular calcium (Fig. 3A). The effect of glucose was independent of glucose metabolism as 3-O-methylglucose, a non-metabolizable glucose analogue, increased [Ca2+]c, as did glucose (Fig. 3B). We then examined the effect of NPS-2143, an allosteric inhibitor of CaSR that blocks [Ca2+]c responses to Ca2+ and other allosteric agonists (7). In the presence of NPS-2143, [Ca2+]c response to 25 mm glucose was observed in <10% of the cells (Fig. 3C), and [Ca2+]c response was blunted in these responsive cells (Fig. 3D). When cells were stimulated by 8 mm glucose in the presence of NPS-2143, [Ca2+]c response was blunted and was detected in <2% of the cells (Fig. 3, C and E). NPS-2143 also inhibited translocation of MARCKS induced by glucose (Fig. 3, F and G). The effect of glucose on [Ca2+]c was not inhibited by lactisole, an inhibitor of the sweet taste receptor subunit T1R3 (15) (Fig. 3H). In fact, the peak of [Ca2+]c induced by glucose was higher, and [Ca2+]c response was observed in nearly 90% of the cells. Therefore, the [Ca2+]c response to glucose was rather enhanced by lactisole.
FIGURE 3.
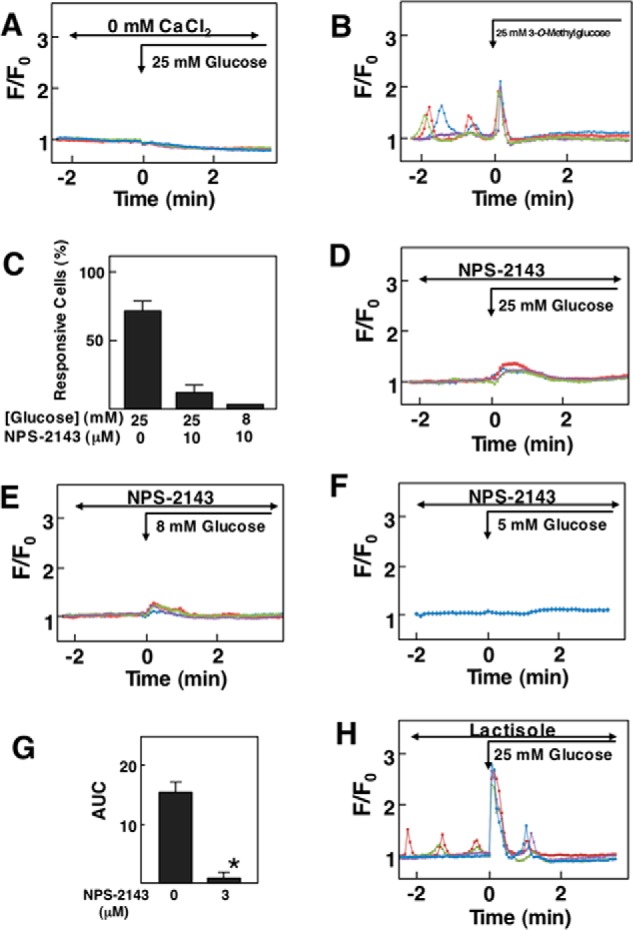
Effect of glucose and 3-O-methylglucose on [Ca2+]c in HEK-CaSR cells. A, effect of glucose on [Ca2+]c in the absence of extracellular Ca2+. Glucose concentration was raised from 3 to 25 mm in the absence of extracellular Ca2+, and changes in [Ca2+]c were monitored. Results are representative of five experiments. B, effect of 3-O-methylglucose on [Ca2+]c. 3-O-Methylglucose (25 mm) was added, and changes in [Ca2+]c were monitored. Results are representative of three experiments. C, HEK-CaSR cells were preincubated with or without 3 μm NPS-2143 and then stimulated by either 8 or 25 mm glucose. Changes in [Ca2+]c were monitored, and the numbers of responsive cells were counted. Values are the mean ± S.E. for three experiments. D and E, HEK-CaSR cells were preincubated with 3 μm NPS-2143 and then stimulated by 25 mm (D) or 8 mm (E) glucose. Changes in [Ca2+]c were monitored. Results are representative of three experiments. F, HEK-CaSR cells were stimulated by 5 mm glucose in the presence of NPS-2143 (3 μm), and translocation of MARCKS was monitored. G, HEK-CaSR cells were stimulated by 5 mm glucose in the presence and absence of NPS-2143 (3 μm), and translocation of MARCKS was monitored. The AUC from 0 to 8 min was calculated. Results are the mean ± S.E. for 12 experiments. H, effect of lactisole on glucose-induced changes in [Ca2+]c. Glucose (25 mm) was added in the presence of 1 mm lactisole, which was added 30 min before the stimulation by glucose.
We then examined the effect of Ca2+ on [Ca2+]c in the presence and absence of glucose. In the presence of 3 mm glucose, elevation of extracellular calcium from 1.3 mm to 2.2 mm resulted in a rapid elevation of [Ca2+]c (Fig. 4A). After the peak of [Ca2+]c, [Ca2+]c decreased gradually, and oscillatory elevation of [Ca2+]c was observed in some cells. In the absence of glucose, the addition of 2.2 mm calcium induced a rapid peak of [Ca2+]c, which was followed by oscillatory decay of [Ca2+]c (Fig. 4B). It is possible that removal of glucose affected the cellular functions because of the lack of fuels. To rule this out we performed the same experiments by adding glyceraldehyde instead of glucose. However, the results were essentially the same. When cells were stimulated by 1.5 μm cinacalcet in the presence of 1.3 mm extracellular calcium and 3 mm glucose, a large transient elevation of [Ca2+]c was observed (Fig. 4C). In the absence of glucose, cinacalcet induced a similar pattern of changes in [Ca2+]c and a subsequent decrease reaching [Ca2+]c levels lower than the basal ones (Fig. 4D).
FIGURE 4.
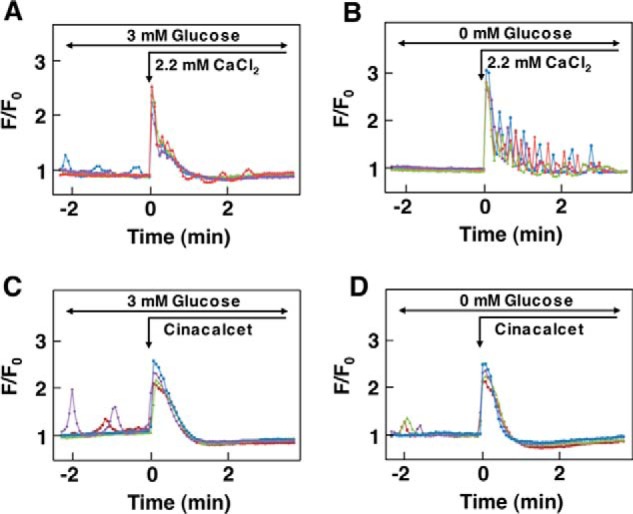
Effect of changes in ambient glucose concentration on CaSR activated by Ca2+ and cinacalcet. A, effect of Ca2+ on CaSR in the presence of glucose. Cells were incubated in buffer containing 3 mm glucose, and extracellular Ca2+ was raised from 1.3 mm to 2.2 mm as shown by the arrow. Results are representative of three experiments. B, effect of Ca2+ on CaSR in the absence of glucose. Cells were incubated in buffer without glucose for 15 min, Then extracellular Ca2+ was raised from 1.3 mm to 2.2 mm. Results are representative of three experiments. C, effect of cinacalcet on CaSR in the presence of glucose. Cells were incubated in buffer containing 3 mm glucose and 1.3 mm Ca2+. Cinacalcet (1.5 μm) was added as indicated. Results are representative of two experiments. D, effect of cinacalcet on CaSR in the absence of glucose. Cells were incubated for 15 min in buffer containing 0 mm glucose and 1.3 mm Ca2+. Then 1.5 μm cinacalcet was added as indicated. Results are representative of two experiments.
Effect of Sweet Molecules on [Ca2+]c in HEK-CaSR Cells
We then examined the effect of various molecules presenting sweet taste. As shown in Fig. 5A, sucrose induced a similar pattern of changes in [Ca2+]c as glucose. Sucrose induced an immediate transient elevation of [Ca2+]c, which was followed by a sustained reduction of [Ca2+]c. It should be noted that ambient glucose concentration should be kept low, for example 3 mm, to observe the effect of sucrose. The effect of sucrose on [Ca2+]c was not observed in the presence of 5.5 mm glucose. Again, this is perhaps due to nearly maximal activation of CaSR by 5.5 mm glucose. Likewise, sucralose, an artificial sweetener, induced similar changes in [Ca2+]c in HEK-CaSR cells (Fig. 5B). Fig. 5C demonstrates the dose-response relationship for [Ca2+]c responses induced by sucrose and sucralose. Both sucrose and sucralose induced a maximal effect at a concentration of 10 mm, although a high percentage of cells were reactive even at 4 mm. Acesulfame-K, an artificial sweetener, also induced a similar pattern of changes in [Ca2+]c (Fig. 5D). Likewise, glycyrrhizin, a natural sweet compound, induced biphasic changes in [Ca2+]c in HEK-CaSR cells (Fig. 5E). The effect of sucralose on [Ca2+]c was inhibited by NPS-2143. In the presence of NPS-2143, only 2% of the cells responded to sucralose (Fig. 5F). In those responsive cells, elevation of [Ca2+]c was blunted (Fig. 5G). Similarly, the effect of sucrose was also inhibited by NPS-2143 (data not shown).
FIGURE 5.
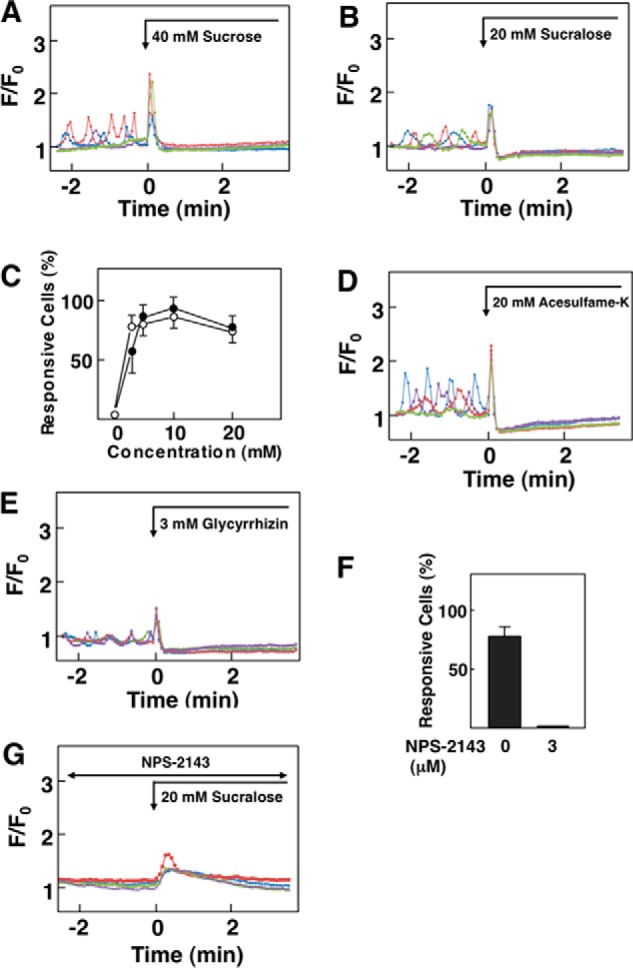
Effect of sweet molecules on [Ca2+]c in HEK-CaSR cells. A, effect of sucrose on [Ca2+]c. Sucrose (40 mm) was added as indicated by the arrow, and [Ca2+]c was monitored. Results are representative of six experiments. B, effect of sucralose on [Ca2+]c. Sucralose (20 mm) was added as indicated, and changes in [Ca2+]c were monitored. Results are representative of three experiments. C, dose-response relationship for sucrose- and sucralose-induced elevation of [Ca2+]c. Experiments were carried out as shown in A and B, and the percentage of responsive cells was counted. Values are the mean ± S.E. for three to six experiments. ●, sucrose; ○, sucralose. D, effect of acesulfame-K on [Ca2+]c. Acesulfame-K (20 mm) was added as indicated, and changes in [Ca2+]c were monitored. Results are representative of three experiments. E, effect of glycyrrhizin on [Ca2+]c. Glycyrrhizin (3 mm) was added as indicated, and changes in [Ca2+]c were monitored. Results are representative of three experiments. F, HEK-CaSR cells were stimulated by 20 mm sucralose in the presence and absence of 3 μm NPS-2143, and changes in [Ca2+]c were monitored. The number of responsive cells was counted. Values are the mean ± S.E. for three experiments. G, effect of NPS-2143 on sucralose-induced changes in [Ca2+]c. Sucralose (20 mm) was added in the presence of 3 μm NPS-2143, which was added 30 min before the stimulation by sucralose. Results are representative of three experiments.
Effect of Glucose on [cAMP]c in HEK-CaSR Cells
We then measured changes in [cAMP]c by using Flamindo2 (16). As shown in Fig. 6A, an elevation of [cAMP]c by forskolin induced a decrease in the fluorescence ratio of Flamindo2, indicating that forskolin elevated [cAMP]c. As shown in Fig. 6B, the addition of 5 mm glucose induced an immediate and sustained increase in the fluorescence, which indicates that glucose induced a rapid and sustained decrease in [cAMP]c. The effect of glucose was observed in almost all of the cells examined. Fig. 6C demonstrates the effect of cinacalcet, an allosteric activator of CaSR, on [cAMP]c. As can be seen, cinacalcet induced a sustained decrease in [cAMP]c. Similarly, the addition of 10 mm sucralose induced a rapid and sustained decrease in [cAMP]c (Fig. 6D). The effect of glucose on [Ca2+]c was inhibited by NPS-2143 (Fig. 6, E and F). Note that, in HEK-CaSR cells pretreated with pertussis toxin (PTX), the effect of glucose on [cAMP]c was inhibited (Fig. 6G).
FIGURE 6.
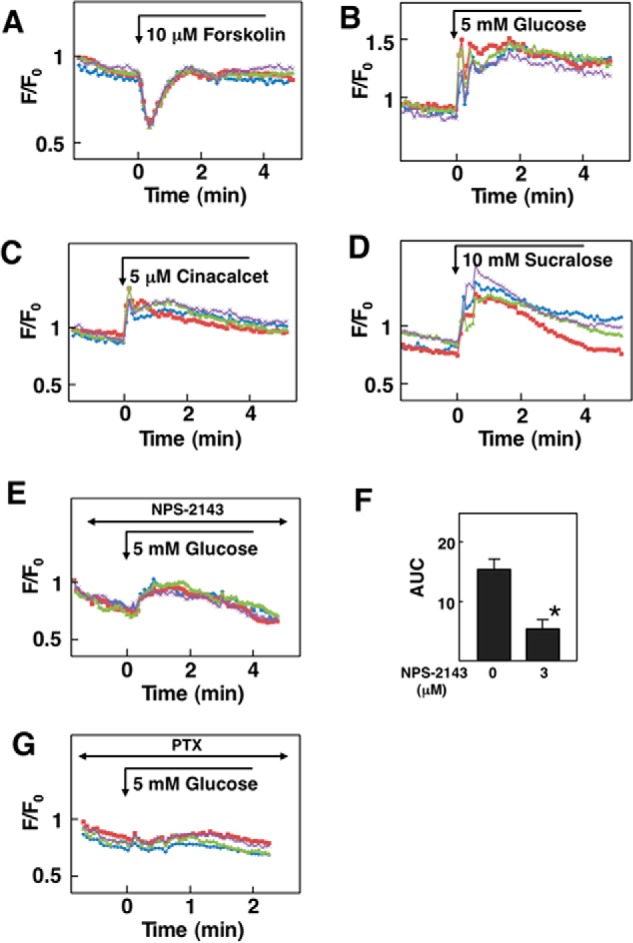
Effect of glucose on [cAMP]c in HEK-CaSR cells. A, effect of forskolin on [cAMP]c. Forskolin (10 μm) was added as indicated by the arrow, and changes in [cAMP]c were measured. Note that Flamindo2 fluorescence decreases when [cAMP]c is elevated. Results are representative of three experiments. B, effect of glucose on [cAMP]c. The effects of 5 mm glucose on [cAMP]c was measured in HEK-CaSR cells. Results are representative of three experiments. C, effect of cinacalcet on [cAMP]c. Cinacalcet (5 μm) was added as indicated, and changes in [cAMP]c were measured. Results are representative of two experiments. D, effect of sucralose on [cAMP]c. Sucralose (10 mm) was added as indicated, and changes in [cAMP]c were monitored. Results are representative of two experiments. E, HEK-CaSR cells were incubated for 30 min with 3 μm NPS-2143 and then stimulated by 5 mm glucose. Changes in [cAMP]c were monitored. Results are representative of three experiments. F, experiments were done as in B and E, and the AUC from 0 to 5 min was calculated. Values are the mean ± S.E. for three experiments. *, p < 0.01 versus without NPS-2143. G, effect of glucose on [cAMP]c in pertussis toxin (PTX)-treated HEK-CaSR cells. Cells were pretreated with 1 μg/ml pertussis toxin for 14 h and then stimulated by 5 mm glucose.
Effect of Glucose on [Ca2+]c in Cells Expressing Endogenous CaSR
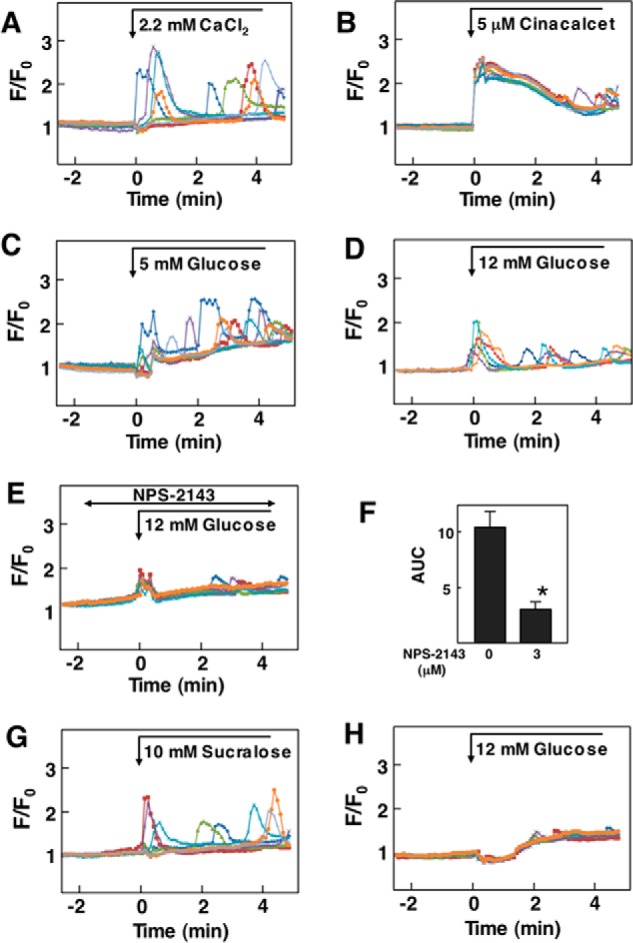
The above results indicate that glucose activates CaSR in HEK293 cells expressing hCaSR. To examine whether glucose is capable of activating endogenous CaSR, we examined the effect of glucose on [Ca2+]c in PT-r cells (17), a cell line established from the rat parathyroid gland. As shown in Fig. 7A, PT-r cells expressed a significant amount of CaSR. In these cells, elevation of extracellular calcium from 1.3 mm to 2.2 mm induced an oscillatory elevation of [Ca2+]c (Fig. 7B). Similarly, cinacalcet induced an oscillation of [Ca2+]c in PT-r cells (Fig. 7C). As shown in Fig. 7D, elevation of glucose concentration from 3 mm to 8 mm evoked an oscillatory elevation of [Ca2+]c. This type of [Ca2+]c response to glucose was observed in 34.0 ± 5.0% (n = 3) of the cells examined. We also examined the effect of higher concentrations of glucose. As shown in Fig. 7E, an immediate and transient elevation of [Ca2+]c was observed in response to 12 mm glucose, which was followed by oscillation of [Ca2+]c. As shown in Fig. 7F, 25 mm glucose induced an immediate increase in [Ca2+]c. The elevation of [Ca2+]c was only transient, and subsequently, a sustained reduction of [Ca2+]c was observed. This type of [Ca2+]c response was observed in almost all of the cells examined. The effect of glucose was inhibited by NPS-2143 (Fig. 7G). Note that higher concentration of NPS-2143 was needed to inhibit rat CaSR (Fig. 7H). We then stimulated PT-r cells with an artificial sweetener, sucralose. As shown in Fig. 8A, 10 mm sucralose induced an oscillatory elevation of [Ca2+]c in 76.0 ± 3.6% (n = 3) of the cells. At 20 mm, sucralose induced an immediate but transient increase in [Ca2+]c, which was followed by the oscillation of [Ca2+]c (Fig. 8B). This type of [Ca2+]c response was observed in 38.0 ± 4.6% (n = 3) of the cells. We then knocked down CaSR by using siRNA in PT-r cells. In CaSR knockdown cells, mRNA level for CaSR was 30% that in control cells. In these cells, the effect of glucose was not observed (Fig. 8C).
FIGURE 7.
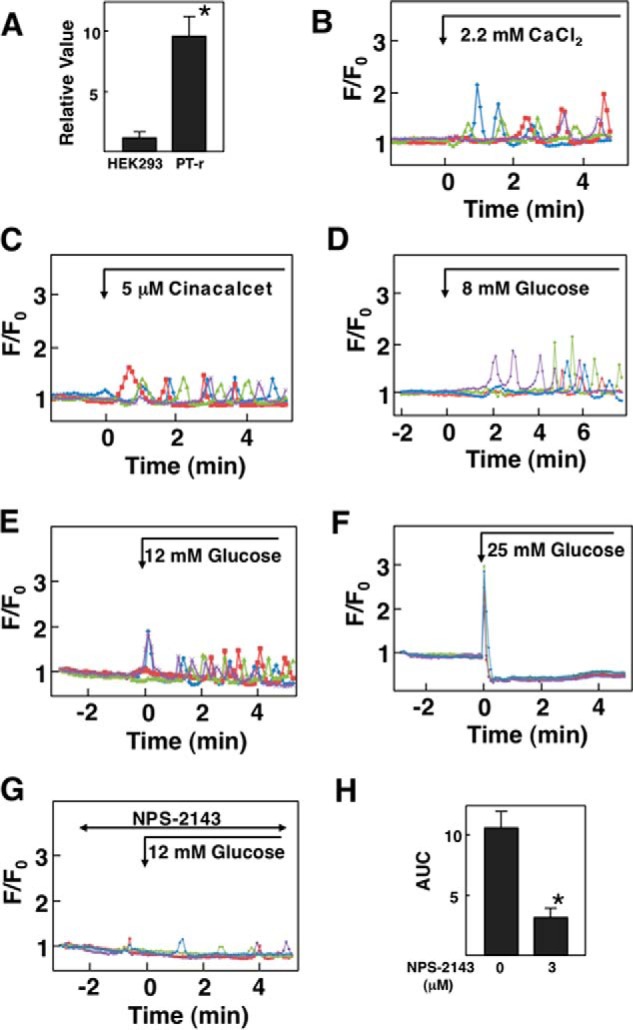
Effect of glucose on [Ca2+]c in PT-r cells. A, expression of CaSR in PT-r cells. mRNA for CaSR was measured in PT-r cells and HEK293 cells by quantitative RT-PCR. Values are the mean ± S.E. for five experiments. *, p < 0.05 versus HEK293 cells. B, effect of Ca2+ on [Ca2+]c. PT-r cells were stimulated by 2.2 mm Ca2+, and changes in [Ca2+]c were measured. Results are representative of two experiments. C, effect of cinacalcet on [Ca2+]c. PT-r cells were stimulated by 5 μm cinacalcet, and changes in [Ca2+]c were monitored. Results are representative of two experiments. D–F, effect of glucose on [Ca2+]c. PT-r cells were stimulated by 8 mm (D), 12 mm (E), or 25 mm (F) glucose, and changes in [Ca2+]c were measured. Results are representative of three experiments. G, effect of NPS-2143 on glucose-induced changes in [Ca2+]c. PT-r cells were preincubated with 10 μm NPS-2143 and then stimulated by 12 mm glucose. Changes in [Ca2+]c were monitored. Results are representative of four experiments. H, experiments were performed as shown in G. The AUC from 0 to 6 min was calculated. Values are the mean ± S.E. for four experiments. *, p < 0.01 versus without NPS-2143.
FIGURE 8.
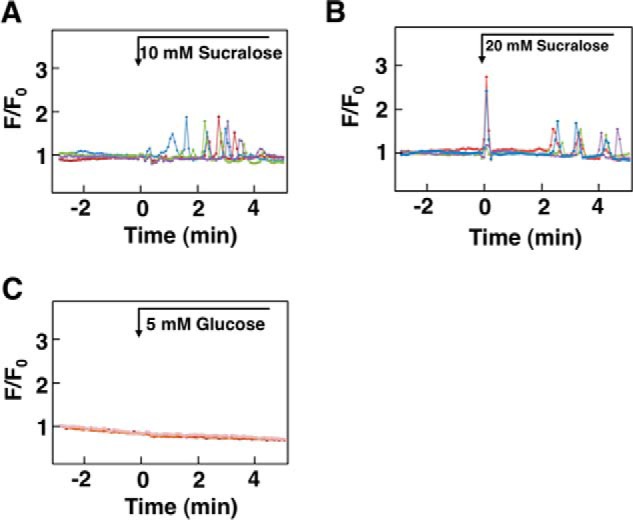
Effect of sweet molecules on [Ca2+]c in PT-r cells. A and B, effects of sucralose on [Ca2+]c. PT-r cells were stimulated by 10 mm (A) or 20 mm (B) sucralose, and changes in [Ca2+]c were measured. Results are representative of three experiments. C, CaSR knockdown PT-r cells were stimulated by 5 mm glucose, and changes in [Ca2+]c were monitored. Results are representative of three experiments.
We next examined the effect of glucose on [Ca2+]c in Madin-Darby canine kidney (MDCK) cells (18), a cell line derived from renal tubular epithelial cells expressing CaSR. In these cells the elevation of extracellular Ca2+ from 1.3 mm to 2.2 mm induced an oscillatory elevation of [Ca2+]c (Fig. 9A). This type of response was observed in 48.0 ± 5.0% (n = 3) of the cells. The addition of cinacalcet induced an immediate and sustained elevation of [Ca2+]c in nearly all of the cells (Fig. 9B). As in PT-r cells, elevation of glucose from 3 mm to 5 mm induced an oscillatory elevation of [Ca2+]c in 49% (mean of two) of MDCK cells (Fig. 9C). When ambient glucose concentration was further increased to 12 mm, glucose induced an immediate elevation of [Ca2+]c, which was followed by an oscillatory elevation of [Ca2+]c in 72.2 ± 4.2 (n = 3) of the cells (Fig. 9D). NPS-2143 inhibited the effect of glucose in MDCK cells (Fig. 9, E and F). As shown in Fig. 9G, 10 mm sucralose induced a similar oscillatory elevation of [Ca2+]c as glucose. This type of elevation of [Ca2+]c was observed in 44% (mean of two) of the cells. We then knocked down CaSR in MDCK cells using siRNA. In knocked down cells, the mRNA level of CaSR was 30% that of control cells. Glucose-induced elevation of [Ca2+]c was inhibited in CaSR knockdown cells (Fig. 9H).
FIGURE 9.
Effect of glucose on [Ca2+]c in MDCK Cells. A, effect of Ca2+ on [Ca2+]c in MDCK cells. Extracellular Ca2+ was raised from 1.3 mm to 2.2 mm, and changes in [Ca2+]c were monitored. Results are representative of three experiments. B, effect of cinacalcet on [Ca2+]c. Cells were stimulated by 5 μm cinacalcet, and changes in [Ca2+]c were measured. Results are representative of two experiments. C and D, effect of glucose on [Ca2+]c in MDCK cells. Glucose concentration in the buffer was raised from 3 mm to 5 mm (C) or 12 mm (D), and changes in [Ca2+]c were measured. Results are representative of three experiments. E, effect of NPS-2143 on [Ca2+]c. MDCK cells preincubated for 30 min with 10 μm NPS-2143 and stimulated by 12 mm glucose. Changes in [Ca2+]c were monitored. Results are representative of two experiments. F, experiments were performed as shown in C and E. The AUC from 0 to 6 min was calculated. Values are the mean ± S.E. for 12 experiments. *, p < 0.01 versus without NPS-2143. G, effect of sucralose on [Ca2+]c in MDCK cells. Cells were stimulated by 10 mm sucralose, and changes in [Ca2+]c were measured. Results are representative of two experiments. H, CaSR knockdown MDCK cells were stimulated by 12 mm glucose, and changes in [Ca2+]c were monitored. Results are representative of three experiments.
Discussion
In the present study we showed for the first time that glucose allosterically modulated CaSR and increased [Ca2+]c in HEK-CaSR cells. The elevation of [Ca2+]c was due to the allosteric stimulation of CaSR by glucose as glucose did not affect [Ca2+]c in naive HEK293 cells. The effects of glucose on CaSR are unique in several respects.
First, glucose exerts its effect at relatively low and physiologically relevant concentrations. In HEK-CaSR cells, an elevation of [Ca2+]c was observed when ambient glucose was raised from 3 to 4 mm, and surprisingly 5 mm glucose elicited the maximal effect. This implies that in physiological settings, CaSR is already stimulated by the plasma glucose at least to some extent. We have to mention that most of the previous studies to characterize the function of CaSR in vitro were performed in the buffer containing physiological concentration of glucose, for example 5.5 mm glucose. This means that CaSR was already stimulated significantly by the ambient glucose. In our experiments, we characterized the function of CaSR in the presence of 3.0 mm ambient glucose. Therefore, CaSR is less active in our experimental conditions. Most of the natural agonists for CaSR known to date are inorganic cations and organic cationic compounds (5). In addition, aromatic amino acids such as Phe, Tyr, His, and Trp act as positive allosteric modulators (19). Sugars including glucose and sucrose as well as artificial sweeteners should be considered as allosteric modulators of CaSR. Our results are apparently different from those by Quinn et al. (20) and Rogachevskaja (8). They showed that sucrose and sucrose octaacetate did not affect [Ca2+]c in HEK-CaSR cells. The absence of the effect of these sugars may have been due to the higher ambient glucose concentration. Although they did not mention the exact concentration of glucose in the buffer used in their measurements, it is likely that they used the buffer containing 5.5 mm glucose. If so, CaSR was already activated by glucose, and the effect of sucrose was difficult to detect.
Second, although glucose increased [Ca2+]c in HEK-CaSR cells in physiological conditions, glucose is not capable of activating CaSR in the absence of extracellular Ca2+. In this regard glucose is not a genuine agonist for CaSR, and instead, it acts as an allosteric modulator of this receptor. In accordance with this notion, an allosteric inhibitor of CaSR, NPS-2143, inhibited the effect of glucose on CaSR. This is in line with the observation that NPS-2143 is able to inhibit the effect of Ca2+ and calcimimetics such as NPS R-467 (21). Glucose and other sweet compounds should be listed as allosteric modulators of CaSR.
Third, CaSR is activated not only by glucose but also by sucrose and other natural and synthetic sweeteners, all of which activate the sweet taste receptor (22). The effects of sucrose and other sweeteners were due to activation of CaSR but not endogenous T1R3. This is deduced because these compounds were ineffective in HEK293 cells. Furthermore, the expression of T1R3 in HEK293 and HEK-CaSR was detectable by RT-PCR, but the expression level was very low. Also, the effects of these compounds were not inhibited by lactisole, an inhibitor of T1R3 (12). In activating CaSR, however, these sweet taste compounds are slightly less potent compared with glucose. This is quite different from what we know about the activation of the sweet taste receptor by these sweet compounds; sucralose and sucrose are much more potent than glucose in activating the sweet taste receptor (22). Although the rank of potency is different, these compounds resemble glucose in some respects in activating CaSR. For example, these sweet molecules induced a biphasic response of [Ca2+]c; that is, an initial transient elevation of [Ca2+]c followed by a sustained decrease in [Ca2+]c. In addition, as in the case of glucose, the effects of sucralose and sucrose were inhibited by NPS-2143 (Fig. 4F). At present, the exact binding site for glucose in CaSR is not certain. In this regard, all these sweet taste molecules activate the sweet taste receptor, a heterodimer of T1R2 and T1R3 (23), both of which possess the VFTD. All these sweet compounds except glycyrrhizin bind to the VFTD of the sweet taste receptor subunit (22). Given the similarity of the stereostructure of the VFTD among members of the family C GPCR (24), it is possible that glucose and sucrose interact with a site in VFTD of CaSR. This possibility should be assessed experimentally in the near future.
Fourth, glucose-induced biphasic changes in [Ca2+]c; a transient elevation was followed by a sustained decrease in [Ca2+]c (Fig. 2A). This is a rather unusual [Ca2+]c response to Ca2+ mobilizing agonists. At present, the mechanism for the sustained reduction of [Ca2+]c in response to glucose is not clear. The sustained decrease in [Ca2+]c may be explained by the extrusion of Ca2+ to endoplasmic reticulum or other organelles together with suppression of Ca2+ entry. The exact mechanism for the unique action of glucose remains to be determined.
Fifth, glucose decreased [cAMP]c in HEK-CaSR cells (Fig. 5A). This response is mediated by the activation of Gi, as it was blocked by the pretreatment with pertussis toxin. In HEK-CaSR cells, cinacalcet also decreased [cAMP]c (Fig. 5C). As in parathyroid cells (25, 26), CaSR is coupled to Gi in HEK-CaSR cells.
The present results clearly show that CaSR is allosterically stimulated by glucose at relatively low concentrations. The physiological significance of this glucose effect, however, is not certain at present. In this regard, the glucose sensitivity of CaSR is quite high, and CaSR is already activated by physiological concentrations of glucose in the plasma. Therefore, most of the previous studies on CaSR performed in vitro and in vivo were carried out under the conditions where CaSR is activated at least to some extent by glucose. Recently, CaSR is shown to function as the kokumi receptor in taste buds of the tongue (27). CaSR is expressed in some population of the type 2 taste cells in the taste buds (28). When stimulated by an agonist, for example γ-glutamylcysteinylglycine (GSH), GSH activates the kokumi pathway, which enhances the sweet, salty, and umami tastes (27). When sweet substances such as sucrose are ingested, both CaSR and the sweet taste receptor may be activated, and the sweet sensation is enhanced by the activation of the kokumi pathway.
We have been studying the cell-surface receptor activated by glucose in pancreatic β-cells (9, 11). In these cells, glucose activates cell-surface receptor, which is dependent on T1R3 (11). Presumably, a homodimer of T1R3 may function as a glucose-sensing receptor. Compared with the cell-surface receptor in β-cells, glucose sensitivity of CaSR is quite high. CaSR, which is expressed considerably in β-cells (29, 30), may be already activated in the presence of physiological concentrations of glucose. There is a possibility that CaSR and T1R3 form a heterodimer. If this is the case, what is the glucose sensitivity of the putative heterodimer? Does the heterodimer also function as the glucose-sensing receptor? Further studies are clearly necessary to address these issues.
In summary, CaSR is allosterically stimulated by physiological concentrations of glucose in HEK-CaSR cells. This sugar acts as an allosteric modulator of CaSR and elicits unique patterns of intracellular signals.
Experimental Procedures
Materials
Sucralose, 3-O-methyl-d-glucose, and lactisole were obtained from Sigma. Glucose, sucrose, acesulfame-K, and glycyrrhizin were from Wako Pure Chemicals (Osaka, Japan), and cinacalcet was from Chemscene LLC (Monmouth Junction, NJ). NPS-2143 was kindly provided by Dr. Yuzuru Eto (Ajinomoto Co., Kawasaki, Japan). These chemicals were dissolved in a solution composed of 140 mm NaCl, 5 mm KCl, 1 mm MgCl2, 1.3 mm CaCl2, 10 mm HEPES/NaOH (pH 7.3), and 3 mm glucose unless otherwise mentioned. This solution was named extracellular solution (ECS) for descriptive purposes applied to the experimental conditions. All of the chemical reagents used to prepare the ECS were obtained from Wako Pure Chemicals except HEPES (Dojindo Molecular Technologies, Kumamoto, Japan). U73122, an inhibitor of phospholipase C (PLC) (13), and its inactive analogue U73343 were obtained from EDM Millipore (Billerica, MA). YM25489, an inhibitor of Gq (14), was a generous gift from Dr. Jun Takasaki (Yamanouchi Pharmaceutical, Ibaraki, Japan).
Cell Culture
HEK293 cells obtained from the Riken Cell Bank (Riken Bioresource Center, Ibaraki, Japan) were grown in Dulbecco's modified Eagle's medium (DMEM) containing a high concentration of glucose (Invitrogen), 10% fetal bovine serum (FBS) (Sigma), MEM non-essential amino acids solution (Invitrogen), and penicillin-streptomycin solution (Wako Pure Chemicals). HEK293 cells stably expressing hCaSR were continuously selected by adding G418 sulfate (Wako Pure Chemicals) to the growth medium. PT-r cells (a rat parathyroid cell line) (17) were grown in Epilife medium (Invitrogen) and antibiotics. MDCK cells (18) obtained from the American Type Culture Collection were maintained in a “complete medium” composed of α-MEM (Invitrogen) supplemented with 10% FBS, 2 mm l-glutamine (Invitrogen), and penicillin-streptomycin solution. MDCK cells were grown to confluence in 35-mm glass bottom culture dishes in α-MEM. Cells were then washed twice with minimum essential medium for suspension culture (S-MEM, Invitrogen) and incubated in S-MEM supplemented with 5% dialyzed fetal bovine serum, 2 mm l-glutamine, and penicillin-streptomycin solution (low calcium medium). Cells were incubated in low calcium medium for 16 h and then prepared for the corresponding measurement. All of the aforementioned cells were cultured in a humidified incubator with 95% air and 5% CO2 at 37 °C and kept in a warmed chamber that maintained the extracellular solution in a temperature range that oscillated between 35 °C and 38 °C during the experiment.
Establishment of HEK-CaSR Cells
Transfection was carried out using an expression vector encoding hCaSR kindly provided by Dr. Edward Brown (Brigham and Women's Hospital, Boston, MA). Transfection was achieved using the Attractene Transfection Reagent (Qiagen, Hilden, Germany) according to the manufacturer's protocol. hCaSR-transfected HEK293 cells were selected using the functional expression of the neomycin resistance gene included in the plasmid sequence for 14 days. Sixty resistant colonies were expanded, and their hCaSR mRNA expression was evaluated by using real-time quantitative PCR (31). Primers used in this study are shown in Table 1. Six colonies expressing the highest amount of hCaSR mRNA were isolated, and their [Ca2+]c responses to different extracellular conditions and various agonists were evaluated by using fluorescence microscopy. The cell line with the strongest response was used for all analyses.
TABLE 1.
Primers used this study
| Forward | Reverse | |
|---|---|---|
| Human GAPDH | 5′-GATCATCAGCAATGCCTCCT-3′ | 5′-TGTGGTCATGAGTCCTTCCA-3′ |
| Human CaSR | 5′-GCTCCTGTGCAGACATCAAG-3′ | 5′-AGGTGCCAGTTGATGATGGA-3′ |
| Rat GAPDH | 5′-TGCCACTCAGAAGACTGTGG-3′ | 5′-TTCAGCTCTGGGATGACCTT-3′ |
| Rat CaSR | 5′-GCCTCAGAAGAATGCCATGG-3′ | 5′-TCTGCACACTGTAGGGGAAG-3′ |
Measurement of [Ca2+]c and Activation of Protein Kinase C in HEK-CaSR Cells
Two days before measurement, cells were placed on 35-mm glass bottom culture dishes. ECS was used for the measurement of [Ca2+]c. [Ca2+]c was monitored by using a fluorescent Ca2+ indicator fluo-8/AM (AAT Bioquest, Sunnyvale, CA). HEK-CaSR cells were loaded with fluo-8 by incubating in ECS containing 4 μm fluo-8/AM for 30 min on a hot plate at 37 °C. For the measurement, cells were placed inside a heated chamber MI-IBC attached to the microscope stage and connected to a microscope objective lens heater through a temperature controller (Olympus, Tokyo, Japan). The temperature of the aqueous extracellular environment was tightly controlled between 35 °C and 38 °C. Visualization was performed using an UPlanApo 10×/0.40 objective lens (Olympus). To detect the fluorescence images, we used the AQUACOSMOS/ASHURA imaging system (Hamamatsu Photonics, Hamamatsu, Japan) (32). The values (F) were normalized to each initial value (F0), and the relative fluorescence change was referred to as F/F0 (32). The stimulation was performed by slowly applying the stimulus using a perfusion system inserted through a small opening in the top of the warm chamber. For the analyses of the effects of agonists and inhibitors, representative traces (each one corresponding to one cell) were selected. Selected patterns were considered representative when they showed a similar reaction in >80% of all the examined cells in the observed microscopic field. Four to seven representative traces are presented. For the determination of the dose-response relationship, the sensitivity degree to a certain stimulus was estimated by calculating the percentage of reactive cells and averaging the results obtained from at least 10 samples corresponding to each experimental protocol. Results are expressed as the mean ± S.E. of accumulated data obtained in multiple experiments. Statistical analysis was performed using Student's t test. To monitor activation of PKC, we monitored translocation of a PKC substrate myristoylated alanine-rich protein kinase C substrate (MARCKS) (18). MARCKS is located in the plasma membrane in a unphosphorylated state but is translocated to the cytosol upon phosphorylation. Using cells transfected with EGFP-N2-MARCKS, we monitored translocation of MARCKS from the plasma membrane to the cytosol as described previously (33).
Measurement of Cytoplasmic [cAMP]c in HEK-CaSR Cells
Changes in cytoplasmic cAMP ([cAMP]c) were monitored by using Flamindo2 (16). HEK-CaSR cells were transiently transfected with 1.2 μg of plasmid encoding Flamindo2 using 4.5 μl of Attractene transfection reagent (Qiagen) per dish. Transfected cells were cultured for 3 days at 30 °C. For imaging experiments, transfected cells were incubated in ECS, and after extracellular solution temperature reached the predetermined values, cells were visualized using an UPlanApo 10×/0.40 objective lens (Olympus). A 485-nm dichroic mirror (U-MGFPHQ fluorescence filter cube, Olympus) and an ORCA-3CCD digital camera (Hamamatsu Photonics) containing an RGB prism were used for the measurement of a single wavelength of Flamindo2. Neutral density filters were not needed. For detection of the yellow fluorescence protein variant (citrine), we used AQUACOSMOS/ASHURA imaging system (Hamamatsu Photonics). The values (F) were normalized to each initial value (F0), and the relative fluorescence change was referred to as F/F0. Stimulus was applied as described above. The analyses of the reaction to each particular stimulus were processed, and data were presented in the same way as described for the measurement of [Ca2+]c.
Immunoblotting
HEK293 and HEK-CaSR cells were washed with phosphate-buffered saline (PBS) and lysed with PBS containing complete Mini EDTA-free (Roche Diagnostics). Cell lysates were cleared by centrifugation. Supernatants were mixed with sample buffer (8 m urea, 5% SDS, 50 mm Tris/HCl (pH 6.8), 0.343 m DTT, and 0.005% bromophenol blue) and separated on 4–15% Mini-PROTEAN TGX Gel (Bio-Rad) before transfer to Immobilon-P Membrane (Merck Millipore). Membranes were blocked for 1 h at room temperature using blocking buffer containing 5% skim milk and 0.05% Polysorbate 20 (MP Biomedicals, LLC; Santa Ana, CA) in Tris-buffered saline (TBS). Membranes were incubated with primary antibodies, anti-calcium sensing receptor antibody (ab19347; Abcam; Cambridge, UK) and anti-β-tubulin antibody (ab11308; Abcam), at a 1:1000 dilution at room temperature for 2 h. Membranes were incubated with secondary antibody coupled to horseradish peroxidase, anti-mouse IgG, HRP-linked whole Ab sheep (NA931V; GE Healthcare) at a 1:1000 dilution at room temperature for 1 h. Protein was visualized by luminate (Merck Millipore).
Immunocytochemistry
HEK293 and HEK-CaSR cells were washed with PBS, fixed with 3% paraformaldehyde at room temperature for 40 min, washed with PBS, and blocked with Block Ace (DS Pharma Biomedical Co., Ltd.; Osaka, Japan) at room temperature for 40 min. Cells were incubated with primary antibodies and DYKDDDDK tag antibody (#2368; Cell Signaling Technology, Inc; Danvers, MA) at a 1:1000 dilution at room temperature for 1 h and washed with PBS. Cells were incubated with secondary antibodies, goat anti-rabbit IgG (H+L) secondary antibody and Alexa Fluor 568 conjugate (A-11036; Thermo Fisher; Waltham, MA), at a 1:1000 dilution at room temperature for 1 h, after which the samples were washed with PBS for 5 min twice and incubated with DAPI (46190; Thermo Fisher) at a 1:1000 dilution at room temperature for 5 min before they were mounted on the slide glass. The cells were observed under a confocal laser scanning microscope (FV1000; Olympus).
Knockdown of CaSR Using siRNA
MDCK and PT-r cells were grown in 35-mm dishes until reaching ∼80% confluence. Then the cells were transfected with 1.2 μg of CaSR siRNA duplex for the dog gene (Sigma) or ON-TARGT plus SMART pool siRNA for the rat gene (GE Healthcare). Transfection was performed using Attractene reagent according to the manufacturer's instruction. After 24 h, the cells were tested in their response to stimulants or prepared for measurement of mRNA expression.
Author Contributions
J. M. performed, analyzed, and interpreted the biochemical experiments. Y. N., M. N., and A. F. performed and analyzed the experiments. K. S. provided a cell line and interpreted the results. T. K. provided the cAMP indicator and interpreted the results. I. K. designed and drafted the article. All authors reviewed the results and approved the final version of the manuscript.
Acknowledgment
We thank Mayumi Odagiri for secretarial assistance during preparation of the manuscript.
This work was supported by a grant-in-aid from the Ministry of Education, Culture, Sports, Science, and Technology of Japan. The authors declare that they have no conflicts of interest with the contents of this article.
- CaSR
- calcium-sensing receptor
- hCaSR
- human CaSR
- GPCR
- G protein-coupled receptor
- VFTD
- Venus flytrap domain
- AUC
- area under the curve
- MDCK
- Madin-Darby canine kidney
- ECS
- extracellular solution
- MEM
- minimum essential medium
- MARCKS
- myristoylated alanine-rich protein kinase C substrate.
References
- 1. Brown E. M., Chen C. J., Kifor O., Leboff M. S., el-Hajj G., Fajtova V., and Rubin L. T. (1990) Ca2+-sensing second messengers and the control of parathyroid hormone secretion. Cell Calcium 11, 333–337 [DOI] [PubMed] [Google Scholar]
- 2. Brown E. M., Gamba G., Riccardi D., Lombardi M., Butters R., Kifor O., Sun A., Hediger M. A., Lytton J., and Hebert S. C. (1993) Cloning and characterization of an extracellular Ca2+-sensing receptor from bovine parathyroid. Nature 366, 575–580 [DOI] [PubMed] [Google Scholar]
- 3. Riccardi D. (2002) Cell surface ion-sensing receptors. Exp. Physiol. 87, 403–411 [DOI] [PubMed] [Google Scholar]
- 4. Conigrave A. D., Franks A. H., Brown E. M., and Quinn S. J. (2002) l-Amino acid sensing by the calcium-sensing receptor. Eur. J. Clin. Nutr. 56, 1072–1080 [DOI] [PubMed] [Google Scholar]
- 5. Conigrave A. D., and Ward D. T. (2013) Calcium-sensing receptor: Pharmacological properties and signaling pathways. Best. Pract. Res. Clin. Endocrinol. Metab. 27, 315–331 [DOI] [PubMed] [Google Scholar]
- 6. Silve C., Petrel C., Leroy C., Bruel H., Mallet E., Rognan D., and Ruat M. (2005) Delineating a Ca2+ binding pocket within the venus flytrap module of the human calcium sensing receptor. J. Biol. Chem. 280, 37917–37923 [DOI] [PubMed] [Google Scholar]
- 7. Nemeth E. F. (2002) The search for calcium receptor antagonists (calcilytics). J. Mol. Endocrinol. 29, 15–21 [DOI] [PubMed] [Google Scholar]
- 8. Rogachevskaja O. A., Churbanov G. D., Bystrova M. F., Romanov R. A., and Kolesnikov S. S. (2011) Stimulation of the extracellular Ca2+-sensing receptor by denatonium. Biochem. Biophys. Res. Commun. 416, 433–436 [DOI] [PubMed] [Google Scholar]
- 9. Nakagawa Y., Ohtsu Y., Nagasawa M., Shibata H., and Kojima I. (2014) Glucose-promotes its own metabolism by acting on the cell-surface glucose-sensing receptor T1R3. Endocr. J. 61, 119–131 [DOI] [PubMed] [Google Scholar]
- 10. Ohtsu Y., Nakagawa Y., Nagasawa M., Takeda S., Arakawa H., and Kojima I. (2014) Diverse signaling systems activated by the sweet-taste receptor in human GLP-1-secreting cells. Mol. Cell. Endocrinol. 394, 70–79 [DOI] [PubMed] [Google Scholar]
- 11. Kojima I., Nakagawa Y., Ohtsu Y., Hamano K., Medina J., and Nagasawa M. (2015) Return of the glucoreceptor: glucose activates the glucose-sensing receptor T1R3 and facilitates metabolism in pancreatic β-cells. J. Diabetes Investig. 6, 256–263 [DOI] [PMC free article] [PubMed] [Google Scholar]
- 12. Nagano N., and Nemeth E. (2005) Functional proteins involved in regulation of extracellular Ca2+ for drug development. J. Pharmacol. Sci. 97, 355–360 [DOI] [PubMed] [Google Scholar]
- 13. Bleasdale J. E., Thakur N. R., Gremban R. S., Bundy G. L., Fitzpatrick F. A., Smith R. J., and Bunting S. (1990) Selective inhibition of receptor-coupled phospholipase C-dependent processes in human platelets and polymorphonuclear neutrophils. J. Pharmacol. Exp. Ther. 255, 756–768 [PubMed] [Google Scholar]
- 14. Takasaki J., Saito T., Taniguchi M., Kawasaki T., and Moritani Y. (2004) A novel Gq/11-selective inhibitor. J. Biol. Chem. 279, 47438–47445 [DOI] [PubMed] [Google Scholar]
- 15. Jiang P., Cui M., Zhao B., Liu Z., Snyder L. A., Benard L. M., Osman R., Margolskee R. F., and Max M. (2005) Lactisole interacts with the transmembrane domains of human T1R3 to inhibit sweet taste. J. Biol. Chem. 280, 15238–15246 [DOI] [PubMed] [Google Scholar]
- 16. Odaka H., Arai S., Inoue T., and Kitaguchi T. (2014) Genetically-encoded yellow fluorescent cAMP indicator with an expanded dynamic range for dual-color imaging. PloS ONE 9, e100252. [DOI] [PMC free article] [PubMed] [Google Scholar]
- 17. Sakaguchi K., Santora A., Zimering M., Curcio F., Aurbach G. D., and Brandi M. L. (1987) Functional epithelial cell line cloned from rat parathyroid glands. Proc. Natl. Acad. Sci. U.S.A. 84, 3269–3273 [DOI] [PMC free article] [PubMed] [Google Scholar]
- 18. Jouret F., Wu J., Hull M., Rajendran V., Mayr B., Schöfl C., Geibel J., and Caplan M. J. (2013) Activation of the Ca2+-sensing receptor induces deposition of tight junction components to the epithelial cell plasma membrane. J. Cell Sci. 126, 5132–5142 [DOI] [PMC free article] [PubMed] [Google Scholar]
- 19. Conigrave A. D., Quinn S. J., and Brown E. M. (2000) l-Amino acid sensing by the extracellular Ca2+-sensing receptor. Proc. Natl. Acad. Sci. U.S.A. 97, 4814–4819 [DOI] [PMC free article] [PubMed] [Google Scholar]
- 20. Quinn S. J., Kifor O., Trivedi S., Diaz R., Vassilev P., and Brown E. (1998) Sodium and ionic strength sensing by the calcium receptor. J. Biol. Chem. 273, 19579–19586 [DOI] [PubMed] [Google Scholar]
- 21. Nemeth E. F., Delmar E. G., Heaton W. L., Miller M. A., Lambert L. D., Conklin R. L., Gowen M., Gleason J. G., Bhatnagar P. K., and Fox J. (2001) Calcilytic compounds: potent and selective Ca2+ receptor antagonists that stimulate secretion of parathyroid hormone. J. Pharmacol. Exp. Ther. 299, 323–331 [PubMed] [Google Scholar]
- 22. Temussi P. (2007) The sweet taste receptor: A single receptor with multiple sites and modes of interaction. Adv. Food. Nutr. Res. 53, 199–239 [DOI] [PubMed] [Google Scholar]
- 23. Nelson G., Hoon M. A., Chandrashekar J., Zhang Y., Ryba N. J., and Zuker C. S. (2001) Mammalian sweet taste receptors. Cell 106, 381–390 [DOI] [PubMed] [Google Scholar]
- 24. Urwyler S. (2011) Allosteric modulation of family C G-protein-coupled receptors: from molecular insights to therapeutic perspectives. Pharmacol. Rev. 63, 59–126 [DOI] [PubMed] [Google Scholar]
- 25. Mamillapalli R., and Wysolmerski J. (2010) The calcium-sensing receptor couples to Gα(s) and regulates PTHrP and ACTH secretion in pituitary cells. J. Endocrinol. 204, 287–297 [DOI] [PMC free article] [PubMed] [Google Scholar]
- 26. Mamillapalli R., VanHouten J., and Zawalich W. (2008) Switching of G-protein usage by the calcium-sensing receptor reverses its effect on parathyroid hormone-related protein secretion in normal versus malignant breast cells. J. Biol. Chem. 283, 24435–24447 [DOI] [PMC free article] [PubMed] [Google Scholar]
- 27. Ohsu T., Amino Y., Nagasaki H., Yamanaka T., Takeshita S., Hatanaka T., Maruyama Y., Miyamura N., and Eto Y. (2010) Involvement of the calcium-sensing receptor in human taste perception. J. Biol. Chem. 285, 1016–1022 [DOI] [PMC free article] [PubMed] [Google Scholar]
- 28. Maruyama Y., Yasuda R., Kuroda M., and Eto Y. (2012) kokumi substances, enhancers of basic tastes, induce responses in calcium-sensing receptor expressing taste cells. PloS ONE 7, e34489. [DOI] [PMC free article] [PubMed] [Google Scholar]
- 29. Rasschaert J., and Malaisse W. J. (1999) Expression of the calcium-sensing receptor in pancreatic islet B-cells. Biochem. Biophys. Res. Commun. 264, 615–618 [DOI] [PubMed] [Google Scholar]
- 30. Malaisse W. J., Louchami K., Laghmich A., Ladrière L., Morales M., Villanueva-Peñacarrillo M. L., Valverde I., and Rasschaert J. (1999) Possible participation of an islet B-cell calcium-sensing receptor in insulin release. Endocrine 11, 293–300 [DOI] [PubMed] [Google Scholar]
- 31. Nakagawa Y., Nagasawa M., Mogami H., Lohse M., Ninomiya Y., and Kojima I. (2013) Multimodal function of the sweet taste receptor expressed in pancreatic β-cells: generation of diverse patterns of intracellular signals by sweet agonists. Endocr. J. 60, 1191–1206 [DOI] [PubMed] [Google Scholar]
- 32. Nakagawa Y., Nagasawa M., Yamada S., Hara A., Mogami H., Nikolaev V. O., Lohse M. J., Shigemura N., Ninomiya Y., and Kojima I. (2009) Sweet taste receptor expressed in pancreatic β-cells activates the calcium and cyclic AMP signaling systems and stimulates insulin secretion. PLoS ONE 4, e5106. [DOI] [PMC free article] [PubMed] [Google Scholar]
- 33. Nakagawa Y., Nagasawa M., Medina J., and Kojima I. (2015) Glucose evokes rapid Ca2+ and cyclic AMP signals by activating the cell-surface glucose-sensing receptor in pancreatic β-cells. PLoS ONE 10, e0144053. [DOI] [PMC free article] [PubMed] [Google Scholar]