Abstract
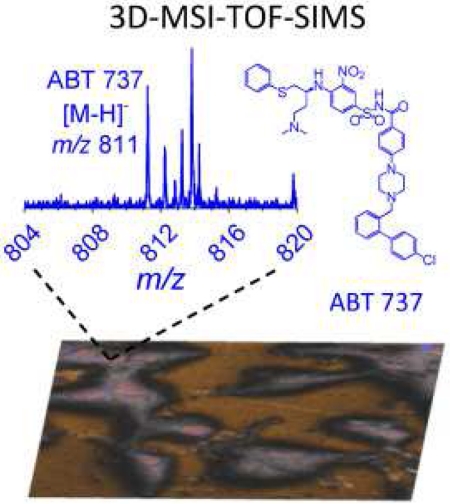
In the present work, we show the advantages of label-free, tridimensional mass spectrometry imaging using dual beam analysis (25 keV Bi3+) and depth profiling (20 keV with a distribution centered at Ar1500+) coupled to time of flight secondary ion mass spectrometry (3D-MSI-TOF-SIMS) for the study of A-172 human glioblastoma cell line treated with B-cell lymphoma 2 (Bcl-2) inhibitor ABT-737. The high spatial (~250 nm) and high mass resolution (m/Δm ~ 10,000) of TOF-SIMS permitted the localization and identification of the intact, unlabeled drug molecular ion (m/z 811.26 C42H44ClN6O5S2−[M-H]−) as well as characteristic fragment ions. We propose a novel approach based on the inspection of the drug secondary ion yield which showed a good correlation with the drug concentration during cell treatment at therapeutic dosages (0 – 200 μM with 4 h incubation). Chemical maps using endogenous molecular markers showed that the ABT-737 is mainly localized in subsurface regions and absent in the nucleus. A semi-quantitative workflow is proposed to account for the biological cell diversity based on the spatial distribution of endogenous molecular markers (e.g., nuclei and cytoplasm) and secondary ion confirmation based on the ratio of drug-specific fragments to molecular ion as a function of the therapeutic dosage.
Graphical abstract
Introduction
A significant challenge in the molecular characterization of biological structures using mass spectrometry (MS) is the amount of material accessible from the sample during MS analysis. [1-7] Major recent breakthroughs are based on achieving high-spatial resolution mapping (sub-micrometer resolution) with abundant molecular ion emission, followed by the unambiguous identification of the molecular components using high-mass resolution MS. For the latter, mass spectrometry techniques are emerging as the analytical gold standard for identification and characterization of molecular components in native biological samples [8]. For example, mass spectrometry imaging (MSI) permits the simultaneous acquisition of molecular components with high sensitivity and without the need for labels or pre-selection of molecules of interest; in MSI analysis, most if not all molecules can be sampled and detected simultaneously [9-12]. MSI lateral resolution is ultimately defined by the dimensions of the desorption probe or desorption volume (from tens of nanometers to hundreds of micrometers) [13-33]. Further development of surface probes has been based on the search for higher desorption yields of molecular ions (currently, 10−4 to 10−3 yields for atomic and polyatomic probes, which provide the highest spatial resolution, typically 10-400 nm) [34]. In particular, when combined with time of flight analyzers, the high spatial resolution probes have found unique applications for the analysis of biological samples at the cellular and subcellular level. The introduction of cluster and nanoparticle probes for surface interrogation of biological surfaces with enhanced secondary ion yield and reduced damage cross section has permitted the investigation of molecular ions with larger molecular weights (e.g., m/z 1-3,000 Da); thus covering a broad range of chemical classes of biological importance [35-42]. Colliver et al. studied the distribution of organics in a single Paramecium multimicronucleatum cell using time of flight secondary ion mass spectrometry in imaging mode (MSI-TOF-SIMS) [43]. Gazy et al. mapped the spatial distribution of native chemical species in cancer cells using TOF-SIMS [44]. Berman et al. characterized the chemical change at the single cell level and proposed a robust protocol for single cell MSI-TOF-SIMS [45]. More recently, with the introduction of “soft” sputtering beams for biological analysis (or low damage cross section), the generation of 3D maps with high spatial resolution has been achieved. For example, Fletcher et al. reported the first 3D biomolecular TOF-SIMS imaging of a single cell using single beam depth profiling [46]. Kulp et al. demonstrated the potential of TOF-SIMS combined with principal components analysis to distinguish chemical differences in three closely related human breast cancer cell lines [47]. In 2013, the Ewing and Winograd groups showed the potential of TOF-IMS for frozen hydrated cells after ammonium formate washing [48]. Ide et al. showed that changes in lipid composition on breast cancer cell lines can be studied using TOF-SIMS [49]. Gostek et al. showed that single bladder cancer cells can be distinguished using TOF-SIMS data and principal component analysis [50]. A recent 3D-MSI-TOF-SIMS study by Passarelli et al. using dual beam analysis and depth profiling described drug and metabolite uptake at the single cell level [51].
While progress has been made over the years [52-55], there is a lack of suitable methods to measure chemical distributions within intact cells and need to further evaluate the 3D-MSI-TOF-SIMS for the identification, localization and quantification of molecular components at the cellular and subcellular level. For example, it has been reported that dose-response dynamics during therapeutic treatments can be hindered by the pharmacokinetics of the drug on the process of reaching the target site; that is, there is a need to better evaluate the cellular uptake for specific and non-specific accumulation at the cellular level in order to optimize the therapeutic response by reducing the drug loading as a way to mitigate unwanted secondary effects and toxicity levels.[56]
In the present work, the potential of 3D-MSI-TOF-SIMS for the analysis of chemotherapeutic drug delivery at the single cell was studied. In particular, the sample preparation protocols, TOF-SIMS mode of operation using dual beam analysis and depth profiling, and data processing were studied for the case of A-172 human glioblastoma cell line and the drug uptake of BH3-only mimetic ABT-737. To account for the biological cell diversity, a simplified protocol is proposed for semi-quantitative evaluation based on the spatial distribution of endogenous molecular markers (e.g., nuclei and cytoplasm) and secondary ion confirmation based on the ratio of drug-specific fragments to molecular ion as a function of the therapeutic dosage.
Experimental section
Cell Culture
Human glioblastoma cell line A-172 (CRL-1620; American Type Tissue Culture, Manassas, VA) were cultured in Dulbecco’s Modified Eagle Medium (DMEM) supplemented with 10 % fetal bovine serum, 100 μM·mL−1 penicillin, 10 μg·mL−1 streptomycin, and 5 μg·mL−1 plasmocin (Invivogen, San Diego, CA). Cells were grown to 60 % confluency under standard cell culture conditions (37 °C, 5 % CO2, and humidity) on 1 cm2 gold-coated Si wafer chips (Au/Si) or conductive glass slides (ITO/glass). Cells were treated with increasing concentrations of BH3-only mimetic ABT-737 (Santa Cruz Biotechnology, Dallas, TX) for four (4) hours before processing. Stock solutions of ABT-737 (0 μM; 25 μM; 50 μM; 100 μM and 200 μM) were prepared in dimethyl sulfoxide (DMSO). All experiments consisted of at least three technical replicates, and each study contained at least three biological replicates.
Freeze Drying Procedure
The Au/Si and ITO/glass substrates were removed from the media and washed with 10 mM ammonium acetate solution. Excess liquid was removed, and the cells were flash frozen and freeze-dried using a custom-built vacuum drier equipped with a cold finger for 4 h. Samples were slowly warmed up to the room temperature and transfer into the TOF-SIMS analysis vacuum chamber. The freeze-drying protocol has been adapted from the procedure described in reference [48], and cell integrity is confirmed by looking at endogenous cell marker distributions.
3D-MSI-TOF-SIMS analysis
Mass spectrometry imaging experiments were performed utilizing a TOF SIMS5 instrument (ION-TOF, Münster, Germany) retrofitted with a liquid metal ion gun analytical beam for high spatial resolution (25 keV Bi3+), an Argon cluster ion beam (20 keV with a distribution centered at Ar1500+) for “soft” sputtering, and an electron flood gun to reduce surface charging during mass spectrometry analysis. The TOF-SIMS instrument was operated in spectral (“high current bunched”, HCBU) and imaging (“burst alignment”, BA) modes as described previously.[57-59] The tradeoff between the two modes is the mass resolving power, spatial resolution, and secondary ion collection efficiency. In HCBU and BA modes, after a primary ion pulse hits the target surface, desorbed secondary ions are accelerated into the time of flight region equipped with a single-stage reflectron. The secondary ion detector is composed of a micro-channel plate, a scintillator, and a photomultiplier (see detail in reference 58) with a good efficiency for low mass ions (m/z < 2,000) [60]. The start of the time of flight measurement is defined by the primary ion pulse (~10 kHz). In spectral HCBU mode, mass spectra were collected in positive and negative mode with a typical spatial resolution of 1.2 μm, a mass resolving power of m/Δm ~10,000 at m/z 400 and total ion dose ~5 × 10¹² ion cm−2. The imaging BA mode provides a higher spatial resolution (~250 nm measured) and nominal mass resolution (m/Δm ~400 at m/z 400) and spectra were collected with a typical total ion doses of ~5 × 10¹² ions cm−2. Currents of 0.24 pA and 0.078 pA were measured for HCBU and BA mode, respectively. Mass spectrometry images were collected after each sputtering cycle (500 μm × 500 μm) in HCBU and BA modes with a pixel size of 1.17 μm and 200 nm, respectively. A current of ~2 nA was measured for the 20 keV Ar1500+ sputtering beam. A typical sputtering cycle of 20 s (1014 ions·cm−2) was used to clean the cell surface and to access the intracellular material. All experiments were performed in triplicate cells over a field of view of 200 μm× 200 μm.
Data Processing
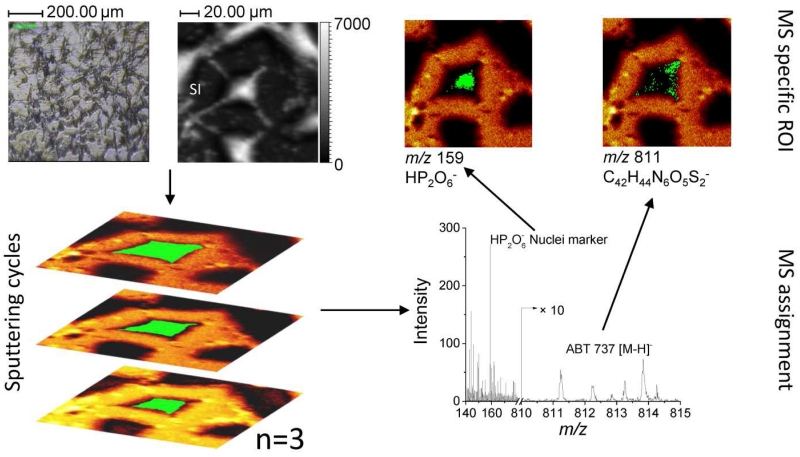
2D TOF-SIMS data was processed using SurfaceLab 6 software (ION-TOF, Münster, Germany). Positive and negative ion spectra were internally calibrated using C+; CH+; CH2+; CH3+; C2H3+; C2H5+ and C−; CH−; CH2−; C2−; C3−; C4H− species, respectively. Regions of Interest (ROIs) were selected based on the distribution of known endogenous ions (e.g., substrate, cell, and nuclei) and extracted spectra were used for secondary ion yield calculations. The image processing workflow is described in Figure 1. Briefly, 2D-TOF-SIMS maps were collected after a sputtering cycle making fresh intracellular material accessible for analysis. The ROI of the cells were determine based on the characteristic ions from the substrate (e.g., Aun+ for Au/Si substrate) and a total ROIcell mass spectrum was generated with the sum signal of all pixels within the ROIcell. Notice that this procedure eliminates background signal and chemical noise from extracellular areas. Mass assignments for familiar cellular components (e.g., nuclei fragments and fatty acids) and drug characteristic fragment and intact molecular ions were used to generate intracellular ROI (see an example for ROInuclei and ROIdrug in Figure 1). For comparative purposes, the secondary ion yield (YSI) was defined based on the number of secondary ion per primary ions in the ROI of the cell as:
| (1) |
Figure 1.
Proposed workflow for the analysis of chemotherapeutic drugs inside the single cells utilizing 3D-MSI-TOF-SIMS.
The distribution of a secondary ion x across each cell can be normalized to the accessible cell surface as a function of the sputtering cycle by the % coverage:
| (2) |
Notice that the % coverage can be used as an estimation of the intracellular morphology accessible to the TOF-SIMS analysis (top few nanometers). For example, the accessible nuclei surface exposed as a function of the sputtering cycle can be monitored by the distribution of endogenous nuclei-specific secondary ion. This information can be used to estimate the intracellular morphology accessible as a function of the sputtering cycle.
Results and Discussion
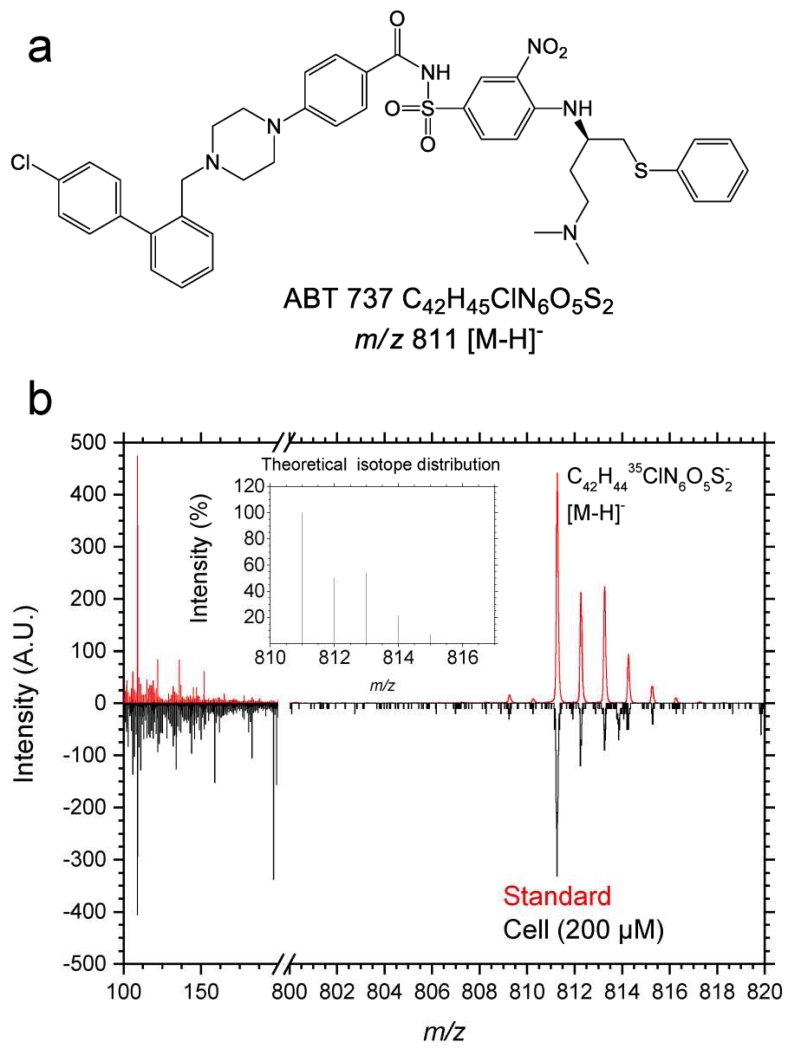
Triplicate cell analyses were performed using HBCU mode for high mass resolution and to evaluate the secondary ion emission as a function of the ABT-737 concentration. The analysis of ABT-737 in the standard and inside the cell showed the presence of characteristic fragment and intact molecular ions. In positive mode, inspection of the mass spectrum showed the presence of one main fragment ion at m/z 165 and the protonated molecular ion [C42H44ClN6O5S2]+ [M-H]+. In negative mode, the mass spectrum showed abundant fragment ions at m/z 46 NO2−; m/z 109.01 C6H5S−; m/z 554.16 C26H28N5O5S2− and m/z 777.26 C42H45N6O5S2− [M-Cl]− and the intact deprotonated molecular ion m/z 811.25, C42H44ClN6O5S2− [M-H]− (see Figure 2 and Table 1). Notice that in all cases a low mass error (<35 ppm) was observed in the identification of the chemical species from the surface of interest. The unique isotopic pattern of ABT-737 facilitated the identification of the molecular ion from the ROIcell summed spectra, and the chemical formula of the proposed fragmentation channels permitted the generation of chemical ion maps summing all ABT-737 related secondary ions to increase the chemical map contrast (see more details on the proposed fragmentation channels in Figure S1). Notice that when the analysis is made from the summed TOF-SIMS spectra from the ROIcell after sputtering cycles, potential m/z interferences from the outside the cell and from residual growth media are typically avoided.
Figure 2.
ABT-737 chemical structure (a) and comparison of TOF-SIMS spectra in negative polarity (b) of the ABT-737 and the standard deposited on a gold substrate and of the ROIcell after cell treatment with 200 μM ABT-737. In the inset, the theoretical isotopic pattern of the ABT-737 deprotonated molecular ion [M-H]− is shown.
Table 1.
Characteristic secondary ions observed for ABT-737 standard and for ABT-737 in the cells in HBCU mode. Less than < 35 ppm mass error was observed compared to the theoretical chemical formulas in the high mass region (m/z 500-900).
| Polarity | Formula | Standard | Cells |
|---|---|---|---|
| Positive | C42H4435ClN6O5S2+ | 811.22 | - |
| Positive | C42H4437ClN6O5S2+ | 813.22 | - |
| Negative | NO2− | 46.00 | 45.99 |
| Negative | C6H5S− | 109.01 | 109.01 |
| Negative | C26H28N5O5S2− | 554.16 | 554.17 |
| Negative | C42H45N6O5S2− | 777.26 | - |
| Negative | C42H4435ClN6O5S2− | 811.25 | 811.26 |
| Negative | C42H4437ClN6O5S2− | 813.24 | 813.25 |
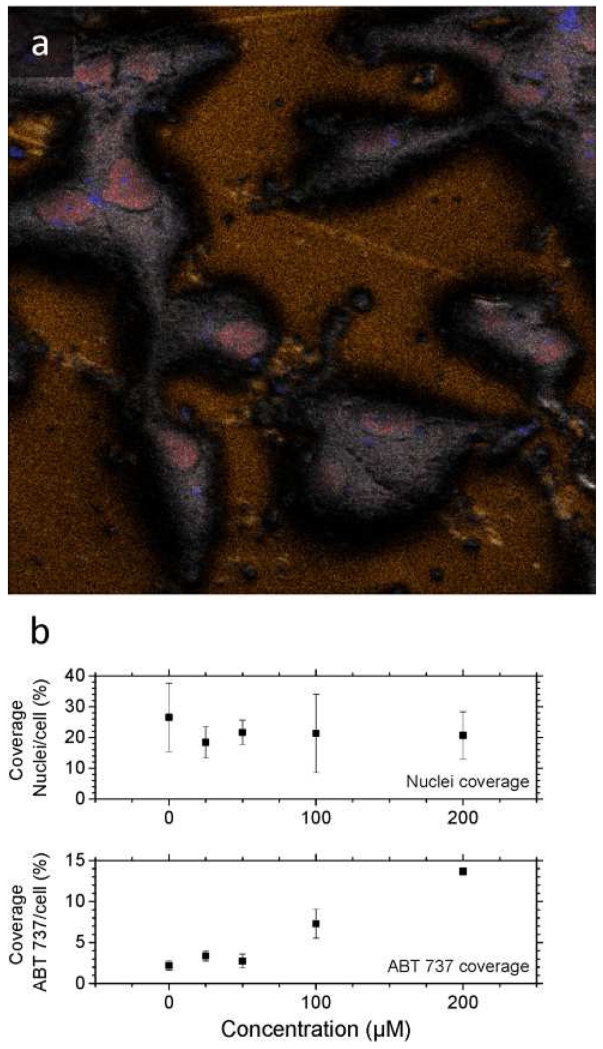
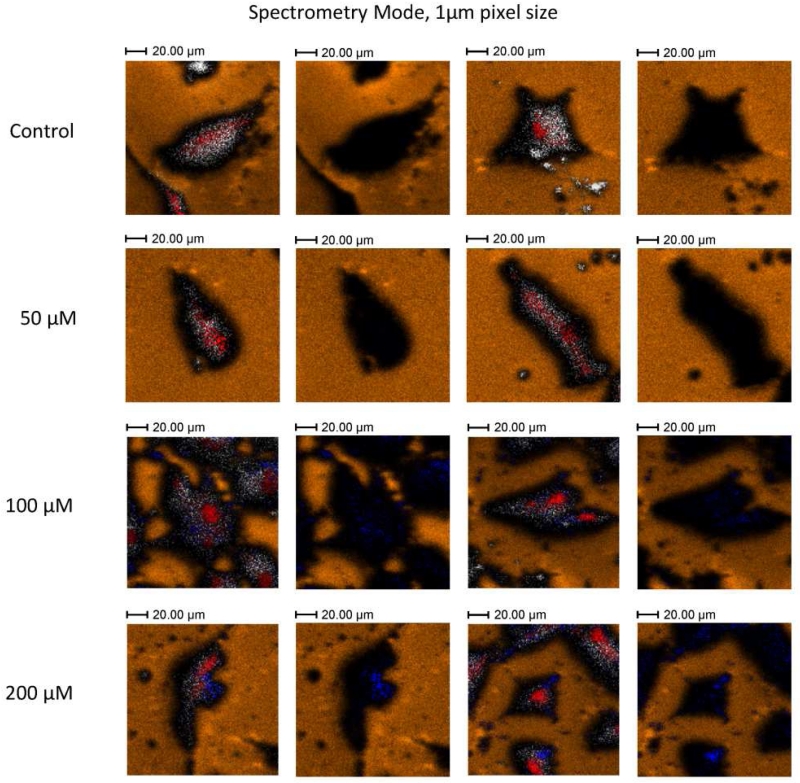
The analysis in BA mode for higher spatial resolution resulted in a clear differentiation of the cells morphology and intracellular components (see example in Figure 3). It should be noted that different from the HBCU mode, the deprotonated molecular ion of ABT-737 was not observed in BA mode. Instead, the ABT-737 distribution was mapped in BA mode using specific fragment ions at m/z 45.9 NO2− and at m/z 109.0 C6H5S−. In HBCU mode, a clear contrast was observed between the cells and the substrate (using gold peaks as the signature of the substrate); this allowed the generation of the ROIcell (see Figure 4). Closer inspection showed that the nuclei (m/z 158.93 HP2O6− in red) and intracellular components (m/z 255.24 C16H31O2− [C16:0-H]− in gray) are also clearly defined for all cells; thus allowing the generation of the ROInuclei. The observation of the intact deprotonated molecular ion m/z 811.26 [M-H]− of ABT-737 was used for the generation of the ROIABT-737 to estimate the ABT-737 coverage. A measurement of the total drug uptake at the single cell level would require the acquisition of a full 3D-TOF-SIMS dataset. Due to the biological cell diversity (e.g., see variation in cell morphology in Figure 4), some replicates are required as a function of the drug concentration which makes this approach time consuming and almost unpractical for routine applications. An alternative way is to use a semi-quantitative approach by discrete sampling of a larger number of cells as a function of the sputtering cycle and to use intracellular endogenous markers as references for the accessible cell surface in each 2D-TOF-SIMS analysis. That is, a discrete number of 2D-TOF-SIMS maps across multiple cells allows for a faster sampling of the drug uptake over a larger cell population. For example, our analysis (n = 15) showed a narrow distribution (~25 ± 20 %) between the accessible surface of the nuclei with respect to the accessible surface of the cells when cells are interrogated after the same number of sputtering cycles (see nuclei coverage per cell in Figure 3). Moreover, the ABT-737 coverage increases with the drug concentration with small variability across multiple cells under the same treatment conditions. Previous reports have shown that ABT-737 targets Bcl-2 proteins on mitochondrial membranes [61, 62]. While the current BA and HBCU analysis does not provide the spatial resolution to effectively localize the mitochondria inside the cells closer inspection of Figures 3 and 4 shows that most of the ABT-737 signal is localized outside the nuclei (see more details in Figure S2).
Figure 3.
a) Typical 2D-TOF-SIMS negative ion chemical maps of A-172 cells treated with 200μM ABT-737 analyzed in BA mode. In the image, secondary ion signals from m/z 158.9 HP2O6− in red, sum of fatty acids (m/z 255.2 [C16:0-H]−, m/z 281.2 [C18:1-H]−, m/z 283.2 [C18:0-H]−) in grey, m/z 590.85 Au3− in orange and characteristic fragment ions of ABT 737 (m/z 46.9 NO2− m/z 109.1 C6H5S−) in blue are shown. Image size 200 μm × 200 μm, 1024 pixels × 1024 pixels, image recorded 200 nm with oversampling, experimentally measured spatial resolution 250 nm. b) Percent coverage of nuclei and of ABT-737 relative to the cell surface obtained from the HBCU analysis. Notice the relative narrow distribution of the nuclei coverage and the increasing distribution of ABT 737 with the treatment concentration.
Figure 4.
Typical 2D-TOF-SIMS chemical maps of A-172 cells as a function of the ABT-747 treatment concentration obtained in HBCU mode. Images correspond to a FOV 150 μm × 150 μm with 128 × 128 pixels (~1.2 μm spatial resolution). In the images, secondary ion signals from m/z 158.9 HP2O6− in red, sum of fatty acids (m/z 255.2 [C16:0-H]−, m/z 281.2 [C18:1-H]−, m/z 283.2 [C18:0-H]−) in grey, m/z 590.85 Au3− in orange and ABT-737 molecular ion (m/z 811.26 C42H44ClN6O5S2− [M-H]−) in blue are shown. A duplicate overlay of each image is shown to the right, where the cell and nuclei components were suppressed to facilitate the visualization of ABT-737.
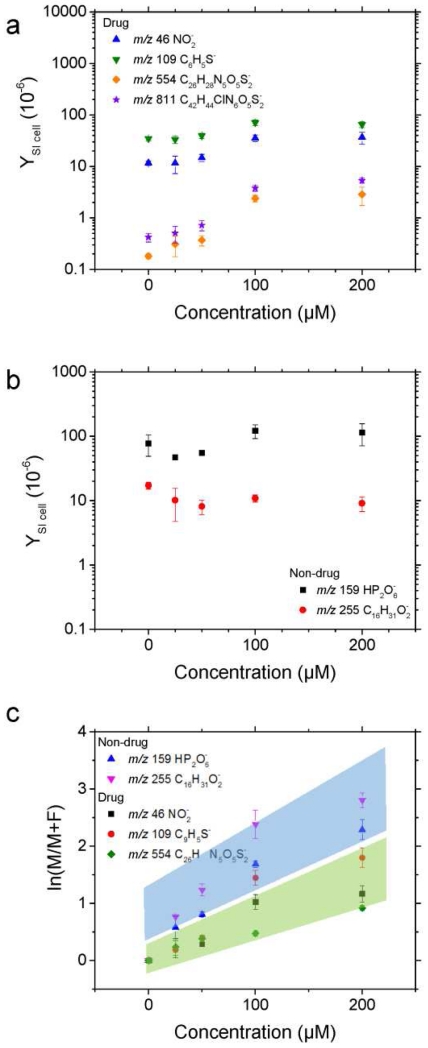
Inspection of the secondary ion yield of the intact deprotonated molecular ion of ABT-737 showed an increase with the drug concentration at the cell level (see Figure 5a). Notice that for the case of ABT-737 fragment ions, although an increase is also observed other competing signals contribute to the secondary ion yield observed in the control samples with no drug treatment. As a negative control, the analysis of non-drug related endogenous secondary ions (e.g., m/z 158.93 HP2O6− and m/z 255.24 C16H31O2− [C16:0-H]−) showed no correlation with the drug concentration during treatments. Moreover, a distinction can be made between specific and non - specific ABT-737 fragment ions by correlating their secondary ion signal with that of the ABT-737 molecular ion as a function of the drug treatment (Figure 5c). That is, while the cell biological complexity may require higher mass resolution to unambiguously identify ABT-737 specific secondary ions, non-drug and drug-related fragment ions will show different correlations with the drug molecular ion SI yield. For example, closer inspection of the ratio of parent to fragment ion SI yields shows that m/z 46 NO2−; m/z 109.01 C6H5S−; m/z 554.16 C26H28N5O5S2− are ABT-737 related fragments while m/z 158.93 HP2O6− and m/z 255.24 C16H31O2− are not. That is, the correlation between the secondary ion yield of the drug fragment and drug parent molecular ions as a function of the therapeutic treatment can be used as a confirmation of the presence of potential interferences in the mass channels utilized to generate the drug specific chemical maps. While this uncertainty may be overcome with ultrahigh resolution mass analyzers [39, 63] and MS/MS [46, 64] approaches, TOF-SIMS provides high sensitivity and shorter analysis times when 3D-MSI analyses are required. These results provide proof-of-concept validation that the chemotherapeutic drug delivery can be evaluated at the single cell level using label-free, 3D-MSI-TOF-SIMS with high spatial resolution.
Figure 5.
Secondary ion yields (YSI) for drug specific (a) and non-drug specific (b) ions as a function of the A-172 cell treatment with ABT-737. c) Dependence of the ratio of molecular (M) to fragment (F) ions with the ABT-737 concentration as an alternative control for drug and non-drug specific fragment ions. Assignments are: m/z 46 NO2−, m/z 109 C6H5S−, m/z 554 C26H28N5O5S2−, m/z 158.9 HP2O6−, m/z 255 [C16:0-H]−, and m/z 811 C42H44ClN6O5S2−.
The observation of the chemotherapeutic drug molecular ion inside the cell using cluster ion sources at high spatial resolution shows promise on the sensitivity and reduced matrix effects of TOF-SIMS technology. Moreover, further development of our understanding of the primary ion beam interaction with the cell surface and the desorption of intact secondary ions will permit a better generation of quantitative protocols and strategies with wide applications in pharmacologic and therapeutic research based on TOF-SIMS technology.
Conclusions
The potential of label-free 3D-MSI-TOF-SIMS using dual beam analysis (25 keV Bi3+) and depth profiling (20 keV with a distribution centered at Ar1500+) was evaluated in A-172 human glioblastoma cell line treated with BH3-only mimetic ABT-737. The high spatial (< 250 nm) and high mass resolution (m/Δm ~ 10000) of TOF-SIMS permitted the localization and identification of the intact, unlabeled drug molecular ion (m/z 811.26 C42H44ClN6O5S2− [M-H]−) as well as characteristic fragment ions (m/z 46 NO2−; m/z 109.01 C6H5S−; m/z 554.16 C26H28N5O5S2−) in BA and HBCU mode, respectively. Inspection of the ABT-737 secondary ion yield and percent coverage showed a good correlation with the drug concentration during cell treatment at therapeutic dosages (0–200 μM with four-hour incubation). Chemical maps using endogenous molecular markers (e.g., m/z 158.93 HP2O6− and m/z 255.24 C16H31O2− for the nuclei and the cytoplasm) showed that the ABT-737 is mainly localized in subsurface regions and absent in the nucleus. Chemical maps of endogenous biomolecules showed that the utilized sample preparation protocol and freeze drying procedure preserves the molecular and spatial integrity at the cellular level. While a full tridimensional characterization of multiple single cells is unpractical, as an alternative we propose for the first time a semi-quantitative workflow that allows for fast characterization and the possibility to interrogate a larger number of single cells while accounting for the biological cell diversity.
Supplementary Material
Acknowledgements
This work was supported by a NIGMS grant GM106414 to FF-L.
Footnotes
Figure S 1: Typical TOF-SIMS negative mode spectra in HBCU mode of A-172 cells treated with 200 μM of ABT-737 on a gold substrate. In the inset, proposed fragmentation channels are shown. Figure S 2: Typical 2D-TOF-SIMS negative ion chemical maps of A-172 cells obtained in BU mode. Image size 100 μm × 100 μm, 512 × 512 pixels.
The authors declare no competing financial interest.
References
- 1.Masujima T. Live Single-cell Mass Spectrometry. Anal. Sci. 2009;25:953–960. doi: 10.2116/analsci.25.953. [DOI] [PubMed] [Google Scholar]
- 2.Fujii T, Matsuda S, Tejedor ML, Esaki T, Sakane I, Mizuno H, Tsuyama N, Masujima T. Direct metabolomics for plant cells by live single-cell mass spectrometry. Nat. Protocols. 2015;10:1445–1456. doi: 10.1038/nprot.2015.084. [DOI] [PubMed] [Google Scholar]
- 3.Esaki T, Masujima T. Fluorescence Probing Live Single-cell Mass Spectrometry for Direct Analysis of Organelle Metabolism. Anal. Sci. 2015;31:1211–1213. doi: 10.2116/analsci.31.1211. [DOI] [PubMed] [Google Scholar]
- 4.Mellors JS, Jorabchi K, Smith LM, Ramsey JM. Integrated Microfluidic Device for Automated Single Cell Analysis Using Electrophoretic Separation and Electrospray Ionization Mass Spectrometry. Anal. Chem. 2010;82:967–973. doi: 10.1021/ac902218y. [DOI] [PMC free article] [PubMed] [Google Scholar]
- 5.Hofstadler SA, Swanek FD, Gale DC, Ewing AG, Smith RD. Capillary Electrophoresis-Electrospray Ionization Fourier Transform Ion Cyclotron Resonance Mass Spectrometry for Direct Analysis of Cellular Proteins. Anal. Chem. 1995;67:1477–1480. doi: 10.1021/ac00104a028. [DOI] [PubMed] [Google Scholar]
- 6.Hofstadler SA, Severs JC, Smith RD, Swanek FD, Ewing AG. Analysis of Single Cells with Capillary Electrophoresis Electrospray Ionization Fourier Transform Ion Cycloton Resonance Mass Spectrometry. Rapid Comm. Mass Spectrom. 1996;10:919–922. doi: 10.1002/(SICI)1097-0231(19960610)10:8<919::AID-RCM597>3.0.CO;2-8. [DOI] [PubMed] [Google Scholar]
- 7.Chen F, Lin L, Zhang J, He Z, Uchiyama K, Lin J-M. Single-Cell Analysis Using Drop-on-Demand Inkjet Printing and Probe Electrospray Ionization Mass Spectrometry. Anal. Chem. 2016;88:4354–4360. doi: 10.1021/acs.analchem.5b04749. [DOI] [PubMed] [Google Scholar]
- 8.Caprioli RM. Imaging Mass Spectrometry: Enabling a New Age of Discovery in Biology and Medicine Through Molecular Microscopy. J. Am. Soc. Mass Spectrom. 2015 doi: 10.1007/s13361-015-1108-z. [DOI] [PMC free article] [PubMed] [Google Scholar]
- 9.Bodzon-Kulakowska A, Suder P. Imaging mass spectrometry: Instrumentation, applications, and combination with other visualization techniques. Mass Spectrom. Rev. 2016;35:147–169. doi: 10.1002/mas.21468. [DOI] [PubMed] [Google Scholar]
- 10.Winograd N. Imaging mass spectrometry on the nanoscale with cluster ion beams. Anal. Chem. 2015;87:328–333. doi: 10.1021/ac503650p. [DOI] [PMC free article] [PubMed] [Google Scholar]
- 11.Spengler B. Mass Spectrometry Imaging of Biomolecular Information. Anal. Chem. 2015;87:64–82. doi: 10.1021/ac504543v. [DOI] [PubMed] [Google Scholar]
- 12.Nilsson A, Goodwin RJA, Shariatgorji M, Vallianatou T, Webborn PJH, Andrén PE. Mass Spectrometry Imaging in Drug Development. Anal. Chem. 2015;87:1437–1455. doi: 10.1021/ac504734s. [DOI] [PubMed] [Google Scholar]
- 13.Pacholski ML, Winograd N. Imaging with Mass Spectrometry. Chem. Rev. 1999;99:2977–3005. doi: 10.1021/cr980137w. [DOI] [PubMed] [Google Scholar]
- 14.Yang Y-L, Xu Y, Straight P, Dorrestein PC. Translating metabolic exchange with imaging mass spectrometry. Nat. Chem. Biol. 2009;5:885–887. doi: 10.1038/nchembio.252. [DOI] [PMC free article] [PubMed] [Google Scholar]
- 15.Liu W-T, Kersten RD, Yang Y-L, Moore BS, Dorrestein PC. Imaging Mass Spectrometry and Genome Mining via Short Sequence Tagging Identified the Anti-Infective Agent Arylomycin in Streptomyces roseosporus. J. Am. Chem. Soc. 2011;133:18010–18013. doi: 10.1021/ja2040877. [DOI] [PMC free article] [PubMed] [Google Scholar]
- 16.Gonzalez DJ, Xu Y, Yang Y-L, Esquenazi E, Liu W-T, Edlund A, Duong T, Du L, Molnár I, Gerwick WH, Jensen PR, Fischbach M, Liaw C-C, Straight P, Nizet V, Dorrestein PC. Observing the invisible through imaging mass spectrometry, a window into the metabolic exchange patterns of microbes. J. Proteom. 2012;75:5069–5076. doi: 10.1016/j.jprot.2012.05.036. [DOI] [PMC free article] [PubMed] [Google Scholar]
- 17.Barger SR, Hoefler BC, Cubillos-Ruiz A, Russell WK, Russell DH, Straight PD. Imaging secondary metabolism of Streptomyces sp. Mg1 during cellular lysis and colony degradation of competing Bacillus subtilis. Antonie van Leeuwenhoek. 2012;102:435–445. doi: 10.1007/s10482-012-9769-0. [DOI] [PubMed] [Google Scholar]
- 18.Liu W-T, Yang Y-L, Xu Y, Lamsa A, Haste NM, Yang JY, Ng J, Gonzalez D, Ellermeier CD, Straight PD, Pevzner PA, Pogliano J, Nizet V, Pogliano K, Dorrestein PC. Imaging mass spectrometry of intraspecies metabolic exchange revealed the cannibalistic factors of Bacillus subtilis. Proc. Natl. Acad. Sci. 2010;107:16286–16290. doi: 10.1073/pnas.1008368107. [DOI] [PMC free article] [PubMed] [Google Scholar]
- 19.Hoefler BC, Gorzelnik KV, Yang JY, Hendricks N, Dorrestein PC, Straight PD. Enzymatic resistance to the lipopeptide surfactin as identified through imaging mass spectrometry of bacterial competition. Proc. Natl. Acad. Sci. 2012;109:13082–13087. doi: 10.1073/pnas.1205586109. [DOI] [PMC free article] [PubMed] [Google Scholar]
- 20.Moree WJ, Phelan VV, Wu C-H, Bandeira N, Cornett DS, Duggan BM, Dorrestein PC. Interkingdom metabolic transformations captured by microbial imaging mass spectrometry. Proc. Natl. Acad. Sci. 2012;109:13811–13816. doi: 10.1073/pnas.1206855109. [DOI] [PMC free article] [PubMed] [Google Scholar]
- 21.Debois D, Ongena M, Cawoy H, De Pauw E. MALDI-FTICR MS Imaging as a Powerful Tool to Identify Paenibacillus Antibiotics Involved in the Inhibition of Plant Pathogens. Journal of The American Society for Mass Spectrometry. 2013;24:1202–1213. doi: 10.1007/s13361-013-0620-2. [DOI] [PubMed] [Google Scholar]
- 22.Zavalin A, Todd EM, Rawhouser PD, Yang J, Norris JL, Caprioli RM. Direct imaging of single cells and tissue at sub-cellular spatial resolution using transmission geometry MALDI MS. J. Mass Spectrom. 2012;47:1473–1481. doi: 10.1002/jms.3108. [DOI] [PubMed] [Google Scholar]
- 23.Schober Y, Guenther S, Spengler B, Rompp A. Single cell matrix-assisted laser desorption/ionization mass spectrometry imaging. Anal. Chem. 2012;84:6293–6297. doi: 10.1021/ac301337h. [DOI] [PubMed] [Google Scholar]
- 24.Holle A, Haase A, Kayser M, Höhndorf J. Optimizing UV laser focus profiles for improved MALDI performance. J. Mass Spectrom. 2006;41:705–716. doi: 10.1002/jms.1041. [DOI] [PubMed] [Google Scholar]
- 25.Sturtevant D, Lee Y-J, Chapman KD. Matrix assisted laser desorption/ionization-mass spectrometry imaging (MALDI-MSI) for direct visualization of plant metabolites in situ. Curr. Opin. Biotechnol. 2016;37:53–60. doi: 10.1016/j.copbio.2015.10.004. [DOI] [PubMed] [Google Scholar]
- 26.Römpp A, Spengler B. Mass spectrometry imaging with high resolution in mass and space. Histochem. Cell Biol. 2013;139:759–783. doi: 10.1007/s00418-013-1097-6. [DOI] [PMC free article] [PubMed] [Google Scholar]
- 27.Guenther S, Römpp A, Kummer W, Spengler B. AP-MALDI imaging of neuropeptides in mouse pituitary gland with 5 μm spatial resolution and high mass accuracy. Int. J. Mass Spectrom. 2011;305:228–237. [Google Scholar]
- 28.Ogrinc Potočnik N, Porta T, Becker M, Heeren RMA, Ellis SR. Use of advantageous, volatile matrices enabled by next-generation high-speed matrix-assisted laser desorption/ionization time-of-flight imaging employing a scanning laser beam. Rapid Commun. Mass Spectrom. 2015;29:2195–2203. doi: 10.1002/rcm.7379. [DOI] [PubMed] [Google Scholar]
- 29.Spraggins JM, Rizzo DG, Moore JL, Noto MJ, Skaar EP, Caprioli RM. Next-generation technologies for spatial proteomics: Integrating ultra-high speed MALDI-TOF and high mass resolution MALDI FTICR imaging mass spectrometry for protein analysis. Proteomics. 2016;16:1678–1689. doi: 10.1002/pmic.201600003. [DOI] [PMC free article] [PubMed] [Google Scholar]
- 30.Rabbani S, Fletcher JS, Lockyer NP, Vickerman JC. Exploring subcellular imaging on the buncher-ToF J105 3D chemical imager. Surf. Interf. Anal. 2011;43:380–384. [Google Scholar]
- 31.Altelaar AFM, Klinkert I, Jalink K, de Lange RPJ, Adan RAH, Heeren RMA, Piersma SR. Gold-Enhanced Biomolecular Surface Imaging of Cells and Tissue by SIMS and MALDI Mass Spectrometry. Anal. Chem. 2006;78:734–742. doi: 10.1021/ac0513111. [DOI] [PubMed] [Google Scholar]
- 32.Vanbellingen QP, Elie N, Eller MJ, Della-Negra S, Touboul D, Brunelle A. Time-of-flight secondary ion mass spectrometry imaging of biological samples with delayed extraction for high mass and high spatial resolutions. Rapid Comm. Mass Spectrom. 2015;29:1187–1195. doi: 10.1002/rcm.7210. [DOI] [PMC free article] [PubMed] [Google Scholar]
- 33.Slaveykova VI, Guignard C, Eybe T, Migeon H-N, Hoffmann L. Dynamic NanoSIMS ion imaging of unicellular freshwater algae exposed to copper. Anal. Bioanal. Chem. 2009;393:583–589. doi: 10.1007/s00216-008-2486-x. [DOI] [PubMed] [Google Scholar]
- 34.Touboul D, Kollmer F, Niehuis E, Brunelle A, Laprévote O. Improvement of Biological Time-of-Flight-Secondary Ion Mass Spectrometry Imaging with a Bismuth Cluster Ion Source. J. Am. Soc. Mass Spectrom. 2005;16:1608–1618. doi: 10.1016/j.jasms.2005.06.005. [DOI] [PubMed] [Google Scholar]
- 35.Fletcher JS, Lockyer NP, Vaidyanathan S, Vickerman JC. TOF-SIMS 3D Biomolecular Imaging of Xenopus laevis Oocytes Using Buckminsterfullerene (C60) Primary Ions. Anal. Chem. 2007;79:2199–2206. doi: 10.1021/ac061370u. [DOI] [PubMed] [Google Scholar]
- 36.Cheng J, Wucher A, Winograd N. Molecular Depth Profiling with Cluster Beams. The J. Phys. Chem. B. 2006;110:8329–8336. doi: 10.1021/jp0573341. [DOI] [PubMed] [Google Scholar]
- 37.Gillen G, Fakey A, Wagner M, Mahoney C. 3-D Molecules Imaging SIMS. Appl. Surf. Sci. 2006;252:6537–6541. [Google Scholar]
- 38.Breitenstein D, Pommel CE, Moilers R, Wegener J, Hagenhoff B. The Chemical Composition of Animal Cells and Their Intracellular Compartments Reconstructed from 3D Mass Spectrometry. Angew. Chem. lnt. Ed. 2007;46:5332–5335. doi: 10.1002/anie.200604468. [DOI] [PubMed] [Google Scholar]
- 39.DeBord JD, Smith DF, Anderton CR, Heeren RM, Pasa-Tolic L, Gomer RH, Fernandez-Lima FA. Secondary Ion Mass Spectrometry Imaging of Dictyostelium discoideum Aggregation Streams. Plos One. 2014;9:e99319. doi: 10.1371/journal.pone.0099319. [DOI] [PMC free article] [PubMed] [Google Scholar]
- 40.Fernandez-Lima FA, Eller MJ, DeBord JD, Verkhoturov SV, Della-Negra S, Schweikert EA. On the Surface Mapping using Individual Cluster Impacts. Nucl. Instr. Meth. Phys. Res. B. 2012;273:270–273. doi: 10.1016/j.nimb.2011.07.092. [DOI] [PMC free article] [PubMed] [Google Scholar]
- 41.Fernandez-Lima FA, Post J, DeBord JD, Eller MJ, Verkhoturov SV, Della-Negra S, Woods AS, Schweikert EA. Analysis of Native Biological Surfaces Using a 100 kV Massive Gold Cluster Source. Anal. Chem. 2011;83:8448–8453. doi: 10.1021/ac201481r. [DOI] [PMC free article] [PubMed] [Google Scholar]
- 42.Benguerba M, Brunelle A, Della-Negra S, Depauw J, Joret H, Le Beyec Y, Blain MG, Schweikert EA, Assayag GB, Sudraud P. Impact of slow gold clusters on various solids: nonlinear effects in secondary ion emission. Nucl. Instr. Meth. Phys. Res. B. 1991;62:8–22. [Google Scholar]
- 43.Colliver TL, Brummel CL, Pacholski ML, Swanek FD, Ewing AG, Winograd N. Atomic and Molecular Imaging at the Single-Cell Level with TOF-SIMS. Anal. Chem. 1997;69:2225–2231. doi: 10.1021/ac9701748. [DOI] [PubMed] [Google Scholar]
- 44.Gazi E, Dwyer J, Lockyer N, Gardner P, Vickerman JC, Miyan J, Hart CA, Brown M, Shanks JH, Clarke N. The combined application of FTIR microspectroscopy and ToF-SIMS imaging in the study of prostate cancer. Farad. Discuss. 2004;126:41–59. doi: 10.1039/b304883g. [DOI] [PubMed] [Google Scholar]
- 45.Berman ESF, Fortson SL, Checchi KD, Wu L, Felton JS, Wu KJJ, Kulp KS. Preparation of Single Cells for Imaging/Profiling Mass Spectrometry. J. Am. Soc. Mass Spectrom. 2008;19:1230–1236. doi: 10.1016/j.jasms.2008.05.006. [DOI] [PubMed] [Google Scholar]
- 46.Fletcher JS, Rabbani S, Henderson A, Blenkinsopp P, Thompson SP, Lockyer NP, Vickerman JC. A New Dynamic in Mass Spectral Imaging of Single Biological Cells. Anal. Chem. 2008;80:9058–9064. doi: 10.1021/ac8015278. [DOI] [PubMed] [Google Scholar]
- 47.Kulp KS, Berman ESF, Knize MG, Shattuck DL, Nelson EJ, Wu L, Montgomery JL, Felton JS, Wu KJ. Chemical and Biological Differentiation of Three Human Breast Cancer Cell Types Using Time-of-Flight Secondary Ion Mass Spectrometry. Anal. Chem. 2006;78:3651–3658. doi: 10.1021/ac060054c. [DOI] [PubMed] [Google Scholar]
- 48.Piwowar AM, Keskin S, Delgado MO, Shen K, Hue JJ, Lanekoff I, Ewing AG, Winograd N. C60-ToF SIMS imaging of frozen hydrated HeLa cells. Surf. Interf. Anal. 2013;45:302–304. doi: 10.1002/sia.4882. [DOI] [PMC free article] [PubMed] [Google Scholar]
- 49.Ide Y, Waki M, Ishizaki I, Nagata Y, Yamazaki F, Hayasaka T, Masaki N, Ikegami K, Kondo T, Shibata K, Ogura H, Sanada N, Setou M. Single cell lipidomics of SKBR - 3 breast cancer cells by using time - of - flight secondary - ion mass spectrometry. Surf. Interf. Anal. 2014;46:181–184. [Google Scholar]
- 50.Gostek J, Awsiuk K, Pabijan J, Rysz J, Budkowski A, Lekka M. Differentiation between Single Bladder Cancer Cells Using Principal Component Analysis of Time-of-Flight Secondary Ion Mass Spectrometry. Anal. Chem. 2015;87:3195–3201. doi: 10.1021/ac504684n. [DOI] [PubMed] [Google Scholar]
- 51.Passarelli MK, Newman CF, Marshall PS, West A, Gilmore IS, Bunch J, Alexander MR, Dollery CT. Single-Cell Analysis: Visualizing Pharmaceutical and Metabolite Uptake in Cells with Label-Free 3D Mass Spectrometry Imaging. Anal. Chem. 2015;87:6696–6702. doi: 10.1021/acs.analchem.5b00842. [DOI] [PubMed] [Google Scholar]
- 52.Gilmore IS, Seah MP, Green FM. Static TOF-SIMS — a VAMAS interlaboratory study. Part I. Repeatability and reproducibility of spectra. Surf. Interf. Anal. 2005;37:651–672. [Google Scholar]
- 53.Green FM, Gilmore IS, Lee JLS, Spencer SJ, Seah MP. Static SIMS–VAMAS interlaboratory study for intensity repeatability, mass scale accuracy and relative quantification. Surf. Interf. Anal. 2010;42:129–138. [Google Scholar]
- 54.Bich C, Touboul D, Brunelle A. Study of experimental variability in TOF-SIMS mass spectrometry imaging of biological samples. Int. J. Mass Spectrom. 2013;337:43–49. [Google Scholar]
- 55.Kadar H, Pham H, Touboul D, Brunelle A, Baud O. Impact of inhaled nitric oxide on the sulfatide profile of neonatal rat brain studied by TOF-SIMS imaging. Int. J Mol. Sci. 2014;15:5233–5245. doi: 10.3390/ijms15045233. [DOI] [PMC free article] [PubMed] [Google Scholar]
- 56.Dollery CT. Intracellular drug concentrations. Clin. Pharmacol. Ther. 2013;93:263–266. doi: 10.1038/clpt.2012.240. [DOI] [PubMed] [Google Scholar]
- 57.Sodhi RN. Time-of-flight secondary ion mass spectrometry (TOF-SIMS):--versatility in chemical and imaging surface analysis. Analyst. 2004;129:483–487. doi: 10.1039/b402607c. [DOI] [PubMed] [Google Scholar]
- 58.Touboul D, Kollmer F, Niehuis E, Brunelle A, Laprévote O. Improvement of biological time-of-flight-secondary ion mass spectrometry imaging with a bismuth cluster ion source. J. Am. Soc. Mass Spectrom. 2005;16:1608–1618. doi: 10.1016/j.jasms.2005.06.005. [DOI] [PubMed] [Google Scholar]
- 59.Brunelle A, Touboul D, Laprévote O. Biological tissue imaging with time-of-flight secondary ion mass spectrometry and cluster ion sources. J. Mass Spectrom. 2005;40:985–999. doi: 10.1002/jms.902. [DOI] [PubMed] [Google Scholar]
- 60.Gilmore IS, Seah MP. Ion detection efficiency in SIMS:: Dependencies on energy, mass and composition for microchannel plates used in mass spectrometry. Int. J. Mass Spectrom. 2000;202:217–229. [Google Scholar]
- 61.Konopleva M, Contractor R, Tsao T, Samudio I, Ruvolo PP, Kitada S, Deng X, Zhai D, Shi Y-X, Sneed T, Verhaegen M, Soengas M, Ruvolo VR, McQueen T, Schober WD, Watt JC, Jiffar T, Ling X, Marini FC, Harris D, Dietrich M, Estrov Z, McCubrey J, May WS, Reed JC, Andreeff M. Mechanisms of apoptosis sensitivity and resistance to the BH3 mimetic ABT-737 in acute myeloid leukemia. Cancer Cell. 2006;10:375–388. doi: 10.1016/j.ccr.2006.10.006. [DOI] [PubMed] [Google Scholar]
- 62.Kang MH, Reynolds CP. Bcl-2 Inhibitors: Targeting Mitochondrial Apoptotic Pathways in Cancer Therapy. Clin. Cancer Res. 2009;15:1126–1132. doi: 10.1158/1078-0432.CCR-08-0144. [DOI] [PMC free article] [PubMed] [Google Scholar]
- 63.Smith D, Kiss A, Leach F, III, Robinson E, Paša-Tolić L, Heeren RA. High mass accuracy and high mass resolving power FT-ICR secondary ion mass spectrometry for biological tissue imaging. Anal. Bioanal. Chem. 2013;405:6069–6076. doi: 10.1007/s00216-013-7048-1. [DOI] [PubMed] [Google Scholar]
- 64.Fisher GL, Bruinen AL, Ogrinc Potočnik N, Hammond JS, Bryan SR, Larson PE, Heeren RMA. A New Method and Mass Spectrometer Design for TOF-SIMS Parallel Imaging MS/MS. Anal. Chem. 2016;88:6433–6440. doi: 10.1021/acs.analchem.6b01022. [DOI] [PubMed] [Google Scholar]
Associated Data
This section collects any data citations, data availability statements, or supplementary materials included in this article.


