

Abstract
Key points
High dietary potassium (K+) intake dephosphorylates and inactivates the NaCl cotransporter (NCC) in the renal distal convoluted tubule (DCT).
Using several ex vivo models, we show that physiological changes in extracellular K+, similar to those occurring after a K+ rich diet, are sufficient to promote a very rapid dephosphorylation of NCC in native DCT cells.
Although the increase of NCC phosphorylation upon decreased extracellular K+ appears to depend on cellular Cl− fluxes, the rapid NCC dephosphorylation in response to increased extracellular K+ is not Cl−‐dependent.
The Cl−‐dependent pathway involves the SPAK/OSR1 kinases, whereas the Cl− independent pathway may include additional signalling cascades.
Abstract
A high dietary potassium (K+) intake causes a rapid dephosphorylation, and hence inactivation, of the thiazide‐sensitive NaCl cotransporter (NCC) in the renal distal convoluted tubule (DCT). Based on experiments in heterologous expression systems, it was proposed that changes in extracellular K+ concentration ([K+]ex) modulate NCC phosphorylation via a Cl−‐dependent modulation of the with no lysine (K) kinases (WNK)‐STE20/SPS‐1‐44 related proline‐alanine‐rich protein kinase (SPAK)/oxidative stress‐related kinase (OSR1) kinase pathway. We used the isolated perfused mouse kidney technique and ex vivo preparations of mouse kidney slices to test the physiological relevance of this model on native DCT. We demonstrate that NCC phosphorylation inversely correlates with [K+]ex, with the most prominent effects occurring around physiological plasma [K+]. Cellular Cl− conductances and the kinases SPAK/OSR1 are involved in the phosphorylation of NCC under low [K+]ex. However, NCC dephosphorylation triggered by high [K+]ex is neither blocked by removing extracellular Cl−, nor by the Cl− channel blocker 4,4′‐diisothiocyano‐2,2′‐stilbenedisulphonic acid. The response to [K+]ex on a low extracellular chloride concentration is also independent of significant changes in SPAK/OSR1 phosphorylation. Thus, in the native DCT, [K+]ex directly and rapidly controls NCC phosphorylation by Cl−‐dependent and independent pathways that involve the kinases SPAK/OSR1 and a yet unidentified additional signalling mechanism.
Keywords: potassium, sodium transport, signal transduction
Key points
High dietary potassium (K+) intake dephosphorylates and inactivates the NaCl cotransporter (NCC) in the renal distal convoluted tubule (DCT).
Using several ex vivo models, we show that physiological changes in extracellular K+, similar to those occurring after a K+ rich diet, are sufficient to promote a very rapid dephosphorylation of NCC in native DCT cells.
Although the increase of NCC phosphorylation upon decreased extracellular K+ appears to depend on cellular Cl− fluxes, the rapid NCC dephosphorylation in response to increased extracellular K+ is not Cl−‐dependent.
The Cl−‐dependent pathway involves the SPAK/OSR1 kinases, whereas the Cl− independent pathway may include additional signalling cascades.
Abbreviations
- [Cl−]ex
extracellular chloride concentration
- [Cl−]i
intracellular chloride concentration
- DCT
distal convoluted tubule
- DIDS
4,4′‐Diisothiocyano‐2,2′‐stilbenedisulphonic acid
- IPK
isolated perfused mouse kidney
- [K+]ex
extracellular potassium concentration
- NCC
NaCl cotransporter
- OSR1
oxidative stress‐related kinase
- PP
protein phosphatase
- PP1/PP2A
protein phosphatase 1/2A
- PP3
protein phosphatase 3 or calcineurin
- SPAK
STE20/SPS‐1‐44 related proline‐alanine‐rich protein kinase
- tNCC
total amount of NCC protein
- WNK
with no lysine (K) kinases
Introduction
A high dietary potassium (K+) intake has anti‐hypertensive effects and improves cardiovascular outcomes (Mente et al. 2014; O'Donnell et al. 2014). These beneficial effects of a K+ rich diet are probably related to a negative Na+ balance as a result of enhanced renal Na+ excretion (Sorensen et al. 2013; Mente et al. 2014; Buendia et al. 2015; Penton et al. 2015). Indeed, oral K+ loading promotes a rapid natriuresis that coincides with a dephosphorylation, and thus inactivation, of the thiazide‐sensitive NaCl cotransporter (NCC) in the renal distal convoluted tubule (DCT) (Sorensen et al. 2013). Conversely, dietary K+ restriction increases NCC phosphorylation (Vallon et al. 2009) and cell surface abundance of NCC (Frindt & Palmer, 2010), and also promotes a salt‐sensitive rise in blood pressure (Vitzthum et al. 2014) that depends on the presence of NCC (Terker et al. 2015). Although an increase in NCC abundance was not always observed with dietary K+ restriction (Nguyen et al. 2012), the critical role of NCC for the maintenance of Na+ homeostasis and the control of blood pressure is indictated by thiazide diuretics being a mainstay of anti‐hypertensive therapy. Furthermore, genetic diseases featuring loss‐of‐function mutations in NCC cause hypotension, while mutations in NCC‐regulating kinases [with no Lysine (K) (WNK) WNK1 and WNK4] and ubiquitin‐protein ligase complexes (KLHL3, cullin) are related to hypertension (Simon et al. 1996; Wilson et al. 2001).
The WNK kinases mediate their effects via phosphorylation of the STE20/SPS‐1‐44 related proline‐alanine‐rich protein kinase (SPAK) and the related oxidative stress‐related kinase (OSR1), which directly activate NCC by N‐terminal phosphorylation (Hoorn et al. 2011 a). Based on studies in heterologous expression systems, it was proposed that the WNK and SPAK/OSR1 kinase pathway is critically involved in the effect of dietary K+ intake on NCC activity. In this model, altered dietary K+ intake impacts on the extracellular K+ concentration ([K+]ex), which leads to changes in basolateral plasma membrane voltage and thus intracellular [Cl−] ([Cl−]i). Changes in [Cl−]i have been shown to modulate the activities of both WNK1 (Piala et al. 2014) and WNK4 (Bazúa‐Valenti et al. 2015), which ultimately regulate SPAK/OSR1 phosphorylation and activity, and thus NCC (Terker et al. 2015). However, given the lack of an appropriate cell model that resembles the physiological complexity of native DCT cells, the relevance of this pathway for the DCT in the kidney in vivo is unclear. Indeed, the results from SPAK knockout (Wade et al. 2015), SPAK knock‐in (Castañeda‐Bueno et al. 2014) and SPAK/OSR1 knockout mouse models (Terker et al. 2015) have indicated that additional mechanisms must contribute as well. Moreover, the rapidity of NCC dephosphorylation in response to an increased dietary K+ load suggests that not only an inactivation of the phosphorylating kinase pathway, but also an activation of yet undefined dephosphorylating protein phosphatases (PPs), probably contributes towards the control of NCC phosphorylation by plasma [K+]. Several PPs have been implicated in the modulation of NCC phosphorylation, including PP1 (Picard et al. 2014), PP3 (calcineurin) (Lazelle et al. 2016) and PP4 (Glover et al. 2010). Nevertheless, to date, no specific physiological function has been assigned to any of these phosphatases in the DCT.
In the present study, we investigated the response of native DCT cells to changes in [K+]ex by combining in vivo and ex vivo methods. Our data support the hypothesis that the regulation of NCC phosphorylation triggered by changes in plasma K+ occurs very rapidly and is mediated by Cl−‐dependent and independent mechanisms that involve SPAK/OSR1 and probably additional signalling pathways.
Methods
Ethical approval
All animal experiments were conducted according to Swiss Laws and were approved by the veterinary administration of the Canton of Zurich, Switzerland.
Reagents and antibodies
Unless otherwise stated, reagents were purchased from Sigma‐Aldrich (Buchs, Switzerland). 4,4′‐Diisothiocyano‐2,2′‐stilbenedisulphonic acid (DIDS) and tacrolimus were purchased from Abcam (Abcam, Cambridge UK). Calyculin A was purchased from Cell Signaling Technologies (Beverly, MA, USA). Total amount of NCC protein (tNCC), pT53NCC, pT58NCC and pS71NCC antibodies have been described previously (Wagner et al. 2008; Sorensen et al. 2013; Picard et al. 2014). The pT96‐pT101 NKCC2 antibody was generated by immunization of rabbits with a phospho‐peptide (NH2‐CLQ(pT)FGHN(pT)MD‐CONH2) corresponding to the amino acids of mouse NKCC2 and subsequent affinity purification of the antibody (Pineda, Berlin, Germany). The specificity of the Ab towards pT96‐pT101 NKCC2 was confirmed by immunohistochemistry. The antibody specifically stains the apical plasma membrane of the thick ascending limb. Pre‐incubation of the antibody with the above mentioned phospho‐peptide, but not with the corresponding dephospho‐peptide abolished the immunostaining (data not shown). β‐actin antibody was purchased from Sigma‐Aldrich. Anti‐Serine/threonine‐protein kinase 39 (referred to as tSPAK in the present study) and anti‐phospho‐SPAK (Ser 373)/phospho‐OSR1 (Ser 325) (referred to as pSPAK‐pOSR1 in the present study) antibodies were purchased from Millipore (Millipore, Temecula, CA, USA).
Animals
Experiments were conducted in C57Bl/6 wild‐type mice aged between 3 and 8 months. Mice were maintained under a 12:12 h light/dark cycle and had access to standard chow (3430; Provimi‐Kliba, Penthalaz, Switzerland) and water ad libitum. Animals were age‐, weight‐ and sex‐matched for each experimental series.
KCl i.v. injections
Twelve hours before the experiments, age‐ and weight‐matched female animals were fasted, although free access to water was maintained. Animals were fixed in a supine position for surgery under anaesthesia with isoflurane (Attane, Piramal, India). After median laparotomy, the vena cava was punctured using a 26‐G needle. Either 100 μl of 80 mmol l–1 KCl (in distilled H2O with NaCl added to 300 mosmol kg–1) or 0.9% NaCl as control were randomly injected. Either 5 or 15 min later, blood was withdrawn via the right ventricle. Blood was directly centrifuged, and the plasma collected and stored at –20°C for further analysis. Animals were then perfused with 20 ml of ice‐cold PBS via the abdominal aorta, and then the kidneys were removed, decapsulated and snap frozen for western blot analysis.
Isolated perfused mouse kidney
Isolated mouse kidney perfusion was performed at 37°C in a small animal perfusion system (Hugo Sachs Elektronik, March, Germany) as described previously (Schweda et al. 2003). Age‐ and weight‐matched male animals were used. In all experiments, kidneys were first perfused for 30 min (pressure‐fixed 90 mmHg) with buffer (for precise buffer composition, see Supporting information, Table S1) containing 4.5 mmol l–1 K+. Afterwards, buffer [K+] was randomly adapted by adding KCl to a K+ concentration ranging between 3.2 and 10.38 mmol l–1, and kidneys were perfused for additional 30 min. After 1 h, perfusion was stopped and kidneys were snap frozen in liquid nitrogen for western blot analysis. NCC phosphorylation in perfused kidneys was normalized to NCC phosphorylation in contralateral kidneys from same animals, which were removed and snap frozen at the beginning of the procedure. For immunohistochemistry studies, after perfusion with either 4.5 or 10 mmol l–1 [K+] for 1 h, 3% paraformaldehyde was added to the perfusion buffer. Then, 50 mL of buffer + fixative were infused at 200 mmHg and washed out with 50 mL of buffer without fixative at 120 mmHg. The kidneys were post‐fixed in 1.5% paraformaldehyde at 4°C overnight and processed as described previously for immunofluorescence microscopy (Sorensen et al. 2013).
Kidney slice preparation
Sex‐, age‐ and weight‐matched mice were used for preparation of kidney slices. Both kidneys were quickly removed under deep isoflurane anaesthesia (Attane) and 280 μm thick slices were cut with a vibrating microslicer (Vibratome, Microm; Thermo Scientific, Waltham, MA, USA). Slicing was performed in ice‐cold Ringer‐type solution (in mmol l–1): 98.5 NaCl, 35 NaHCO3, 3 KCl, 1 NaH2PO4, 2.5 CaCl2, 1.8 MgCl2 and 25 glucose. The slices were incubated for equilibration in a similar Ringer‐type solution (25 mmol l–1 NaHCO3) for 30 min at 30.5°C. Afterwards, the slices were transferred to the incubation chambers containing the effector or control solutions. All solutions were continuously bubbled with 95% O2 and 5% CO2. In experiments in which [K+]ex was changed, osmolality and [Cl−]ex were kept constant by addition of equal amounts of NaCl (or Na‐Gluconate in low [Cl−]ex experiments). Some slices exposed to varying [K+]ex were incubated also in the presence isoproterenol (100 nmol l–1) or calyculin A (20 nmol l–1) dissolved in DMSO, or tacrolimus (10 μmol l–1) dissolved in ethanol. In parallel, slices were incubated with either DMSO or ethanol in the appropriate amount and used as control vehicle. After 30 min of incubation with the effectors, slices were snap frozen in liquid nitrogen and processed for immunoblotting.
Reversibility of NCC dephosphorylation
After equilibration under control conditions (3 mmol l–1 [K+]ex) for 30 min, kidney slices were transferred to incubation chambers containing either 1, 3 or 10 mmol l–1 [K+]ex (low, control, high [K+]ex respectively) and incubated for another 30 min, as described previously. Next, slices previously incubated with 10 mmol l–1 [K+]ex were transferred to the 1 mmol l–1 [K+]ex chamber and incubated for a further 30 min. After a total incubation time of 90 min, slices from each incubation condition were collected and processed for immunoblotting.
DCT microperfusion
DCTs were morphologically identified and isolated manually from kidney slices after enzymatically assisted separation of nephron segments using a dissection microscope, as described previously (Pohl et al. 2010; Gong et al. 2015). The preparation solution contained (in mmol l–1): 49 NaCl, 3 KCl, 0.4 NaH2PO4, 1.6 Na2HPO4, 1 MgCl2, 2.3 Ca‐gluconate, 190 mannitol and 5 glucose. Ten DCTs per condition were microperfused using a double‐barrelled perfusion pipette, as previously described (Greger, 1981) with a solution containing (in mmol l–1): 50 NaCl, 2 KCl, 0.4 NaH2PO4, 1.6 Na2HPO4, 1 MgCl2, 2.3 Ca‐gluconate, 190 mannitol and 5 glucose for 10 min at 37°C. The basolateral solution contained (in mmol l–1): 105 NaCl, 0.4 NaH2PO4, 1.6 Na2HPO4, 1 MgCl2, 2.3 Ca‐gluconate, 30 Na‐gluconate and 5 glucose. KCl (1 or 10 mmol l–1) was added depending on the experimental condition and the osmolality of the solutions was equilibrated with NaCl accordingly. Following perfusion, DCTs were collected from the chamber, and then pooled and processed for immunoblotting. In addition, samples of 10–15 unperfused DCTs were incubated in preparation solution for 10 min at 37°C.
Aldosterone measurements
For aldosterone measurements, 10 μl of plasma was diluted in 40 μl of 0.9% NaCl and measured in triplicates using an Aldosterone ELISA (enzyme‐linked immunosorbent assay) Kit (CAN‐ALD‐450; Diagnostics Biochem Canada Inc., Dorchester, ON, Canada) and a Tecan plate reader (Tecan infinite F200 Pro; Tecan Group AG, Männedorf, Switzerland) in accordance with the manufacturer's instructions.
Plasma electrolyte analysis
Plasma electrolyte levels were measured in 100 μl of undiluted plasma using an EFOX 5053 flame photometer (Eppendorf, Hanburg, Germany).
Immunoblotting
Kidney samples were homogenized in a Precellys 24 homogenizer (Bertin Technologies, Rockville, MD, USA) or by ultrasound in lysis buffer containing protease inhibitor cocktail (Complete; Roche Diagnostics, Basel, Switzerland), phosphatase inhibitor (Phosstop; Roche Diagnostics), and (in mmol l–1) 200 mannitol, 80 Hepes and 41 KOH (pH corrected to 7.4). Homogenized samples without any further manipulation, or the supernatant from the samples centrifuged for 10 min 4000 g at 4°C (whole animal studies or isolated perfused kidney), were then used for western blotting. Protein concentration was assessed via Bradford assay (CooAssay Protein Dosage Reagent; Uptima, Montluçon, France). Then, 25 μg (or 50 μg for the detection of SPAK and pSPAK‐pOSR1) of protein was solubilized in loading buffer (31.5 mmol l–1 Tris‐HCl, 1% SDS, 0.005% Bromphenol blue, 12.5% glycerol and 5% β‐mercaptoethanol, pH 6.5), run on 8% SDS‐PAGE and transferred to nitrocellulose membranes. Membranes were blocked for 20 min in blocking buffer (Odyssey blocking buffer; Li‐Cor, Lincoln, NE, USA) and incubated with primary antibodies at 4°C overnight. Membranes were further incubated for 2 h at room temperature with the appropriate secondary antibodies and imaged using a Li‐Cor infrared scanner (Li‐Cor). Optical density of bands was quantified using ImageJ (http://imagej.nih.gov/ij) and normalized to the corresponding band densities in a Coomassie‐stained gel (ProtoBlue Safe; National Diagnostics, Hessle, UK) that was loaded and run in parallel. A protein dilution series was performed for each antibody and confirmed that signal detection and analysis were performed in the linear range of the system. Detection of β‐actin was used to visualize equal loading.
Statistical analysis
An unpaired Student's t test was used to compare between two groups. For multiple comparison, one‐way ANOVA with Bonferroni's multiple comparison post hoc test was performed using OriginPro, 2015 (OriginLab Corp., Northampton, MA, USA).
Results
Small variations of plasma [K+] rapidly modulate NCC phosphorylation
In previous experiments in mice, we found that oral K+ loading rapidly increased plasma [K+] and dephosphorylated NCC (Sorensen et al. 2013). Similarly, further analysis of rat and mouse models suggested an inverse correlation between plasma [K+] and NCC phosphorylation (Rengarajan et al. 2014; Terker et al. 2016). To test whether altered plasma [K+] could directly account for the observed rapid changes of NCC phosphorylation in the kidney, we performed two types of experiments. First, we i.v. injected 100 μl of either vehicle or 80 mmol l–1 KCl in mice. The KCl injection increased plasma [K+] significantly (Fig. 1 A), whereas the plasma concentrations of Na+ and aldosterone remained largely unchanged within the time frame analysed (Fig. 1 B and C). NCC phosphorylation at all tested sites (T53, T58 and S71) was decreased 5 min after KCl injection; the effect was even more pronounced at 15 min (Fig. 1 D). Next, we perfused isolated mouse kidneys ex vivo with buffers containing different concentrations of K+, ranging from 3.2 to 10.38 mmol l–1. To counterbalance the inter‐individual variation, NCC phosphorylation in the perfused kidney was normalized to NCC phosphorylation in the intact contralateral kidney from the same animal (Fig. 1 E). We observed a clear inverse dose–response relationship between [K+] and NCC phosphorylation (Fig. 1 F; see also Supporting information, Table S2) with the most pronounced changes in NCC phosphorylation occurring between 3 and 5 mmol l–1 of [K+]. Consistent with previous in vivo data (Sorensen et al. 2013; Rengarajan et al. 2014; Terker et al. 2015), the effect of K+ on the isolated perfused kidney ex vivo was specific for NCC because the phosphorylation of the closely‐related transporter NKCC2 in the thick ascending limb of the loop of Henle remained stable, regardless of [K+] (Fig. 1 G).
Figure 1. Plasma [K+] directly and rapidly controls NCC phosphorylation in the intact kidney in vivo and ex vivo .
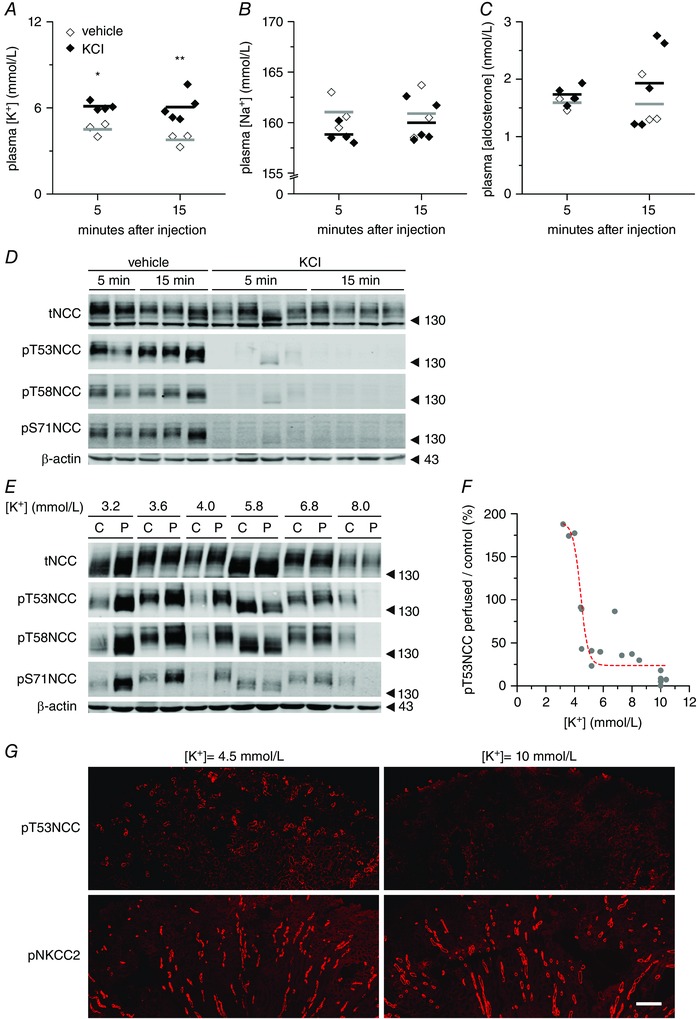
A–C, changes in plasma K+, Na+ and aldosterone concentrations, respectively, 5 or 15 min after i.v. injection of 100 μl of vehicle (three mice) or 80 mmol l–1 KCl in mice (four or five mice per group). Dots represent independent measurements and bars represent the mean of each group. * P < 0.05, ** P < 0.01 compared to vehicle injection, using an unpaired Student's t test. D, representative immunoblot (from mice in A–C) showing the changes in NCC phosphorylation in response to plasma [K+] elevations. E, representative immunoblot of isolated perfused mouse kidneys (‘P’) showing the modulation of NCC expression and phosphorylation at different phospho‐sites upon changes in [K+]ex (‘C’: non‐perfused contralateral controls) F, summary of 18 experiments showing the dependence of NCC phosphorylation on the [K+]ex. Each dot represents the ratio of NCC phosphorylation between the perfused kidney and the non‐perfused contralateral kidney from one mouse. Dashed red line represents a sigmoidal fitting (for details, see Supporting information, Table S2). G, immunofluorescence staining of pT53NCC (upper images) and the closely‐related cotransporter pNKCC2 phosphorylated in T96 and T101 (lower images) in kidneys perfused with 4.5 or 10 mmol l–1 [K+]ex. Scale bar = 250 μm.
The kidney slice model reproduces the in vivo findings
The isolated perfused mouse kidney (IPK) model allowed us to assess the effect of K+ on the DCT in an intact organ at the same time as avoiding the systemic effects of confounding factors such as hormones and renal innervation. Nevertheless, with this system, we could not exclude the influence of changes in tubular flow and intrarenal haemodynamics on DCT function. Given the lack of an appropriate DCT cell model suitable to assess the direct effect of [K+], we used simple kidney slice preparations to study ex vivo acute changes in NCC phosphorylation in native DCT cells. First, we studied the behaviour of tNCC and phosphorylated NCC in kidney slices incubated with control Ringer‐type buffer (3 mmol l–1 [K+]ex) during the course of 1 h. Under these conditions, the abundance of tNCC remained stable between 15 and 60 min of incubation, whereas pT53NCC decreased continuously with time (Fig. 2 A and B). As we observed a stable NCC phosphorylation between 30 and 60 min of incubation, all further experiments were performed during this time frame, unless stated otherwise.
Figure 2. Ex vivo kidney slice preparation recapitulates the findings in intact mice and isolated perfused kidney .
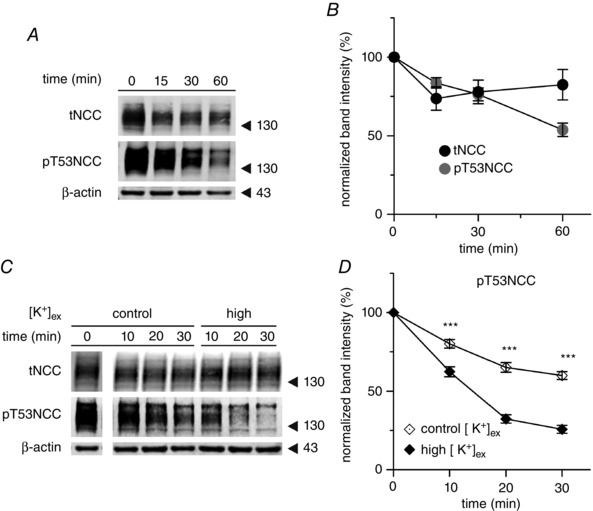
A, representative experiment showing the expression and phosphorylation of NCC at T53 in kidney slices incubated for 1 h in control buffer (3 mmol l–1 [K+]ex). B, summary of the expression and phosphorylation of NCC at T53 in kidney slices incubated under control conditions for 1 h (n = 19 slices, 10 mice). C, representative western blot showing the expression and phosphorylation of NCC at position T53 under control (3 mmol l–1) or high (10 mmol l–1) [K+]ex incubation conditions. Samples at t 0 (after 30 min of equilibration) were run in the same gel as the rest for every given antibody but not in sequential position. D, summary of phosphorylation of NCC at position T53 in kidney slices incubated under control (3 mmol l–1) or high (10 mmol l–1) [K+]ex conditions (n = 8–17 slices, three to seven mice). *** P < 0.001; unpaired Student's t test compared to control incubation). The mean ± SEM is shown in (B) and (D).
First, we analysed the effect of elevated [K+]ex. Although [K+] did not affect tNCC, the drop in pT53NCC over time was steeper in slices incubated with 10 mmol l–1 [K+]ex compared to those incubated in 3 mmol l–1 [K+]ex buffer (Fig. 2 C and D).
NCC phosphorylation is modified by manipulations that affect DCT membrane voltage
The membrane voltage of DCT cells is considered to be controlled by the activity of the basolateral K+ channel Kir4.1 (KCNJ10 gene) (Reichold et al. 2010; Zhang et al. 2014), which functions as heterotetramer with Kir5.1 (KCNJ16). Under physiological conditions, KCNJ10/16 is assumed to hyperpolarize DCT basolateral plasma membrane voltage (Paulais et al. 2011). Thus, increasing [K+]ex should depolarize DCT cells, whereas hyperpolarization will occur under low [K+]ex. We investigated whether manipulations promoting changes in the membrane voltage of DCT cells were sufficient to modulate NCC phosphorylation. The phosphorylation of NCC was assessed by immunoblotting after incubating kidney slices for 30 min with different [K+]ex. Although tNCC remained stable under all [K+]ex investigated (Fig. 3 A and B), pT53NCC showed an inverse dose–response curve in response to changes in [K+]ex (Fig. 3 A and C). In agreement with the results obtained in vivo and with the IPK model, physiologically relevant variations in [K+]ex were already sufficient to induce statistically significant changes in NCC phosphorylation ([K+]ex 3 mmol l–1 = 100 ± 4.7% of pT53NCC; [K+]ex 5 mmol l–1 = 56.0 ± 7.0 % of pT53NCC; P < 0.001). Furthermore, NCC dephosphorylation could be partially reversed by transferring the slices from high [K+]ex (10 mmol l–1) to low [K+]ex (1 mmol l–1) (Fig. 3 D). Moreover, the addition of the potassium channel blocker BaCl2 (5 mmol l–1) was sufficient to promote the dephosphorylation of NCC (Fig. 3 E and F).
Figure 3. Regulation of NCC phosphorylation by maneuvers affecting DCT membrane voltage .
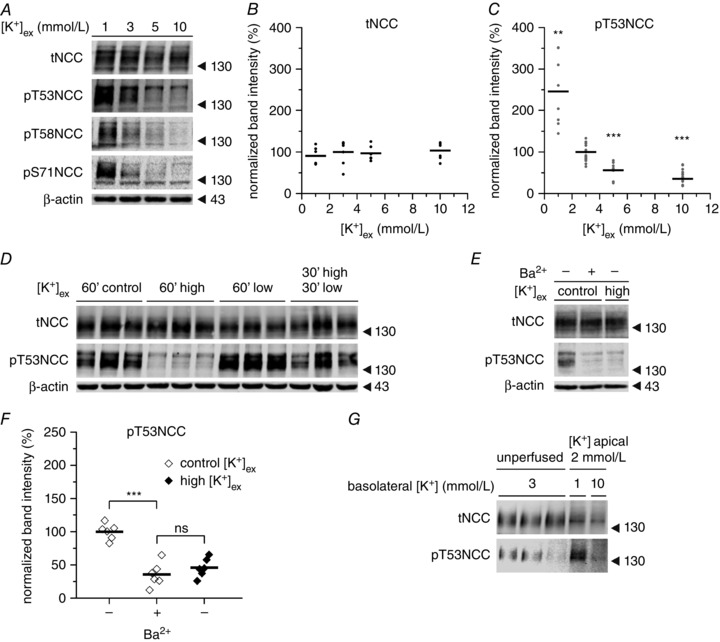
A, representative experiment showing the dose–response modulation of NCC phosphorylation by [K+]ex at different phosphorylation sites in kidney slices. B, expression of tNCC upon incubation with different [K+]ex (n = 6–7 slices per treatment, two mice). C, changes in NCC phosphorylation at position T53 upon incubation with different [K+]ex (n = 8–17 slices per treatment, three to seven mice). ** P < 0.01, *** P < 0.001; unpaired Student's t test compared to control [K+]ex (3 mmol l–1). D, representative experiment showing the reversibility of NCC dephosphorylation triggered by high [K+]ex. Control, high and low stand for 3, 10 and 1 mmol l–1 [K+]ex respectively. This experiment was repeated twice (two mice) with similar results. E and F, effect of BaCl2 (5 mmol l–1) on NCC phosphorylation (n = 6 slices per treatment, two mice). G, changes in NCC phosphorylation in hand isolated DCTs microperfused with 2 mmol l–1 [K+]ex from the luminal side and either 1 or 10 mmol l–1 [K+]ex from the basolateral side for 10 min. Each band represents a pool of 10 DCTs. *** P < 0.001, ns, non‐significant using an unpaired Student's t test. In (B), (C) and (F), points represent individual experiments (slices) and bars represent the mean of the given treatment.
DCTs express K+ channels on both the apical and the basolateral membrane (Bandulik et al. 2011) and these channels could potentially sense changes in K+ intake. To assess whether changes of [K+]ex on the basolateral (blood) side are sufficient to promote changes in NCC phosphorylation, DCTs were isolated by hand and exposed at the basolateral cell side to either 1 or 10 mmol l–1 [K+]ex. The lumen was microperfused with 2 mmol l–1 K+ and 50 mmol l–1 Na+, which recapitulates the physiological luminal K+ and Na+ concentrations, as observed previously by in vivo micropuncture measurements (Weinstein, 2012). Subsequently, changes in the phosphorylation of NCC were assessed by immunoblotting. As shown in Figure 3 G, lowering basolateral [K+]ex to 1 mmol l–1 triggered the phosphorylation of NCC within 10 min; at 10 mmol l–1 of basolateral [K+]ex, the phosphorylation of NCC was almost completely abolished.
Low [Cl−]ex clamps SPAK/OSR1 phosphorylation but does not prevent NCC dephosphorylation in response to high [K+]ex
Changes in intracellular [Cl−]i have been proposed to underlie the modifications of NCC phosphorylation in response to altered [K+]ex (Zhang et al. 2014; Terker et al. 2015). According to this hypothesis, [K+]ex affects membrane voltage, which changes the driving force for Cl− to exit the cell through chloride channels in the basolateral membrane of DCT cells. Thus, a hyperpolarized cell membrane will lead to an increased Cl− exit, therefore lowering its intracellular concentration; in contrast, depolarized cells will retain Cl−. These secondary changes in [Cl−]i were proposed to regulate the phosphorylation of SPAK and NCC as a result of the inhibitory effect of [Cl−]i on WNK1 and WNK4 (Alessi et al. 2014). Indeed, increasing [K+]ex promotes both NCC and SPAK/OSR1 dephosphorylation (Fig. 4 A, C and D).
Figure 4. Effect of [K+]ex on NCC and SPAK/OSR1 phosphorylation in native DCT cells is affected by changes in Cl− conductances .
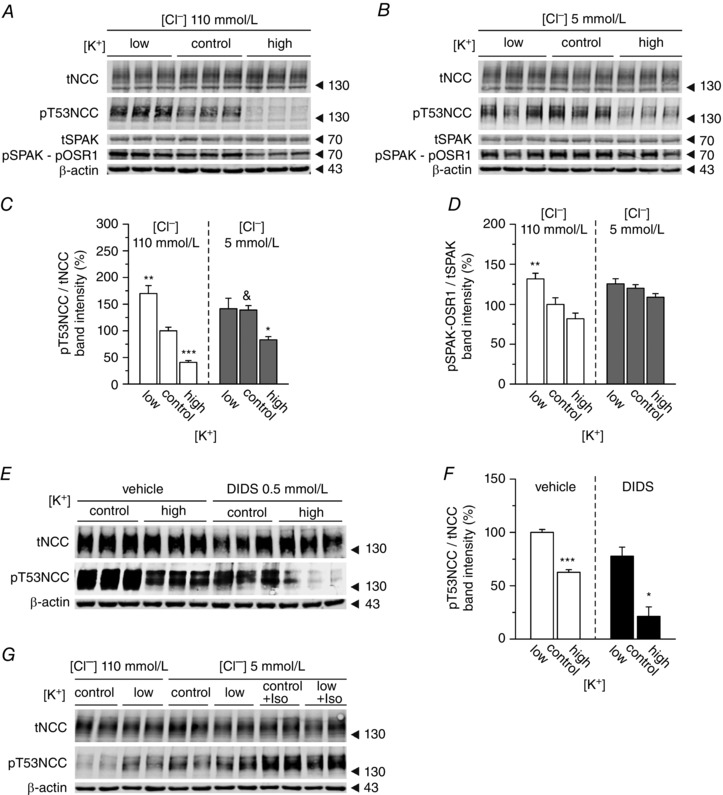
A, representative immunoblot showing the changes in tNCC and pT53NCC, as well as SPAK and pSPAK‐pOSR1, in kidney slices treated with low (1 mmol l–1), control (3 mmol l–1) or high (10 mmol l–1) [K+]ex under control (110 mmol l–1) [Cl−]ex conditions. B, same experiment as in A but under 5 mmol l–1 [Cl−]ex. C, summary of the effect of [K+]ex on NCC phosphorylation at position T53 under control or low [Cl−]ex conditions (n = 9–18 slices per treatment, three to six mice). D, summary of the effect of [K+]ex on SPAK/OSR1 phosphorylation at position T53 under control or low [Cl−]ex conditions (n = 6 slices per treatment, two mice). C and D, * P < 0.05, ** P < 0.01 and *** P < 0.001, compared to the control condition ([K+]ex 3 mmol l–1) of each [Cl−]ex; &P < 0.05 compared to the control condition of 110 mmol l–1 [Cl−]ex using ANOVA with Bonferroni's multiple comparison post hoc test. E, representative experiment showing the changes in NCC expression and phosphorylation at T53 in the presence or absence of the [Cl−] channel blocker DIDS upon treatment with control (3 mmol l–1) or high (10 mmol l–1) [K+]ex. F, densitometric analysis of (E) (n = 3 slices per treatment, one mouse). * P < 0.05 compared to the control for each condition using an unpaired Student's t test. G, stimulation of NCC phosphorylation by isoproterenol (100 mmol l–1) under low (5 mmol l–1) [Cl−]ex.
To test the hypothesis that cellular Cl− fluxes and altered SPAK activity contribute to the regulation of NCC by [K+]ex, we compared kidneys slices incubated with either a standard buffer (110 mmol l−1 [Cl−]ex) or a buffer in which almost all Cl− was replaced by using sodium gluconate instead of NaCl (5 mmol l−1 [Cl−]ex). Under standard conditions (110 mmol l−1 [Cl−]ex), lowering [K+]ex increased SPAK/OSR1 and NCC phosphorylation, whereas high [K+]ex had opposing effects (Fig. 4 A, C and D). Lowering [Cl−]ex to 5 mmol l–1 significantly increased NCC phosphorylation (Fig. 4 C). Under this low [Cl−]ex condition, we did not see any increase in either SPAK/OSR1 or NCC phosphorylation in response to lowering [K+]ex from 3 (control) to 1 (low) mmol l–1 (Fig. 4 B, C and D). Nevertheless, NCC phosphorylation under low [Cl−]ex conditions could still be enhanced by isoproterenol, which was previously described as an activator of NCC phosphorylation (Terker et al. 2014) (Fig. 4 G). This indicates that the lack of response to low [K+]ex is not explained by an already maximal stimulation of NCC. By contrast to the diminished response to low [K+]ex, NCC was still dephosphorylated when [K+]ex was increased from 3 (control) to 10 (high) mmol l–1 (Fig. 4 B and C). The extent of the dephosphorylation was comparable to the one at baseline [Cl−]ex (80.9 ± 11.8% vs. 72.5 ± 19.0%; under 110 vs. 5 mmol l–1 [Cl−]ex, respectively). Interestingly, the dephosphorylation of NCC occurred independently of any significant change in SPAK/OSR1 phosphorylation, which remained clamped at a high level (Fig. 4 B and D). Consistent with the Cl− replacement studies, inhibition of plasma membrane Cl− fluxes with the Cl− channel blocker DIDS (0.5 mmol l–1) did not prevent NCC dephosphorylation in response to increasing [K+]ex from 3 (control) to 10 (high) mmol l–1 (Fig. 4 E and F).
High [K+]ex induced dephosphorylation of NCC is not blocked by inhibition of PP1, PP2A and PP3
Given the evidence described above for SPAK independent effects of [K+]ex on NCC, as well as the rapid kinetics of NCC dephosphorylation, we investigated whether some of the known NCC regulating PPs might be involved in mediating the effect of high [K+]ex on NCC. Neither incubation of tissue slices with the PP1 and PP2A inhibitor calyculin A (Sorensen et al. 2013), nor the PP3 (calcineurin) inhibitor tacrolimus (Hoorn et al. 2011 b), prevented the dephosphorylation of NCC in response to increased [K+]ex on standard [Cl−]ex (Fig. 5).
Figure 5. Inhibition of PP1, PP2A and PP3 does not impair the dephosphorylation of NCC upon high [K+]ex .
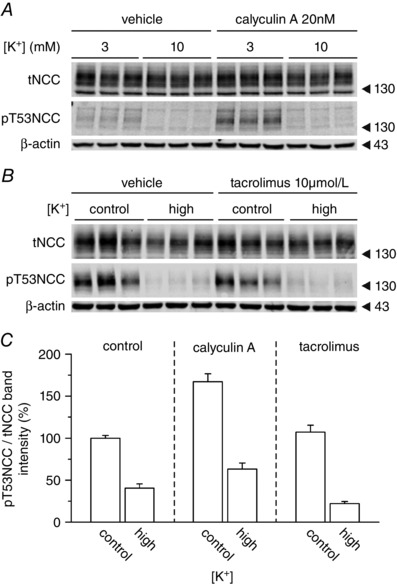
Representative western blot showing the changes in NCC expression and phosphorylation at position T53 in slices treated with control (3 mmol l–1) or high (10 mmol l–1) [K+]ex under control (110 mmol l–1) [Cl−]ex conditions. A, effect of inhibition of PP1 and PP2A with calyculin A. B, effect of inhibition of PP3 (calcineurine) with tacrolimus. C, summary of the densitometric analysis of 6–12 slices per condition, two to four mice per experimental group.
Discussion
Dietary K+ intake has a strong impact on the phosphorylation, and hence activity, of NCC in the DCT. Previous studies have correlated these effects with altered plasma K+ levels and suggested a model in which the extracellular K+ concentration, via altered membrane voltage and intracellular Cl− concentrations, regulates the WNK‐ and SPAK‐dependent phosphorylation of NCC. In the present study, we employed three different ex vivo models (i.e. the isolated perfused kidney, the isolated perfused tubule and kidney slices) to experimentally test this hypothesis on the native DCT. Our data provide clear evidence for rapid and direct effects of [K+]ex on NCC phosphorylation and suggest that, apart from the Cl−‐dependent WNK/SPAK kinase pathway, a Cl−‐ and SPAK independent pathway also contributes to the regulation of NCC by [K+]ex.
Rengarajan et al. (2014) showed that 3 h of i.v. infusion of KCl reduces phosphorylation of NCC and marginally that of SPAK in parallel to increased plasma [K+]. Similarly, for various mouse models, Terker et al. (2016) described a clear inverse relationship between plasma [K+] and NCC phosphorylation, suggesting that plasma [K+] may have direct effects on the native DCT. However, these data were correlative and did not allow for clear cause–effect conclusions. The possible regulatory effect of humoral kaliuretic factors and/or nerval reflexes (Rabinowitz, 1996) could not be excluded. By using three independent ex vivo approaches, we provide consistent and conclusive evidence that [K+]ex directly modulates NCC phosphorylation in native DCT cells. This regulation occurs very rapidly (<30 min) and is particularly prominent in the range of physiological plasma [K+], suggesting that transient and small variations in plasma (K+), as they may occur in response to a meal, may already be sufficient to modulate NCC activity and hence renal Na+ reabsorption. However, the present ex vivo data contrast with our previous data on isolated DCT preparations in which we failed to observe any significant NCC dephosphorylation after increasing extracellular K+ from 5 to 10 mmol l–1 (Sorensen et al. 2013). As we demonstrate in the present study, 5 mmol l–1 is already on the upper [K+] limit rendering almost all NCC dephosphorylated. Nevertheless, DCTs are still able to respond to decreased [K+]ex, as demonstrated by the isolated perfused DCT technique.
Based on experiments using whole animal and heterologous expression system models, Terker et al. (2015) recently hypothesized that DCT cells depolarize upon an increase in plasma [K+]. The subsequent increase in [Cl−]i leads to decreased phosphorylation of NCC via the inhibition of the WNK‐SPAK/OSR1 kinase pathway. In agreement with this hypothesis, in native DCTs, we found that both an increase of [K+]ex and the addition of the K+ channel blocker BaCl2 to the incubation buffer triggered a pronounced dephosphorylation of NCC. By contrast, removal of extracellular Cl−, which presumably lowers intracellular Cl−, significantly increased NCC phosphorylation, and blocked the stimulatory effect of low [K+]ex on NCC. However, although these data are suggestive for an involvement of plasma membrane voltage and intracellular [Cl−], we could not directly analyse these parameters in our ex vivo preparations for technical reasons, including an insufficient up‐take of Cl− ‐sensitive dyes into DCT cells. Other mechanisms, such as changes in cell volume, remain to be considered. Indeed, hypo‐osmotic cell swelling stimulates SPAK‐dependent NCC activation (Richardson et al. 2008) and recent data suggest that WNK4 is phosphorylated in response to osmotic stress (Maruyama et al. 2016).
Interestingly, when we reduced [Cl−]ex to very low levels, thereby clamping SPAK‐OSR1 phosphorylation to very high levels, only the response of NCC to low [K+]ex, and not high [K+]ex, was blocked. Similarly, blocking Cl− channels with DIDS did not prevent the dephosphorylation of NCC under high [K+]ex, suggesting that additional mechanisms to the proposed pathway via Cl−‐dependent changes in WNK‐SPAK/OSR1 activity are also involved in the regulation of NCC phosphorylation by K+. It was already evident from the data provided by Terker et al. (2015) that the SPAK/OSR1 single and double knockout mice were still able to modulate NCC phosphorylation to some extent in response to low dietary K+ intake. Moreover, Castañeda‐Bueno et al. (2014) reported changes in NCC and its phosphorylation in response to changes in dietary K+ in WNK4 knockout mice. Furthermore, Wade et al. (2015) reported an increase in NCC phosphorylation in response to low K+ diet in SPAK knockout mice.
The rapidity of NCC dephosphorylation in response to K+ infusion, already evident within 5 min, suggests that, in addition to a shut‐down of NCC phosphorylation by kinases, an activation of NCC dephosphorylation via phosphatases may also contribute to the observed effects. Previous studies had implicated various phosphatases in the control of NCC function (Glover et al. 2010; Hoorn et al. 2011 b; Picard et al. 2014). PP1 and PP3 are highly abundant in the DCT and inhibition of PP1 and PP3 by calyculin A and tacrolimus, respectively, increases NCC phosphorylation (Hoorn et al. 2011 b; Picard et al. 2014). PP3 inhibition also probably explains the NCC‐dependent salt‐sensitive hypertension in patients under immunosuppressive therapy with calcineurin inhibitors (Hoorn et al. 2011 b; Borschewski et al. 2016). Similarly, a kidney‐specific deletion of FK506 binding protein, crucial for the effects of tacrolimus on PP3, attenuates tacrolimus‐induced arterial hypertension (Lazelle et al. 2016). However, in our experiments, inhibition of PP1 and PP3 did not block the [K+]ex‐induced dephosphorylation of NCC, suggesting that other signalling cascades are involved.
In conclusion, in the present study, we show that [K+]ex directly controls NCC phosphorylation in native DCT cells. The effect of low [K+]ex on NCC probably involves altered transmembrane Cl− fluxes and an activation of SPAK/OSR1, whereas the rapid effects of high [K+]ex do not critically depend upon transmembrane Cl− permeability and may include both inhibition of SPAK/OSR1 and activation of as yet unidentified signalling pathways. Based on the rapidity of NCC dephosphorylation in response to [K+]ex, we hypothesize that PPs are involved. Our data, might stimulate further research to identify these additional mechanism.
Additional information
Competing interests
The authors declare that they have no competing interests.
Author contributions
The work for this study was carried out at the University of Zurich, the University of Regensburg, Christian‐Albrecht University of Kiel and the University of Lausanne. DP designed and performed experiments (kidney slices preparation) analysed and interpreted the data and contributed to the writing of the manuscript. JC designed and performed experiments (i.v. KCl injection, isolated perfused mouse kidney) analysed and interpreted the data and contributed to the writing of the manuscript. AW contributed data and performed data analysis. NH designed and performed the isolated DCTs experiment, analysed and interpreted the data and contributed to the writing of the manuscript. DLC designed and performed immunoblottings and analysed the data. MC and RDR contributed data and performed data analysis. OS contributed to the conception of the study and to the writing of the manuscript. MB contributed to the conception of the work, to the design of the DCT isolation experiments and to the writing of the manuscript. FS contributed to the conception of the study, to the design and set up of the isolated perfused kidney technique and to the writing of the manuscript. JL conceived the study and contributed to the writing of the manuscript. All authors approved the final version of the manuscript; agree to be accountable for all aspects of the work in ensuring that questions related to the accuracy or integrity of any part of the work are appropriately investigated and resolved. All persons designated as authors qualify for authorship, and all those who qualify for authorship are listed.
Funding
David Penton is a fellow of the Program on Integrative Kidney Physiology and Pathophysiology (IKPP2) funded by the European Union's Seventh Framework Program for research, technological development and demonstration under grant agreement no 608847. NH and MB received support from the National Institutes of Health (NIH R01DK084059). Frank Schweda is supported by the German Research Foundation DFG (SFB699). Johannes Loffing and Olivier Staub are supported by research funds from the Swiss National Centre for Competence in Research ‘Kidney.CH’, by project grants from the Swiss National Science Foundation (310030_143929/1 to JL and 310030_159765/1 to OS) and by the COST Action ADMIRE BM1301. JC, AW, MC, DLC and RDR are university staff members and did not received any external funding for this work.
Supporting information
Disclaimer: Supporting information has been peer‐reviewed but not copyedited.
Table S1. Buffer content.
Table S2. Mathematical fitting.
Acknowledgements
The authors thank Professor Richard Warth for fruitful discussions and gratefully acknowledge the technical assistance of Robert Götz and Michèle Heidemeyer. We also thank Professor Vartan Kurtcuoglu for his help with the mathematical analysis of the data and Ms Julia Graf for her contribution to the initial immunofluorescence characterization of the pNKCC2 antibody. We also thank Dr Eilidh Craigie for carefully proofreading the manuscript submitted for publication. A set‐up for the isolated perfused kidney was kindly provided by Professor Wolf‐Georg Forssmann.
Linked articles This article is highlighted by a Perspective by Argaiz ' Gamba. To read this Perspective, visit http://dx.doi.org/10.1113/JP273177.
This is an Editor's Choice article from the 1 November 2016 issue.
References
- Alessi DR, Zhang J, Khanna A, Hochdörfer T, Shang Y & Kahle KT (2014). The WNK‐SPAK/OSR1 pathway: master regulator of cation‐chloride cotransporters. Sci Signal 7, re3. [DOI] [PubMed] [Google Scholar]
- Bandulik S, Schmidt K, Bockenhauer D, Zdebik Aa, Humberg E, Kleta R, Warth R & Reichold M (2011). The salt‐wasting phenotype of EAST syndrome, a disease with multifaceted symptoms linked to the KCNJ10 K+ channel. Pflügers Arch 461, 423–435. [DOI] [PubMed] [Google Scholar]
- Bazúa‐Valenti S, Chávez‐Canales M, Rojas‐Vega L, González‐Rodríguez X, Vázquez N, Rodríguez‐Gama A, Argaiz ER, Melo Z, Plata C, Ellison DH, García‐Valdés J, Hadchouel J & Gamba G (2015). The effect of WNK4 on the Na+‐Cl– cotransporter is modulated by intracellular chloride. J Am Soc Nephrol 26, 1781–1786. [DOI] [PMC free article] [PubMed] [Google Scholar]
- Borschewski A, Himmerkus N, Boldt C, Blankenstein KI, McCormick Ja, Lazelle R, Willnow TE, Jankowski V, Plain A, Bleich M, Ellison DH, Bachmann S & Mutig K (2016). Calcineurin and sorting‐related receptor with A‐type repeats interact to regulate the renal Na+‐K+‐2Cl− cotransporter. J Am Soc Nephrol 27, 107–119. [DOI] [PMC free article] [PubMed] [Google Scholar]
- Buendia JR, Bradlee ML, Daniels SR, Singer MR & Moore LL (2015). Longitudinal effects of dietary sodium and potassium on blood pressure in adolescent girls. JAMA Pediatr 02118, 1–9. [DOI] [PubMed] [Google Scholar]
- Castañeda‐Bueno M, Cervantes‐Perez LG, Rojas‐Vega L, Arroyo‐Garza I, Vázquez N, Moreno E & Gamba G (2014). Modulation of NCC activity by low and high K(+) intake: insights into the signalling pathways involved. Am J Physiol Renal Physiol 306, F1507–F1519. [DOI] [PMC free article] [PubMed] [Google Scholar]
- Frindt G & Palmer LG (2010). Effects of dietary K on cell‐surface expression of renal ion channels and transporters. Am J Physiol Renal Physiol 299, F890–F897. [DOI] [PMC free article] [PubMed] [Google Scholar]
- Glover M, Mercier Zuber A, Figg N & O'Shaughnessy KM (2010). The activity of the thiazide‐sensitive Na(+)‐Cl(‐) cotransporter is regulated by protein phosphatase PP4. Can J Physiol Pharmacol 88, 986–995. [DOI] [PubMed] [Google Scholar]
- Gong Y, Himmerkus N, Plain A, Bleich M & Hou J (2015). Epigenetic regulation of microRNAs controlling CLDN14 expression as a mechanism for renal calcium handling. J Am Soc Nephrol 26, 663–676. [DOI] [PMC free article] [PubMed] [Google Scholar]
- Greger R (1981). Cation selectivity of the isolated perfused cortical thick ascending limb of Henle's loop of rabbit kidney. Pflügers Arch Eur J Physiol 390, 30–37. [DOI] [PubMed] [Google Scholar]
- Hoorn EJ, Nelson JH, McCormick Ja & Ellison DH (2011. a). The WNK kinase network regulating sodium, potassium, and blood pressure. J Am Soc Nephrol 22, 605–614. [DOI] [PMC free article] [PubMed] [Google Scholar]
- Hoorn EJ, Walsh SB, McCormick JA, Fürstenberg A, Yang C‐L, Roeschel T, Paliege A, Howie AJ, Conley J, Bachmann S, Unwin RJ & Ellison DH (2011. b). The calcineurin inhibitor tacrolimus activates the renal sodium chloride cotransporter to cause hypertension. Nat Med 17, 1304–1309. [DOI] [PMC free article] [PubMed] [Google Scholar]
- Lazelle Ra, McCully BH, Terker AS, Himmerkus N, Blankenstein KI, Mutig K, Bleich M, Bachmann S, Yang C‐L & Ellison DH (2016). Renal deletion of 12 kDa FK506‐binding protein attenuates tacrolimus‐induced hypertension. J Am Soc Nephrol 27, 1456–1464. [DOI] [PMC free article] [PubMed] [Google Scholar]
- Maruyama J, Kobayashi Y, Umeda T, Vandewalle A, Takeda K, Ichijo H & Naguro I (2016). Osmotic stress induces the phosphorylation of WNK4 Ser575 via the p38MAPK‐MK pathway. Sci Rep 6, 18710. [DOI] [PMC free article] [PubMed] [Google Scholar]
- Mente A, O'Donnell MJ, Rangarajan S, McQueen MJ, Poirier P, Wielgosz A, Morrison H, Li W, Wang X, Di C, Mony P, Devanath A, Rosengren A, Oguz A, Zatonska K, Yusufali AH, Lopez‐Jaramillo P, Avezum A, Ismail N, Lanas F, Puoane T, Diaz R, Kelishadi R, Iqbal R, Yusuf R, Chifamba J, Khatib R, Teo K, & Yusuf S (2014). Association of urinary sodium and potassium excretion with blood pressure. N Engl J Med 371, 601–611. [DOI] [PubMed] [Google Scholar]
- Nguyen MTX, Yang LE, Fletcher NK, Lee DH, Kocinsky H, Bachmann S, Delpire E & McDonough Aa (2012). Effects of K+‐deficient diets with and without NaCl supplementation on Na+, K+, and H2O transporters’ abundance along the nephron. Am J Physiol Renal Physiol 303, F92–F104. [DOI] [PMC free article] [PubMed] [Google Scholar]
- O'Donnell M, Mente A, Rangarajan S, McQueen MJ, Wang X, Liu L, Yan H, Lee SF, Mony P, Devanath A, Rosengren A, Lopez‐Jaramillo P, Diaz R, Avezum A, Lanas F, Yusoff K, Iqbal R, Ilow R, Mohammadifard N, Gulec S, Yusufali AH, Kruger L, Yusuf R, Chifamba J, Kabali C, Dagenais G, Lear S a., Teo K, Yusuf S, PURE Investigators (2014). Urinary sodium and potassium excretion, mortality, and cardiovascular events. N Engl J Med 371, 612–623. [DOI] [PubMed] [Google Scholar]
- Paulais M, Bloch‐Faure M, Picard N, Jacques T, Ramakrishnan SK, Keck M, Sohet F, Eladari D, Houillier P, Lourdel S, Teulon J & Tucker SJ (2011). Renal phenotype in mice lacking the Kir5.1 (Kcnj16) K+ channel subunit contrasts with that observed in SeSAME/EAST syndrome. Proc Natl Acad Sci USA 108, 10361–10366. [DOI] [PMC free article] [PubMed] [Google Scholar]
- Penton D, Czogalla J & Loffing J (2015). Dietary potassium and the renal control of salt balance and blood pressure. Pflügers Arch Eur J Physiol 467, 513–530. [DOI] [PubMed] [Google Scholar]
- Piala AT, Moon TM, Akella R, He H, Cobb MH & Goldsmith EJ (2014). Chloride sensing by WNK1 involves inhibition of autophosphorylation. Sci Signal 7, ra41. [DOI] [PMC free article] [PubMed] [Google Scholar]
- Picard N, Trompf K, Yang C‐L, Miller RL, Carrel M, Loffing‐Cueni D, Fenton RA, Ellison DH & Loffing J (2014). Protein phosphatase 1 inhibitor‐1 deficiency reduces phosphorylation of renal NaCl cotransporter and causes arterial hypotension. J Am Soc Nephrol 25, 511–522. [DOI] [PMC free article] [PubMed] [Google Scholar]
- Pohl M, Kaminski H, Castrop H, Bader M, Himmerkus N, Bleich M, Bachmann S & Theilig F (2010). Intrarenal renin angiotensin system revisited: role of megalin‐dependent endocytosis along the proximal nephron. J Biol Chem 285, 41935–41946. [DOI] [PMC free article] [PubMed] [Google Scholar]
- Rabinowitz L (1996). Aldosterone and potassium homeostasis. Kidney Int 49, 1738–1742. [DOI] [PubMed] [Google Scholar]
- Reichold M, Zdebik AA, Lieberer E, Rapedius M, Schmidt K, Bandulik S, Sterner C, Tegtmeier I, Penton D, Baukrowitz T, Hulton S‐A, Witzgall R, Ben‐Zeev B, Howie AJ, Kleta R, Bockenhauer D & Warth R (2010). KCNJ10 gene mutations causing EAST syndrome (epilepsy, ataxia, sensorineural deafness, and tubulopathy) disrupt channel function. Proc Natl Acad Sci USA 107, 14490–14495. [DOI] [PMC free article] [PubMed] [Google Scholar]
- Rengarajan S, Lee DH, Oh YT, Delpire E, Youn JH & McDonough Aa (2014). Increasing plasma [K+] by intravenous potassium infusion reduces NCC phosphorylation and drives kaliuresis and natriuresis. Am J Physiol Renal Physiol 306, F1059–F1068. [DOI] [PMC free article] [PubMed] [Google Scholar]
- Richardson C, Rafiqi FH, Karlsson HKR, Moleleki N, Vandewalle A, Campbell DG, Morrice Na & Alessi DR (2008). Activation of the thiazide‐sensitive Na+‐Cl– cotransporter by the WNK‐regulated kinases SPAK and OSR1. J Cell Sci 121, 675–684. [DOI] [PubMed] [Google Scholar]
- Schweda F, Wagner C, Krämer BK, Schnermann J & Kurtz A (2003). Preserved macula densa‐dependent renin secretion in A1 adenosine receptor knockout mice. Am J Physiol Renal Physiol 284, F770–F777. [DOI] [PubMed] [Google Scholar]
- Simon DB, Nelson‐Williams C, Bia MJ, Ellison D, Karet FE, Molina aM, Vaara I, Iwata F, Cushner HM, Koolen M, Gainza FJ, Gitleman HJ & Lifton RP (1996). Gitelman's variant of Bartter's syndrome, inherited hypokalaemic alkalosis, is caused by mutations in the thiazide‐sensitive Na‐Cl cotransporter. Nat Genet 12, 24–30. [DOI] [PubMed] [Google Scholar]
- Sorensen MV, Grossmann S, Roesinger M, Gresko N, Todkar AP, Barmettler G, Ziegler U, Odermatt A, Loffing‐Cueni D & Loffing J (2013). Rapid dephosphorylation of the renal sodium chloride cotransporter in response to oral potassium intake in mice. Kidney Int 83, 811–824. [DOI] [PubMed] [Google Scholar]
- Terker AS, Yang C‐L, McCormick Ja, Meermeier NP, Rogers SL, Grossmann S, Trompf K, Delpire E, Loffing J & Ellison DH (2014). Sympathetic stimulation of thiazide‐sensitive sodium chloride cotransport in the generation of salt‐sensitive hypertension. Hypertension 64, 178–184. [DOI] [PMC free article] [PubMed] [Google Scholar]
- Terker AS, Zhang C, Erspamer KJ, Gamba G, Yang C‐L & Ellison DH (2016). Unique chloride‐sensing properties of WNK4 permit the distal nephron to modulate potassium homeostasis. Kidney Int 89, 127–134. [DOI] [PMC free article] [PubMed] [Google Scholar]
- Terker AS, Zhang C, McCormick Ja, Lazelle Ra, Zhang C, Meermeier NP, Siler Da, Park HJ, Fu Y, Cohen DM, Weinstein AM, Wang W‐H, Yang C‐L & Ellison DH (2015). Potassium modulates electrolyte balance and blood pressure through effects on distal cell voltage and chloride. Cell Metab 21, 39–50. [DOI] [PMC free article] [PubMed] [Google Scholar]
- Vallon V, Schroth J, Lang F, Kuhl D & Uchida S (2009). Expression and phosphorylation of the Na+‐Cl– cotransporter NCC in vivo is regulated by dietary salt, potassium, and SGK1. Am J Physiol Renal Physiol 297, F704–F712. [DOI] [PMC free article] [PubMed] [Google Scholar]
- Vitzthum H, Seniuk A, Schulte LH, Müller ML, Hetz H & Ehmke H (2014). Functional coupling of renal K+ and Na+ handling causes high blood pressure in Na+ replete mice. J Physiol 592, 1139–1157. [DOI] [PMC free article] [PubMed] [Google Scholar]
- Wade JB, Liu J, Coleman R, Grimm PR, Delpire E & Welling PA (2015). SPAK‐mediated NCC regulation in response to low‐K+ diet. Am J Physiol Renal Physiol 308, F923–F931. [DOI] [PMC free article] [PubMed] [Google Scholar]
- Wagner Ca, Loffing‐Cueni D, Yan Q, Schulz N, Fakitsas P, Carrel M, Wang T, Verrey F, Geibel JP, Giebisch G, Hebert SC & Loffing J (2008). Mouse model of type II Bartter's syndrome. II. Altered expression of renal sodium‐ and water‐transporting proteins. Am J Physiol Renal Physiol 294, F1373–F1380. [DOI] [PubMed] [Google Scholar]
- Weinstein AM (2012). Potassium excretion during antinatriuresis: perspective from a distal nephron model. Am J Physiol Renal Physiol 302, F658–F673. [DOI] [PMC free article] [PubMed] [Google Scholar]
- Wilson FH, Disse‐Nicodème S, Choate Ka, Ishikawa K, Nelson‐Williams C, Desitter I, Gunel M, Milford D V, Lipkin GW, Achard JM, Feely MP, Dussol B, Berland Y, Unwin RJ, Mayan H, Simon DB, Farfel Z, Jeunemaitre X & Lifton RP (2001). Human hypertension caused by mutations in WNK kinases. Science 293, 1107–1112. [DOI] [PubMed] [Google Scholar]
- Zhang C, Wang L, Zhang J, Su X‐T, Lin D‐H, Scholl UI, Giebisch G, Lifton RP & Wang W‐H (2014). KCNJ10 determines the expression of the apical Na‐Cl cotransporter (NCC) in the early distal convoluted tubule (DCT1). Proc Natl Acad Sci USA 111, 11864–11869. [DOI] [PMC free article] [PubMed] [Google Scholar]
Associated Data
This section collects any data citations, data availability statements, or supplementary materials included in this article.
Supplementary Materials
Disclaimer: Supporting information has been peer‐reviewed but not copyedited.
Table S1. Buffer content.
Table S2. Mathematical fitting.