

Abstract
Cancer cells preferentially metabolize glucose through aerobic glycolysis. This phenomenon, known as the Warburg effect, is a characteristic of glucose metabolism in cancer cells. PKM2 is reported to imply an important role in glycolysis. However, whether and how PKM2 can cause mitochondrial dysfunction, then subsequently forcing cancer cells using glycolysis instead of oxidation phosphorylation is poorly understood. Here we reported that overexpression of PKM2 disrupted mitochondrial dynamics by enhancing fusion. And PKM2 overexpression increased the expression of fusion protein Mfn2. Simultaneously, PKM2 overexpression induced mitochondrial dysfunctions shown by the decreased ATP level and increased mitochondrial DNA (mtDNA) copy number. Reduction of Mfn2 expression by siRNA attenuated the PKM2-enhanced mitochondrial fusion and restored the functions. Quantitative and morphological analyses showed that the expression of microRNA-106b (miR-106b) was decreased in the PKM2 overexpressed cells, and the reduction of Mfn2 expression and the recovery of mitochondrial functions were induced by the treatment of miR-106b mimics, demonstrating that miR-106b played important roles in the down-regulation of Mfn2 expression and the PKM2 mediation of mitochondrial fusion. Clinical investigation was performed and results showed that the higher expression levels of PKM2 corresponded with the higher expression levels of Mfn2 in breast cancer tissues by comparison of their expression in adjacent normal tissues. Taken together, our data demonstrate that the overexpression of PKM2 and Mfn2 causes mitochondrial dysfunction via enhancing mitochondrial fusion and miR-106b play crucial roles in PKM2 mediated mitochondrial function through its regulation of Mfn2 expression, which provides new insights into the molecular mechanisms underlying glycolysis and oxidative phosphorylation.
Keywords: PKM2, mitochondrial fusion, miR-106b, Mfn2
Introduction
Altered metabolism is one of the hallmarks of tumor [1]. Unlike the normal cells, cancer cells preferentially metabolize glucose by glycolysis even in the aerobic environment, which is characterized by increased glucose consumption and an elevated rate of lactate production, the phenomenon is known as the Warburg effect [2]. Because this altered metabolism can occur even in the presence of oxygen, glycolysis presumably confers a selective advantage for the survival and proliferation of cancer cells [3,4]. The rate-limiting enzymes of glycolysis are changed during tumorigenesis. Among these enzymes is pyruvate kinase (PK), which catalyzes the irreversible transphosphorylation between phosphoenolpyruvate (PEP) and adenosine diphosphate, producing pyruvate and ATP during glycolysis [3]. There are four pyruvate kinase isoenzymes: the liver-typed PK (PKL) and red blood cell PK (PKR) are encoded by the PKL and PKR gene under different promoters, respectively; M1 and M2 (PKM1 and PKM2) are produced by alternative splicing of the same primary RNA transcript of the PKM gene, which contains sequences encoded by exons 9 and 10, respectively [5,6]. PKL, PKR, and PKM1 are tissue-specific isoenzymes: PKL is expressed in the liver, kidneys and intestine and has the lowest affinity to PEP, while PKR is expressed in red blood cells, inhibited by ATP and activated by fructose-1, 6-bisphosphate (FBP). The non-allosteric isoform PKM1 is constitutively active, and expressed in terminally differentiated tissues, including the muscle and brain, which require a large supply of ATP. By contrast, PKM2 is expressed in tissues with anabolic functions, including proliferating cells and cancer cells, and is subject to complex allosteric regulation, thus PKM2 is considered an embryonic and cancer cell-specific isoform [7]. In the majority of cancer cells, the expression of PKM2 is increased, which suggests that PKM2 may involve tumorigenesis or is an attractive target for cancer therapy [8]. Recently, a large of studies documented that tumor cells may develop altered mitochondrial metabolism, resulting in inefficient aerobic respiration and a switch towards glycolytic metabolism. In the study, we wonder whether PKM2 accumulation in the tumor cell can eventually lead to mitochondrial impairments.
Mitochondria perform multiple functions that are critical to the maintenance of cellular homeostasis, for example, mitochondria generate energy by oxidative phosphorylation; participate in intermediary metabolism; and play a crucial role in iron-sulfur cluster assembly, calcium signaling, and apoptosis [9]. In recent years, it became clear that mitochondria are dynamic organelles that are regulated by continuous fusion and fission, and their balance is important for maintaining the mitochondrial morphology and functions in cell life and death [10-12]. The fusion is regulated by the mitochondrial outer membrane mitofusins Mfn1 and Mfn2, and the inner mitochondrial membrane associated protein optic atrophy type 1 (OPA1). The mitochondrial fission is regulated by the dynamin like protein 1 (Drp1) and its recruiting factors on mitochondria such as Fis1, Mff, Mid49 [13,14].
MicroRNAs (miRNA) are a class of 18-24 nucleotides noncoding RNAs that are widely expressed in multicellular organisms and regulate gene expression post-transcriptionally. They mainly function as negative regulators of gene expression through partial complementation to the 3’-untranslated region (3’-UTR) of target mRNAs [15,16]. Studies have revealed that miRNA act as either oncogenes or tumor suppressor genes and aberrant miRNA expression is associated with the development and progression of a variety of cancers [17,18]. In previous study, miR-106b was discovered to induce mitochondrial dysfunction and insulin resistance in C2C12 myotubes by targeting mitofusin-2 (Mfn2) [19].
In the present study, we demonstrated that PKM2 overexpression induced mitochondrial fusion and dysfunction charactering with decreased ATP production and increased mitochondrial DNA (mtDNA) copy number through increasing the expression of Mfn2. While as, PKM2 knockdown resulted in more fragmented mitochondria. Mechanistically, PKM2 overexpression suppressed the expression of miR-106b, subsequently resulted in the increased expression of its target of Mfn2. Additional miR-106b mimics reduced Mfn2 expression and improved mitochondrial dysfunction mediated by the overexpression of PKM2. Clinical quantitative analysis showed both PKM2 and Mfn2 overexpression existed in breast cancer tissues. Information produced in this study extends our understanding of the molecular mechanisms of mitochondrial dysfunction mediated by PKM2 overexpression.
Materials and methods
Antibodies and reagents
The RPMI 1640 medium and fetal bovine serum (FBS) were from GIBCO (Gaithersburg, MD, USA). RNAiso Plus was purchased from Takara (Shiga, Japan). TransScript First-Strand cDNA Synthesis SuperMix and TransStart Top Green qPCR SuperMix were purchased from TransGen (Beijing, China). Antibodies against PKM2 or Mfn2 were obtained from Proteintech (Chicago, USA). Antibody specific to GAPDH was from Bioworld Technology (Minneapolis, MN). Mfn2 siRNAs, miR-106b inhibitor and its mimics were purchased from GenePharma (Shanghai, China). ATP Assay Kit was purchased from Beyotime (Shanghai, China).
Cell culture and transfection
Human breast carcinoma MCF-7 cell line was cultured in RPMI-1640 medium with 10% FBS at 37°C in incubator containing 5% CO2. For transient transfection, plasmids were transfected into MCF-7 cells using Turbofect (Thermo Scientific, MA, USA) reagent according to the instruction of manufacturer.
For siRNA, miR-106b inhibitor or mimics transfection assay, cells were seeded to a 6-well plate, and 150 ng siRNA (75 nM), inhibitor or mimics were transiently transfected using HiPerFect Transfection Reagent (QIAGEN) according to the manufacturer’s protocol. The cells were collected for analysis or assays 24 or 48 h after transfection.
RNA isolation and qRT-PCR
Total RNA extraction, reverse transcription, and real-time PCR were performed as previously described [20]. The primers used in this study were listed as follows: PKM1, 5’-GAAGAACTTGTGCGAGCCT-3’ (forward) and 5’-CGTCAGAACTATCAAAGCTGC-3’ (reverse); PKM2, 5’-GCTGCCATCTACCACTTGC-3’ (forward) and 5’-CCAGACTTGGTGAGGACGATT-3’ (reverse); Mfn2, 5’-AGGTGCTCAACGCCAGGATTC-3’ (forward) and 5’-AGTCGGTCTTGCCGCTCTTCA-3’ (reverse); and GAPDH, 5’-GCACCGTCAAGGCTGAGAAC-3’ (forward) and 5’-TGGTGAAGAACGCCAGTGGA-3’ (reverse).
Western blotting analysis
The total protein was extracted and the protein concentration was determined by the BCA protein assay. An equal amount of protein was subjected to SDS-PAGE and subsequent Western blotting as previously described [20].
Observation of mitochondrial morphology
To observe mitochondrial morphology, cells were pre-incubated with 100 nM MitoTracker® Red CMXRos (Invitrogen) for 15 min fixed in 3.7% paraformaldehyde (PFA) for 15 min and permeabilized with ice-cold acetone for 5 min at room temperature. The nucleus was counterstained with DAPI. Mitochondrial morphology was observed using confocal microscopy (Olympus, Japan). The data were quantitatively analysed using Image J.
Detection of cellular ATP levels
24 h after transfection, cells were lysed and then centrifuged at 12,000 g for 5 min, then 100 μL ATP detection working dilution was added. At the same time, the standard curve was generated and the protein concentration was determined by the BCA assay. The luminance (RLU) was measured using a fluorescence microplate reader (Thermo Scientific Varioskan Flash, USA). The relative ATP level was calculated according to the following formula: relative ATP level = ATP value/protein concentration.
Quantification of mtDNA copy number
Genomic DNA was extracted from MCF-7 cells using Tissue DNA kit (OMEGA) according to manufacturer’s instructions. Relative mtDNA copy number was measured by a quantitative real-time polymerase chain reaction (PCR)-based method as previously described [21].
Luciferase reporter assay
For the luciferase reporter analysis, Mfn2 3’-UTR was subcloned into the psicheck2 vector (Promega, Madison, WI) generating a psicheck2-Mfn2-3’UTR vector. MCF-7 cells were transfected with psicheck2 or psicheck2-Mfn2-3’UTR vector together with either 50 nM of the miR-106b mimics, Negative Control mimics (N.C. mimics), miR-106b inhibitor or Negative Control inhibitor (N.C. inhibitor) using HiPerFect Transfection Reagent. After transfection for 48 h, cells were lysised and the luciferase activity was measured according to the manufacturer’s instructions. The results were normalized to the activity of the Renilla luciferase gene that is contained within the psicheck2 vector as an internal control.
Immunohistochemical analysis
A total of 60 clinical samples from patients with breast cancer were collected from the First Affiliated Hospital of Shanxi Medical University (Shanxi, China). The paraffin sections were stained with PKM2 and Mfn2 antibody. The percentage of cells was calculated by Image Pro-Plus 6.0 software.
Statistical analysis
All results were depicted as mean values ± standard deviations (SDs). The statistical software SPSS16.0 was used in data processing and analyzing. Statistical analysis of the differences was analyzed using Student’s t-test and P < 0.05 was considered as significant.
Results
PKM2 overexpression induced mitochondrial fusion and mitochondrial dysfunction
In order to study the relationship between PKM2 and mitochondria, MCF-7 cell was transfected with constructs expressing GFP, PKM1 and PKM2 individually for 24 h respectively, the expression levels of PKM1 and PKM2 were assessed by western blot (Figure 1A). The mitochondrial morphology was observed after the transfected cells staining with Mitotracker. PKM2 overexpressed cells exhibited elongated mitochondria compared with the cells overexpressing GFP or PKM1 as controls (Figure 1B). The transfected cells with fused mitochondria were quantified using confocal microscopy and Image J. The results revealed that there were about 45% elongated mitochondria in PKM2 transfected cells, which was significantly more than that in GFP or PKM1 transfected cells (Figure 1C). Moreover, mitochondrial number was significantly decreased in PKM2 transfected cells compared with GFP or PKM1 transfected cells (Figure 1D). Having known that mitochondrial dynamic balance is closely related to mitochondrial function. So we further characterized mitochondrial function by assessing ATP production and mtDNA copy number in PKM overexpressed cells. Results showed that PKM2 overexpression induced decreased ATP production and increased mtDNA copy number in comparison with cells overexpression of either GFP or PKM1 (Figure 1E and 1F). Collectively, these results demonstrated that PKM2 overexpression induced mitochondrial fusion and mitochondrial dysfunction.
Figure 1.

PKM2 overexpression induces mitochondrial fusion and mitochondrial dysfunction. A: MCF-7 cells were transfected with GFP, GFP-PKM1 or GFP-PKM2 expressed construct for 24 h, the expression levels of PKM1 and PKM2 were assessed by western blot. B: Representative images of mitochondrial morphology. MCF-7 cells were transfected with GFP, GFP-PKM1 or GFP-PKM2 expressed construct for 24 h, then the mitochondrial was stained with Mitotracker dye and the morphology was observed by confocal fluorescent microscope. The insets are amplified images of the mitochondria morphology. Scale bar = 10 µm. C: The statistical analysis of transfected cells with fused mitochondria. **P < 0.01. D: Quantitative analysis of mitochondrial number. **P < 0.01. E: ATP production is decreased in PKM2 overexpressed cells. Intracellular ATP was determined using a luciferase-based luminescence assay kit according to the manufacturer’s instructions. *P < 0.05. F: PKM2 overexpression exhibited increased mitochondrial DNA copy number. Total DNA was extracted and relative levels of mtDNA copy number (ND1) were determined by qPCR. The nuclear gene HGB was used for normalization. **P < 0.01.
PKM2 knockdown suppressed mitochondrial fusion
To verify the role of PKM2 in mitochondrial fusion, we transfected MCF-7 cells using two different shRNAs specially targeted to PKM2. As shown in Figure 2A, PKM2 expression was significantly decreased after transfected with PKM2 shRNAs. And the mitochondria were typically fragmental and appeared round upon the depletion of PKM2, compared with the elongated, tubular mitochondria detected in the control groups (Figure 2B and 2C). Correspondingly, the number of mitochondria was obviously increased (Figure 2D). What’s more, PKM2 knockdown exhibited increased ATP production and decreased mtDNA copy number (Figure 2E and 2F). All of these results indicated that PKM2 knockdown could suppress mitochondrial fusion and rescue a part of mitochondrial function.
Figure 2.
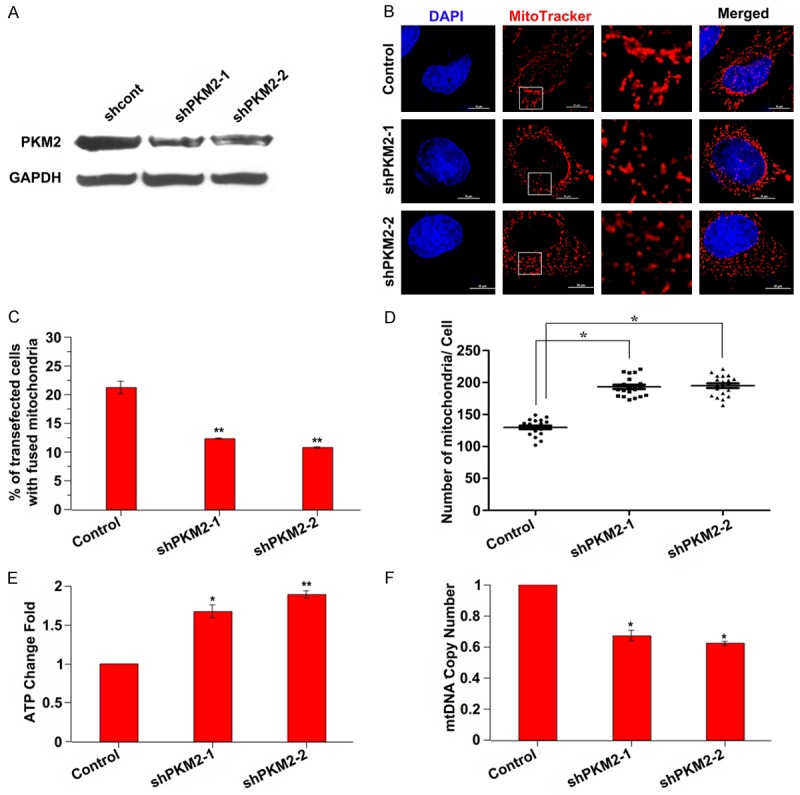
PKM2 knockdown suppresses mitochondrial fusion. A: MCF-7 cells were transfected with shcont, shPKM2-1 or shPKM2-2 for 24 h, the expression level of PKM2 was assessed by western blot. B: Representative images of mitochondrial morphology. MCF-7 cells were transfected with shcont, shPKM2-1 or shPKM2-2 for 24 h, then the mitochondrial was stained with Mitotracker dye and the morphology was observed by confocal fluorescent microscope. The insets are amplified images of the mitochondria morphology. Scale bar = 10 µm. C: The fused mitochondria is decreased in PKM2 knockdown cells. **P < 0.01. D: Quantitative analysis of mitochondrial number. *P < 0.05. E: ATP production is increased in PKM2 knockdown cells. Intracellular ATP was determined using a luciferase-based luminescence assay kit according to the manufacturer’s instructions. *P < 0.05, **P < 0.01. F: PKM2 knockdown showed decreased mitochondrial DNA copy number. Total DNA was extracted and relative levels of mtDNA copy number (ND1) were determined by qPCR. The nuclear gene HGB was used for normalization. *P < 0.05.
Mfn2 involved in PKM2-induced mitochondrial fusion
Next, we assessed the expression of Mfn2 in PKM2 overexpressed or PKM2 knockdown cells. The results revealed that Mfn2 mRNA expression level was significantly increased by approximately 4.2 folds in PKM2 overexpressed cells, but no significant change in PKM1 overexpressed cells compared to GFP cells. Consistent with altered mRNA expression, Mfn2 protein level was significantly increased in PKM2 overexpressed cells, compared to GFP or PKM1 overexpressed cells (Figure 3A). On the contrary, the mRNA expression level of Mfn2 was largely reduced in PKM2 knockdown cells. Similarly, the protein level was significantly decreased in PKM2 knockdown cells (Figure 3B). To further verify the participant role of Mfn2 in PKM2-induced mitochondrial fusion, we introduced two different siRNAs against Mfn2 into PKM2 overexpressed cells to suppress its expression. Both qPCR and western blot assays demonstrated that the siRNAs could effectively reduce Mfn2 expression (Figure 3C). In addition, the ATP production was restored following Mfn2 siRNA treatment in PKM2 overexpressed cells and mtDNA copy number was clearly diminished after Mfn2 was interfered by Mfn2 siRNA (Figure 3D and 3E). These data indicated that Mfn2 involved in the PKM2 induced mitochondrial dysfunction.
Figure 3.

Mfn2 is involved in PKM2-induced mitochondrial fusion. A: The mRNA and protein expression levels of Mfn2 are elevated in PKM2 overexpressed cells. MCF-7 cells were transfected with GFP, PKM1or PKM2 for 24 h, the expression of Mfn2 was evaluated by qPCR and western blot. **P < 0.01. B: The mRNA and protein expression levels of Mfn2 are decreased in PKM2 knockdown cells. MCF-7 cells were transfected with shcont, shPKM2-1 or shPKM2-2 for 24 h, the expression of Mfn2 was evaluated by qPCR and western blot. **P < 0.01. C: The expression of Mfn2 is decreased following Mfn2 siRNAs treatment. MCF-7 cells were co-transfected with GFP or GFP-PKM2 and Mfn2 siRNAs, then cells were harvested, the mRNA and protein expression levels of Mfn2 were analyzed by qPCR and western blot, respectively. **P < 0.01. D: The ATP production is increased in Mfn2 siRNA treatment cells. After MCF-7 cells were co-transfected with GFP or GFP-PKM2 and Mfn2 siRNAs, the ATP production was detected. *P < 0.05. E: The mtDNA copy number is decreased in Mfn2 siRNA treatment cells. After MCF-7 cells were co-transfected with GFP or GFP-PKM2 and Mfn2 siRNAs, the mtDNA copy number was detected. *P < 0.05.
MiR-106b mediated the suppression of Mfn2
It’s reported that miR-106 family plays a crucial role in regulating mitochondrial morphology [19]. Therefore, we investigated the expression of miR-106 family by qPCR. The results showed that the expression of miR-25 was decreased and miR-93 was increased in both PKM1 and PKM2 overexpressed cells. Only the expression of miR-106b was decreased in PKM2 overexpressed cells and there was no obvious change in PKM1 overexpressed cells compared with the control group (Figure 4A). Thus, we conducted the next study mainly using miR-106b.
Figure 4.
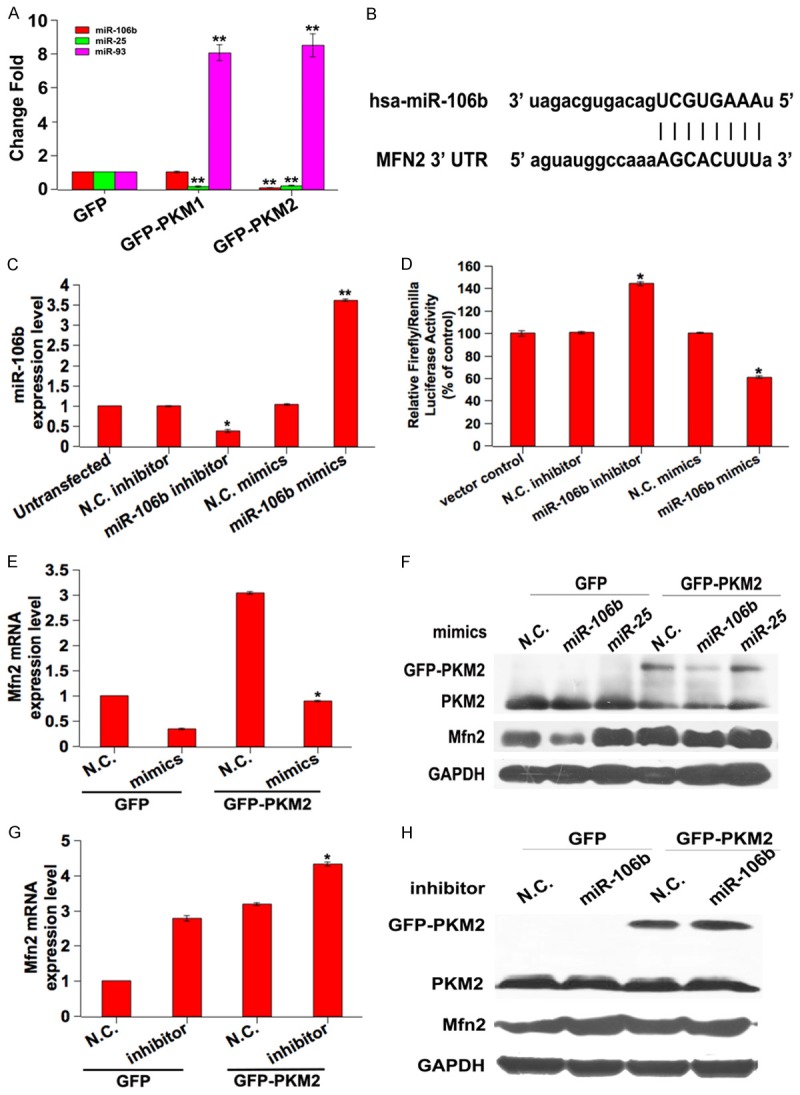
MiR-106b mediates the suppression of Mfn2. A: qPCR evaluation of the expression of miR-106b, miR-25 and miR-93 in PKM2 overexpressed cells. **P < 0.01. B: The sequence of predicted complementary pairing between miR-106b and human Mfn2 3’-UTR. C: Relative change fold of luciferase activities tested on the Mfn2 3’-UTR reporter genes. MCF-7 cells were co-transfected with the reporter vector psicheck2-Mfn2-3’UTR and miR-106b mimics or miR-106b inhibitor. After 48 h transfection, the activity of firefly luciferase was measured by the dual-luciferase reporter assay. Relative luciferase activity was normalized with Renilla luciferase activity and compared with that in the psicheck2 control. *P < 0.05. D: The expression of miR-106b was analyzed by qPCR after MCF-7 cells were transfected with miR-106b mimics or inhibitor. *P < 0.05, **P < 0.01. E and F: Mfn2 expression levels in cells co-transfected with GFP or GFP-PKM2 and miR-106b mimics were measured by qPCR and western blot, respectively. *P < 0.05. G and H: Mfn2 expression levels in cells co-transfected with GFP or GFP-PKM2 and miR-106b inhibitor were measured by qPCR and western blot, respectively. *P < 0.05.
Firstly, we used the public database-TargetScan and miRBase to predict the potential binding site between miR-106b and Mfn2, showing that miR-106b could directly bind to the 3’-UTR of Mfn2 (Figure 4B). To further assure that Mfn2 is a direct target of miR-106b, we cloned the 3’-UTR of Mfn2 into the luciferase reporter vector psicheck2. The reporter vector was co-transfection with miR-106b mimics or miR-106b inhibitor. The luciferase construct co-transfected with miR-106b mimics exhibited decreased luciferase activity, whereas reporter vector co-transfected with miR-106b inhibitor exhibited increased luciferase activity compared with the vector control and negative control (N.C.) groups (Figure 4C). These results indicate that miR-106b directly targets on the Mfn2 3’-UTR. In addition, the administration of miR-106b inhibitor decreased the endogenous level of miR-106b compared with the presence of miR-106b mimics (Figure 4D). To further confirm the underlying role of miR-106b in suppressing Mfn2, we examined Mfn2 mRNA and protein expression in the presence of either miR-106b inhibitor or mimics transfected cells using qPCR and western blotting, respectively. We observed a clear reduction in the level of endogenous Mfn2 mRNA and protein expression in miR-106b mimics transfected cells compared with N.C. transfected cells (Figure 4E and 4F). In addition, up-regulation of Mfn2 was found in the PKM2 overexpressed cells with the presence of miR-106b inhibitor compared with N.C. transfected (Figure 4G and 4H). These pieces of evidence suggested the functional role of miR-106b in suppressing Mfn2.
The functional role of miR-106b in PKM2-mediated mitochondrial function
To analyze the functional role of miR-106b in PKM2-mediated mitochondrial function, we detected the mitochondrial morphology, ATP generation and mtDNA copy number in cells transfected with GFP or GFP-PKM2 and treated with miR-106b inhibitor or its mimics. The results showed that miR-106b mimics treatment cells exhibited decreased fused mitochondria (Figure 5A and 5B). Moreover, ATP generation is increased and mtDNA copy number is decreased in miR-106b mimics treated cells (Figure 5C and 5D). All of these demonstrated that miR-106b played an important role in PKM2-mediated mitochondrial fusion.
Figure 5.

The functional role of miR-106b in PKM2-mediated mitochondrial function. A: The mitochondrial morphology in MCF-7 cells co-transfected with GFP or GFP-PKM2 and miR-106b mimics. The cells were stained with Mitotracker dye and the morphology was observed by confocal fluorescent microscope. The insets are amplified images of the mitochondria morphology. Scale bar = 10 µm. B: The fused mitochondria are decreased in miR-106b mimics treated cells. *P < 0.05, **P < 0.01. C: ATP production is increased in miR-106b mimics treated cells. Intracellular ATP was determined using a luciferase-based luminescence assay kit according to the manufacturer’s instructions. *P < 0.05. D: MiR-106b mimics treated cells showed decreased mitochondrial DNA copy number. Total DNA was extracted and relative levels of mtDNA copy number (ND1) were determined by qPCR. The nuclear gene HGB was used for normalization. *P < 0.05, **P < 0.01.
Expression of PKM2 is positively correlated with Mfn2 expression in clinical samples
Previous studies demonstrate that PKM2 is frequently highly expressed in tumor cells [22]. To verify the relationship between PKM2 and Mfn2 in vivo, we investigated the expression of PKM2 and Mfn2 in 60 clinical samples from patients with breast cancer. At first, we analyzed the expression of PKM2 in tissues containing breast cancer and adjacent normal tissues by immunohistochemistry. Consistent with previous studies, PKM2 is highly expressed in tumor tissues than that in the adjacent normal tissues (Figure 6A and 6B). Furthermore, Mfn2 expression level in breast cancer tissues with high PKM2 expression was higher than that of normal tissues with low PKM2 expression, and vice versa. All of these further confirmed that there exists a positive correlation between the expression of PKM2 and Mfn2 (Figure 6C and 6D).
Figure 6.

Expression of PKM2 is positively correlated with Mfn2 expression in clinical samples. A: PKM2 expression was determined by IHC. Representative images of strong/weak staining in clinical samples of breast cancer and negative staining in the nontumorous samples were showed. B: The statistical analysis of PKM2 expression. **P < 0.01. C: The relationship of PKM2 and Mfn2 in clinical samples was determined by IHC. Representative immunohistochemical images of PKM2 and Mfn2 were showed. D: The statistical analysis of the correlation between PKM2 and Mfn2. **P < 0.01. E: The schematic of PKM2 regulating mitochondria dysfunction. PKM2 overexpression suppressed the expression of miR-106b, subsequently increased the expression of its target of Mfn2, eventually resulting in decreased ATP level and increased mtDNA copy number.
Discussion
Glycolysis is the predominant metabolism pathway of cancer cells [23]. It has been debated whether Warburg effect is the consequence of mitochondrial dysfunction. PK is a key enzyme that determines glycolytic activity. PKM2 controls the final and rate-limiting reaction in the glycolytic pathway. Cancer cells express high levels of the less efficient embryonic PKM2, resulting in the reduced production of ATP [7]. Mfn2 heavily involves mitochondrial fusion, and PKM2 plays a crucial role in the Warburg effect leading mitochondrial dysfunction and therefore promotes tumorigenesis. It is not well-understood mechanisms underlying mitochondrial impairments or dysfunction with aberrant PKM2 expression, and it is not known if there is any association between Mfn2 and PKM2 in mitochondrial fusion.
The delicate balance between mitochondrial fission and fusion affects mitochondrial morphology and function [24]. Through the two opposing forces of fission and fusion, mitochondria can change its size, shape and position in a few seconds [25]. Fusion can attenuate stress by mixing the contents of partially damaged mitochondria as a form of complementation. Fission is not only to create new mitochondria, but it is also to contribute to quality control by removing the damaged mitochondria [26]. Fission and fusion also help mitochondria to change their cytosolic localization, like to accumulate where high amounts of ATP required, or where Ca2+ signaling needed to be regulated [27]. Overexpression of PKM2 in vitro was performed and results showed that apparent elongated and perinuclear accumulation of mitochondria were observed, simultaneously, the decrease of ATP generation and increase of mtDNA copy number occurred upon overexpression of PKM2, demonstrating the aberrant high expression of PKM2 induce more mitochondrial fusion, which breaks the balance between fusion and fission and causes mitochondrial dysfunction.
Mfn2 localizes on the outer mitochondrial membrane, acts a mitochondrial fusion protein to participates in mitochondrial fusion, regulates mitochondrial morphology and function, and contributes to the maintenance of the mitochondrial network in mammalian cells [28,29]. Here we have identified the involvement of Mfn2 in the PKM2-induced mitochondrial dysfunction, which was given by the PKM2-induced increase of Mfn2 expression and the reduction of Mfn2 restored these mitochondrial functions. Similarly, PKM2 knockdown resulted in the decreased expression of Mfn2, which elevated ATP production and decreased mtDNA copy number. Mechanistically, we found that PKM2 suppressed the expression of miR-106b, then contributing to the elevation of Mfn2 (Figure 6E). On the basis of the mitochondrial fusion activity of Mfn2, the alterations in mitochondrial morphology and function detected upon silencing or ablation of its gene have been attributed to the reduction of mitochondrial fusion [30,31]. Interestingly, data given here show that aberrant high expression of Mfn2 also induces the increased mitochondrial fusion and causes mitochondrial dysfunction.
Induction of more mitochondrial fusion by the overexpression of PKM2 and the aberrant high expression of Mfn2 tip the balance of these processes toward excessive fusion that due to enhanced mitochondrial fusion and reduced mitochondrial fission. The increased level of mitochondrial fusion protein Mfn2 in the PKM2 overexpression system in vitro correlates mitochondrial dysfunction, which is consistent with our prior observation (in the pressing), in which the expression of Drp1 is decreased. Previous studies indicate that mitochondrial fusion is cell survival protection, leading to the exchange of mitochondrial DNA, reorganization of mitochondrial cristae, and protection of cells from apoptosis, whereas mitochondrial fission seems a sign of apoptosis [32-34]. It’s documented that high expression of PKM2 promotes the development and survival of tumors. Here, we find that overexpression of PKM2 increases the expression of Mfn2, which is consistent with the previous reports.
Numerous studies have shown that miRNA plays an important role in regulating mitochondrial morphology and function. MiR-499 has been reported to regulate mitochondrial dynamics by targeting calcineurin and dynamin-related protein-1 [35]. In addition, Sudha Bucha et al. reported that increased expression of miR-214 observed in HD cell model could target Mfn2, altered mitochondrial morphology and deregulated cell cycle [36]. Furthermore, it’s reported that miR-30 family members are able to inhibit mitochondrial fission through suppressing the expression of p53 and its downstream target Drp1 [37]. Results of experiments performed in our lab elucidate the important roles of miR-106b in regulating mitochondrial morphology and functions through targeting the fusion protein Mfn2: PKM2 overexpression reduces the level of miR-106b, subsequently promotes the expression of it’s target Mfn2, and eventually results in more mitochondrial fusion. In this study, the correlated aberrant high expression of PKM2 and Mfn2 in mitochondrial dysfunction not only has been experimentally demonstrated by analyses of mitochondrial functions in PKM2 overexpression in vitro system, but also are verified by quantifying in clinical samples from patients with breast cancer, and its aberrant high expression affecting mitochondrial function. In addition, an important role of miR-106b in the regulation of Mfn2 has been clearly illustrated by the application of miR-106b inhibitor and miR-106b mimics in vitro models. Results presented in this study provide the first line of evidence that high expression of PKM2 and aberrant Mfn2 expression (no matter extreme low or high levels) cause mitochondrial dysfunction, and miR-106b plays important role in mitochondrial fusion.
Conclusion
Taken together, the present study implies that the high expression of PKM2 results in an enhanced mitochondrial fusion with mitochondrial dysfunction. Mechanistically, PKM2 overexpression results in decreased expression of miR-106b, subsequently elevates the expression of its target mitofusion protein Mfn2. Moreover, the positive correlation between PKM2 and Mfn2 expression in cancer cells is further verified in clinical samples from patients with breast cancer. Data and results presented in this study enriches our understanding of the molecular mechanisms of mitochondrial dysfunction mediated by PKM2 and Mfn2 aberrant high expression, providing useful information on the potential applications for cancer therapy.
Acknowledgements
This work was supported by the National Natural Science Foundation of China (Grant No. 31271516), the Scholarship Council of Shanxi Province, China (Grant No. 2015-2), the R&D Infrastructure and Facility Development Program of Shanxi Province (Grant No. 2015091015), Zhejiang Province Science Foundation (Grant No. LY15H280008) to Pro. Zhuoyu Li, the Scientific and Technological Innovation Programs of Higher Education Institutions in Shanxi (Grant No. 2015175, 2016121).
Disclosure of conflict of interest
None.
References
- 1.Sun Q, Chen X, Ma J, Peng H, Wang F, Zha X, Wang Y, Jing Y, Yang H, Chen R, Chang L, Zhang Y, Goto J, Onda H, Chen T, Wang MR, Lu Y, You H, Kwiatkowski D, Zhang H. Mammalian target of rapamycin up-regulation of pyruvate kinase isoenzyme type M2 is critical for aerobic glycolysis and tumor growth. Proc Natl Acad Sci U S A. 2011;108:4129–4134. doi: 10.1073/pnas.1014769108. [DOI] [PMC free article] [PubMed] [Google Scholar]
- 2.Hsu PP, Sabatini DM. Cancer cell metabolism: Warburg and beyond. Cell. 2008;134:703–7. doi: 10.1016/j.cell.2008.08.021. [DOI] [PubMed] [Google Scholar]
- 3.Hockenbery DM. The Warburg Effect and Beyond: Metabolic Dependencies for Cancer Cells. 2013:35–51. [Google Scholar]
- 4.Vander Heiden MG, Cantley LC, Thompson CB. Understanding the Warburg effect: the metabolic requirements of cell proliferation. Science. 2009;324:1029–33. doi: 10.1126/science.1160809. [DOI] [PMC free article] [PubMed] [Google Scholar]
- 5.Wong N, De Melo J, Tang D. PKM2, a Central Point of Regulation in Cancer Metabolism. Int J Cell Biol. 2013;2013:242513. doi: 10.1155/2013/242513. [DOI] [PMC free article] [PubMed] [Google Scholar]
- 6.Gupta V, Bamezai RN. Human pyruvate kinase M2: a multifunctional protein. Protein Sci. 2010;19:2031–44. doi: 10.1002/pro.505. [DOI] [PMC free article] [PubMed] [Google Scholar]
- 7.Mazurek S. Pyruvate kinase type M2: a key regulator of the metabolic budget system in tumor cells. Int J Biochem Cell Biol. 2011;43:969–80. doi: 10.1016/j.biocel.2010.02.005. [DOI] [PubMed] [Google Scholar]
- 8.Christofk HR. The M2 splice isoform of pyruvate kinase is important for cancer metabolism and tumour growth. Nature. 2008;452:230–3. doi: 10.1038/nature06734. [DOI] [PubMed] [Google Scholar]
- 9.Laforge M. NF-kappaB pathway controls mitochondrial dynamics. Cell Death Differ. 2016;23:89–98. doi: 10.1038/cdd.2015.42. [DOI] [PMC free article] [PubMed] [Google Scholar]
- 10.Chan DC. Fusion and fission: interlinked processes critical for mitochondrial health. Annu Rev Genet. 2012;46:265–87. doi: 10.1146/annurev-genet-110410-132529. [DOI] [PubMed] [Google Scholar]
- 11.Li XC. Human wild-type full-length tau accumulation disrupts mitochondrial dynamics and the functions via increasing mitofusins. Sci Rep. 2016;6:24756. doi: 10.1038/srep24756. [DOI] [PMC free article] [PubMed] [Google Scholar]
- 12.Guillery O. Modulation of mitochondrial morphology by bioenergetics defects in primary human fibroblasts. Neuromuscul Disord. 2008;18:319–30. doi: 10.1016/j.nmd.2007.12.008. [DOI] [PubMed] [Google Scholar]
- 13.Liesa M, Shirihai OS. Mitochondrial dynamics in the regulation of nutrient utilization and energy expenditure. Cell Metab. 2013;17:491–506. doi: 10.1016/j.cmet.2013.03.002. [DOI] [PMC free article] [PubMed] [Google Scholar]
- 14.Gao AW, Canto C, Houtkooper RH. Mitochondrial response to nutrient availability and its role in metabolic disease. EMBO Mol Med. 2014;6:580–9. doi: 10.1002/emmm.201303782. [DOI] [PMC free article] [PubMed] [Google Scholar]
- 15.Xuan Y. MicroRNAs in colorectal cancer: small molecules with big functions. Cancer Lett. 2015;360:89–105. doi: 10.1016/j.canlet.2014.11.051. [DOI] [PubMed] [Google Scholar]
- 16.Arora A. Interplay Between Metabolism and Oncogenic Process: Role of microRNAs. Transl Oncogenomics. 2015;7:11–27. doi: 10.4137/TOG.S29652. [DOI] [PMC free article] [PubMed] [Google Scholar]
- 17.Bartel DP. MicroRNAs: Genomics, Biogenesis, Mechanism, and Function. Cell. 2004;116:281–297. doi: 10.1016/s0092-8674(04)00045-5. [DOI] [PubMed] [Google Scholar]
- 18.Shenouda SK, Alahari SK. MicroRNA function in cancer: oncogene or a tumor suppressor. Cancer Metastasis Rev. 2009;28:369–78. doi: 10.1007/s10555-009-9188-5. [DOI] [PubMed] [Google Scholar]
- 19.Zhang Y. MicroRNA-106b induces mitochondrial dysfunction and insulin resistance in C2C12 myotubes by targeting mitofusin-2. Mol Cell Endocrinol. 2013;381:230–40. doi: 10.1016/j.mce.2013.08.004. [DOI] [PubMed] [Google Scholar]
- 20.Wu H. PKM2 depletion induces the compensation of glutaminolysis through beta-catenin/c-Myc pathway in tumor cells. Cell Signal. 2014;26:2397–405. doi: 10.1016/j.cellsig.2014.07.024. [DOI] [PubMed] [Google Scholar]
- 21.Xing J. Mitochondrial DNA content: its genetic heritability and association with renal cell carcinoma. J Natl Cancer Inst. 2008;100:1104–12. doi: 10.1093/jnci/djn213. [DOI] [PMC free article] [PubMed] [Google Scholar]
- 22.Zhang B, Chen JY, Chen DD, Wang GB, Shen P. Tumor type M2 pyruvate kinase expression in gastric cancer, colorectal cancer and controls. World J Gastroenterol. 2004;10:1643–1646. doi: 10.3748/wjg.v10.i11.1643. [DOI] [PMC free article] [PubMed] [Google Scholar]
- 23.Dang CV. Links between metabolism and cancer. Genes Dev. 2012;26:877–90. doi: 10.1101/gad.189365.112. [DOI] [PMC free article] [PubMed] [Google Scholar]
- 24.Chan DC. Mitochondria: dynamic organelles in disease, aging, and development. Cell. 2006;125:1241–52. doi: 10.1016/j.cell.2006.06.010. [DOI] [PubMed] [Google Scholar]
- 25.Bereiter-Hahn J, Voth M. Dynamics of mitochondria in living cells: shape changes, dislocations, fusion, and fission of mitochondria. Microsc Res Tech. 1994;27:198–219. doi: 10.1002/jemt.1070270303. [DOI] [PubMed] [Google Scholar]
- 26.Youle RJ, van der Bliek AM. Mitochondrial fission, fusion, and stress. Science. 2012;337:1062–5. doi: 10.1126/science.1219855. [DOI] [PMC free article] [PubMed] [Google Scholar]
- 27.Campello S, Scorrano L. Mitochondrial shape changes: orchestrating cell pathophysiology. EMBO Rep. 2010;11:678–84. doi: 10.1038/embor.2010.115. [DOI] [PMC free article] [PubMed] [Google Scholar]
- 28.de Brito OM, Scorrano L. Mitofusin 2: a mitochondria-shaping protein with signaling roles beyond fusion. Antioxid Redox Signal. 2008;10:621–33. doi: 10.1089/ars.2007.1934. [DOI] [PubMed] [Google Scholar]
- 29.Chen H. Mitofusins Mfn1 and Mfn2 coordinately regulate mitochondrial fusion and are essential for embryonic development. J Cell Biol. 2003;160:189–200. doi: 10.1083/jcb.200211046. [DOI] [PMC free article] [PubMed] [Google Scholar]
- 30.Bach D. Mitofusin-2 determines mitochondrial network architecture and mitochondrial metabolism. A novel regulatory mechanism altered in obesity. J Biol Chem. 2003;278:17190–7. doi: 10.1074/jbc.M212754200. [DOI] [PubMed] [Google Scholar]
- 31.Chen H, Chomyn A, Chan DC. Disruption of fusion results in mitochondrial heterogeneity and dysfunction. J Biol Chem. 2005;280:26185–92. doi: 10.1074/jbc.M503062200. [DOI] [PubMed] [Google Scholar]
- 32.Lee YJ, Jeong SY, Karbowski M, Smith CL, Youle RJ. Roles of the Mammalian Mitochondrial Fission and Fusion. Mol Biol Cell. 2004;15:5001–5011. doi: 10.1091/mbc.E04-04-0294. [DOI] [PMC free article] [PubMed] [Google Scholar]
- 33.Chen H. Mitochondrial fusion is required for mtDNA stability in skeletal muscle and tolerance of mtDNA mutations. Cell. 2010;141:280–9. doi: 10.1016/j.cell.2010.02.026. [DOI] [PMC free article] [PubMed] [Google Scholar]
- 34.Chen KH. Role of mitofusin 2 (Mfn2) in controlling cellular proliferation. FASEB J. 2014;28:382–94. doi: 10.1096/fj.13-230037. [DOI] [PMC free article] [PubMed] [Google Scholar]
- 35.Wang JX. miR-499 regulates mitochondrial dynamics by targeting calcineurin and dynamin-related protein-1. Nat Med. 2011;17:71–8. doi: 10.1038/nm.2282. [DOI] [PubMed] [Google Scholar]
- 36.Bucha S, Mukhopadhyay D, Bhattacharyya NP. Regulation of mitochondrial morphology and cell cycle by microRNA-214 targeting Mitofusin2. Biochem Biophys Res Commun. 2015;465:797–802. doi: 10.1016/j.bbrc.2015.08.090. [DOI] [PubMed] [Google Scholar]
- 37.Li J, Donath S, Li Y, Qin D, Prabhakar BS, Li P. miR-30 regulates mitochondrial fission through targeting p53 and the dynamin-related protein-1 pathway. PLoS Genet. 2010;6:e1000795. doi: 10.1371/journal.pgen.1000795. [DOI] [PMC free article] [PubMed] [Google Scholar]