

Abstract
Accurate sampling of conformational space and, in particular, the transitions between functional substates has been a challenge in molecular dynamic (MD) simulations of large biomolecular systems. We developed an Elastic Network Model (ENM)-based computational method, ClustENM, for sampling large conformational changes of biomolecules with various sizes and oligomerization states. ClustENM is an iterative method that combines ENM with energy minimization and clustering steps. It is an unbiased technique, which requires only an initial structure as input, and no information about the target conformation. To test the performance of ClustENM, we applied it to six biomolecular systems: adenylate kinase (AK), calmodulin, p38 MAP kinase, HIV-1 reverse transcriptase (RT), triosephosphate isomerase (TIM), and the 70S ribosomal complex. The generated ensembles of conformers determined at atomic resolution show good agreement with experimental data (979 structures resolved by X-ray and/or NMR) and encompass the subspaces covered in independent MD simulations for TIM, p38, and RT. ClustENM emerges as a computationally efficient tool for characterizing the conformational space of large systems at atomic detail, in addition to generating a representative ensemble of conformers that can be advantageously used in simulating substrate/ligand-binding events.
INTRODUCTION
Protein functions such as substrate binding, allosteric signaling and molecular machinery require conformational flexibility while maintaining specificity. This dual requirement poses a challenging problem in assessing their mechanisms of interactions. It is now accepted that the native “state” consists of multiple substates being stabilized under different conditions or at different stages of biological function. Efficient computational algorithms are necessary to investigate the conformational space accessible to proteins to accomplish their functions near native state conditions, shortly termed “the essential subspace” and the most probable paths (or mechanisms) of reconfiguration in this subspace. The data generated by these approaches would complement those conformations captured by experimental techniques which provide a glimpse of conformational variability. Computational methods are particularly needed for exploring the mechanics of large systems.1
Among atomistic computations, molecular dynamics (MD) simulations have been most broadly used for studying protein motions due to their ability to yield time-resolved data based on atomic force fields. Even though cutting-edge technologies have significantly accelerated molecular trajectory generation,2–5 MD simulations still fall short of reaching the time and length scales of many biological processes of interest, especially for large systems. Moreover, additional refinements of parameters are presumably needed so as to accurately reproduce long-term structural dynamics.2,6,7 Another issue is the limited conformational sampling ability of MD due to slow crossing of energy barriers.8,9 To overcome this problem, enhanced sampling methods have been developed, such as targeted MD,10 accelerated MD,11 metadynamics,12 and replica-exchange MD.13 The basic idea in the majority of these methods has been to smooth out the energy landscape with a biasing potential. Coarse-grained (CG) MD emerged as another useful approach especially for simulating large biomolecules, although the parametrization of the force field for CG models has been a challenge.14,15 A recent review invited attention to the utility of adopting an ENM-based CG scheme for efficient mapping of conformational space.16
Normal mode analysis (NMA) has seen a revival in the past decade, with the realization of the robustness of the softest modes of motions (those at the lowest frequency end of the mode spectrum, also called the global modes) and their functional relevance.17 In a strict sense, NMA with a classical force field analyzes the vibrational motions of a structure in the close neighborhood of its energy minimum. However, NMA-based hybrid techniques have been advantageously used for investigating transitions between substates separated by low energy barriers.18–23 While these studies showed remarkable success, the increased computational cost with increased system size has been a drawback for applying “classical” NMA in the presence of an atomic force field.7 ENMs coupled with NMA emerged as alternative,24 computationally efficient tools for exploring collective dynamics as well as supramolecular machinery.25
Among ENMs, the ANM, a residue-based network model where all residue pairs within a cutoff distance rc are linked by uniform springs,26–28 has proven to be particularly useful. The observation that the soft modes predicted by the ANM correlate with experimentally observed conformational transitions28–31 greatly promoted their usage in the past decade. A strategy has been to take the native structure as a starting point and search for alternative conformations along its normal modes. Such alternative forms (generated for unbound proteins) were shown to closely resemble the conformations that would be stabilized upon ligand/substrate binding,32–34 leading to the concept of a pre-existing “intrinsic dynamics” that facilitates binding and allosteric regulation. It is now widely established that soft modes usually indicate directions of functional reconfigurations.25 ENM has been also widely used in targeted/biased sampling, when the end conformer is available.9,35–49 We have recently shown how ensemble docking of ligands to biomolecular systems that enjoy high conformational flexibility can be facilitated using ENMs.50
In this study, we introduce ClustENM, an ENM-based methodology for unbiased sampling of the essential subspace of conformations accessible to a given structure. This subspace is spanned by soft ANM modes. Basically, the native structure is deformed along linear combinations of these low-frequency modes; the generated conformers are then clustered to construct representative substates. These are used as starting points for a new generation of conformers, after subjecting them to energy minimization in implicit solvent model to obtain relaxed structures at atomic resolution. The procedure is repeated for several generations so as to allow for sufficiently large excursions from the original energy minimum. The biophysical realism of the generated substates is assessed by benchmarking them against conformations known from experiments. Comparison with experimental data supports the utility of ClustENM as an efficient method for assessing the range and type of structural adaptability that a given protein can potentially exploit during its interactions with ligands and other proteins in the cell. Application to 70S ribosome (with a molecular mass above 2 MDa) further illustrates the utility of the method for exploring the conformational space of supramolecular machines.
MATERIALS AND METHODS
Development of the ClustENM Methodology
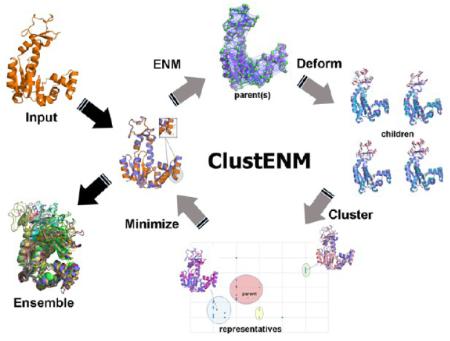
A schematic description of the ClustENM protocol is presented in Figure 1, and summarized below. The basic idea is to construct several generations of conformers, each at full atomic resolution, starting from the original structure modeled as an ANM. Below, we describe the first generation; the same procedure applies to all representative conformers (off-springs of the starting structure(s)) obtained at the end of this generation, each constituting a new starting point for the next generation.
Figure 1.

ClustENM workflow for conformer generation.
1. Energy Minimization of the Starting Structure
This is done using established methods with detailed force field and parameters, as described in the Supporting Information. The resulting conformation (of N residues) is represented by a 3N-dimensional vector R0 composed of the coordinates of its N nodes. A modified version (mixed resolution ENM)51 of the standard ANM26,27 is adopted, where the nodes are placed at the residue centroids. Node pairs within rc = 10 Å are connected by elastic springs. The spring constants connecting these low resolution node pairs are proportional to the total number of interacting atom pairs between the connected residues (bonded or nonbonded) within the specified cutoff.
2. Computation of m Softest Modes
The shapes and frequencies of m modes at the lowest frequency end of the spectrum are obtained as the respective eigenvectors (uj) and eigenvalues (λj) (1 ≤ j ≤ m) of the ANM Hessian H, using the package BLZPACK52 and the block Lanczos algorithm.53 Each eigenvector uj represents a unit directional vector (or coordinate axis) in the 3N-6 dimensional space of internal conformations, and the inverse frequency () scales with the displacement along that coordinate.
3. Combinatorial Use of Soft Modes toward Generating Alternative Conformers
We consider all possible combinations of the m slowest modes, taken 1, 2, .., and m at a time, weighted by their frequency to reflect the contribution of individual modes. An exhaustive set of 3m linear combinations,54 referred to as weighted directional vectors vi, is generated by selecting one of the three possible coefficients aji = −1, 0, or 1 for each mode j, i.e.,
| (1) |
where i is the conformation index 1 ≤ i ≤ 3m. Because the number of conformations grows as 3m, a relatively small number of modes (e.g., m = 3–5) is adopted. The precise number is determined based on the dispersion of slow modes to ensure that the softest modes exhibiting comparable frequencies are included (Table S1).
4. Evaluation of the New Generation of 3m Conformations
| (2) |
where di is the conformational difference vector defined as
| (3) |
Here, vm is the reference (maximal) deformation magnitude corresponding to aji = 1 for all modes j, and s scales the step size in the conformational subspace. As discussed below, s is optimized to ensure a broad coverage of the space while avoiding unphysical deformations (which may not even be amenable to correction/relaxation by energy minimization).
Equation 3 is derived based on the definition of root-mean-square deviation (RMSD) between the atoms of two conformations. See the Supporting Information for its derivation.
5. Clustering
The conformers Ri (1 ≤ i ≤ 3m) are clustered using the kclust module of MMTSB tool set,55 based on mutual RMSD values. RMSD cutoff for clusters is set to 0.75 s. This process yields k clusters, each defining a substate.
6. Selection of a Representative Conformer for Each Cluster/Substate
The conformer with the lowest RMSD with respect to the average structure in each cluster is selected as the “representative” conformer, which will be carried over to the subsequent generation cycle. Thus, we end up with k new substates, each of which serve as a starting point for the second generation of conformers, and so on. The weight of each representative conformer is calculated based on the size of the cluster it belongs to, normalized with respect to the total number of conformers generated before clustering.
In Step 3, the choice of aji = 0 (eq 1) for all eigenvectors carries the “parent” conformer into the pool of next-generation conformers. In fact, the parent conformer is clustered together with other deformed conformers, so that the information on parents is retained in the final generation.
Data Set and Parameters
Data Set
We generated the ANM-based essential subspace for five proteins that have been widely studied (calmodulin (CAM), adenylate kinase (AK), HIV-1 reverse transcriptase (RT), p38 kinase (p38), and triosephosphate isomerase (TIM)) and a supramolecular structure, the 70S bacterial ribosome. Table 1 lists the sizes (column 2) and PDB codes (column 7) of the structures used as input (see also Figure S1). AK was selected as a case study to establish the method and parameters. CAM, RT, p38, and TIM were selected due to the availability of sufficient experimental and/or computational data to test/benchmark ClustENM predictions, and the 70S ribosome is explored for illustrating the applicability to a supramolecular system. The number of available PDB structures for each case (which share at least 90% sequence identity) is listed in the last column. For a complete list of PDB structures used in this work, please refer to Table S2.
Table 1.
Data Set of Proteins Used for ClustENM omputations
| protein/complex | N | s(Å) | m | no. of conformersa | g | initial | no. of exp. structuresb |
|---|---|---|---|---|---|---|---|
| adenylate kinase (AK) | 214 | 2 | 3 | 71 | 5 | 4ake58 | 10c |
| 226 | 5 | 1ake59 | |||||
| 222 | 5 | closed-NMP | |||||
| 113 | 5 | closed-LID | |||||
| calmodulin (CAM) | 144 | 3 | 3 | 195 | 5 | 1cll60 | 550 |
| HIV-1 reverse transcriptase (RT) | 958 | 2 | 5 | 50 | 2 | 1rtj61 | 155 |
| p38 kinase (p38) | 345 | 1 | 5 | 41 | 2 | 1p3862 | 221 |
| triosephosphate isomerase (TIM) | 497 | 1 | 3 | 24 | 2 | 1tcd63 | 16 |
| 70S ribosome | 11,336 | 3 | 5 | 101 | 2 | 4kdk–4kdj64 | 27d |
Number of representative conformers generated by the end of the gth generation is reported.
Number of PDB structures that share 90% sequence identity with respect to the initial structure. Prior to PCA, we used ProDy65 to structurally align these PDB structures for calmodulin, p38 kinase, RT, and TIM.
For AK, the number of experimental structures with >90% sequence identity with respect to 4ake/1ake is equal to 10. Apart from 4ake, all of these structures are fully closed, similar to 1ake.
Only for 70S ribosome, the similarity between the generated structures is assessed based on the RMSD from the experimental structures.
Parameters
The protocol requires the use of three parameters: the number of collective modes (m), the number of generations (g), and the step size (s) (Table 1). These are selected based on the following considerations: (1) generation of a sufficiently diverse set of conformers; this requires the adoption of higher m, g, and s, (2) avoiding excessive computing time (which limits m and g), and (3) avoiding unphysical deformations hence smaller s. For example, the choice of m = 10 modes, leads 310 = 59,049 conformations for each starting conformation, which is computationally demanding for clustering and minimization, and the increased number of conformations may even depart from the essential subspace, especially for small proteins.
In this study, the decision on m was based on the jump between the eigenvalues of the slowest modes, i.e., we selected those global modes whose frequencies were relatively close to each other starting from the lowest frequency end (bold entries in Table S1). This criterion led to m = 3 in AK, CAM, and TIM, and 5 in RT, p38, and 70S. As to the number of generations, we adopted g = 2 and 5, as a trade-off between computational efficiency and conformational diversity (departure from the original state). In the case of the highly flexible AK and CAM, g = 5 was adopted to generate the diverse conformations observed experimentally.
The choice of s differs according to the examined system type. In principle, s should be sufficiently small to avoid unrealistic deformation during the evaluation of di and sufficiently large to allow for reasonable excursions in the conformational space. TIM and p38 show relatively localized motions, therefore s was set to 1 Å, whereas s was set to 2 or 3 Å in other systems, taking into account their larger domain movements. Using even larger s values may introduce excessive distortions that cannot be optimized during energy minimization (results not shown). An initial estimate on the degree of conformational change by methods described elsewhere56,57 can provide guidance about whether lower or higher values of s should be adopted during conformer generation.
RESULTS AND DISCUSSION
Adenylate Kinase
AK is a phosphotransferase that catalyzes the interconversion of ATP and AMP into two ADP molecules, and as such, it plays an important role in cellular energy homeostasis. AK consists of three domains: the LID, the NMP domain also called the AMP-binding domain, and the CORE. The LID and NMP undergo large conformational changes (~7 Å from fully open to fully closed) around the CORE to seclude the substrates from the environment. The open and closed states of AK are accessible even in the absence of ligand, as suggested by single-molecule FRET experiments66,67 and computations.68
We explored the conformational space of AK starting from two different crystal structures resolved in the fully open (PDB id: 4ake), and fully closed (PDB id: 1ake) states. We also repeated the computations starting from the open/closed states: closed-LID (open NMP) and closed-NMP (open LID) of the same structures generated in our simulations. We refer to these four cases as substates (of the native state). Although there are crystal structures that are stabilized in the closed-LID and closed-NMP states,69,70 these were not included in our analysis because of their low (<50%) sequence identities with respect to 1ake and 4ake.
Figure 2a displays the clusters of conformations obtained at the end of the fifth generation. These were initiated using four distinct substates (designated by open squares), each cluster being color-coded by the starting substate. For clarity, we display the conformers in the space spanned by two order parameters, the LID-CORE and NMP-CORE angles (Figure 2b), that describe the relative positions of the three domains.71 Representative conformers of each cluster are shown by a dot, the diameter of which is proportional to the cluster size (weight). Even though each independent simulation preferentially samples the quadrant closer to its starting structure, there are large overlaps sampled by multiple runs. These data are merged into a single contour (Figure 2c), color-coded according to overall weights of the conformers. The conformers cover a broader range of NMP-CORE and LID-CORE angles than those (40°–75° and 100°–155°, respectively) obtained in the free energy surface reported by Beckstein et al.71 Notably, the highly populated regions in the currently predicted energy surface correspond to the lowest free energy regions in the mentioned study.
Figure 2.

Essential subspace of AK. (a) Representative conformers (dots) are displayed as a function of NMP-CORE and LID-CORE angles. The clusters are generated using different starting structures, fully closed, fully open, closed-LID, and closed-NMP (indicated by the open squares). Dot diameters are proportional to the size (weight) of the clusters represented by these conformers. Different colors refer to distinct starting structures. (b) Definition of the angles.71 (c) Representative probability distribution surface. The highly populated regions are colored red and not-populated regions (zero weight) are in blue. (d) Accessible substates when the starting structure is selected as fully open, fully closed, closed-LID, or closed-NMP (LID is shown in blue, NMP in red). Filled arrow represents the existence of generated conformers that are close to the end state (at the tip of the arrow) by an RMSD less than 3 Å. Empty/gray arrows imply a similar situation but with an RMSD less than 4 Å and greater than 3 Å. Detailed analysis as RMSD histograms is given in Figure S2.
Figure 2c also reveals that the region around the fully open substate (NMP-CORE: 74°, LID-CORE: 146°) is not highly populated. This is in agreement with studies stating that fully open state of the apo enzyme is not energetically 36,42,71,72 Beside the closed-LID and closed-NMP intermediate substates, there is an additional half open/half-closed conformer in Figure 2c, which is highly populated (NMP-CORE: 55°–60°, LID-CORE: 115°–120°). This conformation was detected in both experimental and computational studies68 and proposed to be an intermediate in the transition pathway between the open and closed substates of the enzyme.
The sampled regions in Figure 2c are in agreement with those visited in transition pathways studies. For example, ANMPathway45 and coMD44 report the closing of LID, followed by NMP closure in the transition from fully open to fully closed state. Same behavior is reported in other 43,71,73,74 In the reverse direction, again the dominance of LID opening followed by NMP opening has also been observed.44,71 In numerous computational studies,42,71,72,74,75 the LID movement of apo AK is reported to occur on a relatively flat energy surface. LID motion is also dominantly observed in small-angle X-ray scattering.73 Our results show that the LID angle can vary between 105° and 135° when the NMP is open (65°), and between 90° and 125° when the NMP domain is closed (45°). However, we also observe NMP movement in our generated conformers, which is reflected from the highly populated region on Figure 2c, where NMP angle changes between 45° and 65° when LID angle is around 120°.
A closer analysis of the different conformers showed that the commonly used LID-CORE and NMP-CORE angles do not uniquely describe the interdomain flexibility of AK. In fact, two conformers falling on same spot of the conformational space may represent quite distinct structures, such as those shown in the Figure S3. Yet, we used this representation here in order to compare our results with the available free energy surface71 and earlier computational studies.43–45, For the other systems, we adopted the two principal axes determined by PCA of the generated ensemble.
The RMSDs of cluster representatives (fifth generation) with respect to the fully open, fully closed, closed-LID, and closed-NMP states are summarized in Table 2. The lowest RMSDs from the end states are given, together with number of conformers that have an RMSD less than 3 Å in parentheses. The results clearly show that the entire conformational space is being sampled regardless of the starting conformation, except for a few transitions (fully open ↔ closed NMP and fully open → fully closed) that are not apparently directly accessible. The states that were observed to be accessible to each starting structure are also summarized in Figure 2d. Of the 12 combinations of transitions (both ways) between 4 substates, 3 are not directly accessible, and 2 (closed NMP ↔ closed LID) appear to be hardly accessible (closest attainable RMSD > 3 Å).
Table 2.
Ability of ClustENM to Sample Transitions between Known Substates of AKa Indicated by RMSD from Ending Conformer for Various Starting Structures
| starting structure |
|||||
|---|---|---|---|---|---|
| fully open |
fully closed |
closed- LID |
closed- NMP |
||
| ending conformer |
fully open | – | 2.2 (2) | 1.4 (15) | 4.6 |
| fully closed |
4.6 | – | 2.7 (6) | 1.2 (21) | |
| closed- LID |
1.4 (8) | 2.0 (17) | – | 3.9 | |
| closed- NMP |
4.3 | 1.0 (14) | 3.1 | – | |
Lowest RMSDs with respect to the four substates are listed for representative conformers generated by ClustENM. Each column refers to a different starting structure. The number of representative conformers with yielded RMSD < 3 Å is given in parentheses.
We also plotted generation-based representative probability distributions in Figure S4 for AK. Sampled regions on angle space were quite restricted in earlier generations (gen1–2), whereas conformers that are qualified as “transition states” were also sampled in successive generations (gen3–5). Thus, the conformers differ more and more from the initial structure as higher generations are sampled for AK.
Calmodulin (CAM)
CAM functions as a multipurpose intracellular Ca2+ receptor that is expressed in all eukaryotic cells. It can bind to various target proteins involved in calcium-signaling pathways. A helical linker connects the N- and C-lobes of CAM (Figure S1), each of which binds two Ca2+ ions. CAM undergoes large conformational changes (of about 15 Å) between its extended (1cll60) and fully collapsed (1cdl76) states, as shown in Figure 3a. We selected the extended conformation of CAM as the starting structure. At the end of the fifth generation, 195 clusters were generated and later used for PCA. Subsequently, 550 experimentally resolved conformers, including NMR models and crystal structures, were projected onto the subspace spanned by the first three PCA modes in Figure 3a. Interestingly, the horseshoe shaped distribution of the generated structures closely overlaps with that spanned by the experimental data. Thus, the topology-driven modes effectively guide the conformational space search for CAM.
Figure 3.

Essential subspace of CAM. (a) Experimental data (blue) is projected onto the subspace spanned by the first three PCs of ClustENM conformers (red). Both data sample the horseshoe shaped region. Some generated conformers that are close to experimental structures are shown by ribbon diagrams. (b) MSFs for generated conformers and experimental data express similar trends. (c) The RMSD distribution of the starting structure to NMR models (in the PDB file 2k0e) (blue) varies in the range 7–15 Å and decreases up to 3–10 Å (red) when ClustENM conformers are considered.
The highly populated region corresponding to the ligand-bound, fully collapsed state of CAM is not sampled by the generated conformers (closest RMSD to 1cdl is of 9.1 Å), indicating the possibility of an induced fit type of closure. The helical structure of the linker is mostly preserved in the generated conformers, but a slight bending is also observed. The end-to-end linker distance defined in a recent study77 (between α-carbons of residues 69 and 91) changes between 30 and 34 Å, which is far from the bent linker end-to-end distance of 22 Å in the fully closed state. More generations are apparently needed to observe the pronounced bending of the linker.
Due to the availability of experimental data describing the distinct states of CAM (including intermediates), we also calculated mean-square fluctuations (MSFs) based on ensembles of generated and experimental conformers. Figure 3b shows the consistency between experiments and computational predictions. The C-lobe appears to have higher mobility than the N-lobe in both ensembles.
We further examined if ClustENM could generate conformers that were close to the 160 models determined by NMR for apo CAM.78 In Figure 3c, the blue bars display the histogram of each NMR model’s RMSD from the initial extended structure; the red bars display the histogram for ClustENM conformers with lowest RMSDs with respect to NMR models. The RMSD range decreases from 7–15 Å (for the starting structure with respect to NMR models) to 3–10 Å (for the closest ending conformers). Three conformers in Figure 3a illustrate the extent of bending in the helical linker observed in these conformers. This comparison confirms that ClustENM ensemble is distributed over a broad subspace consistent with NMR models.
Triosephosphate Isomerase (TIM)
TIM catalyzes the isomerization of dihydroxyacetone phosphate into d-glyceraldehyde 3-phosphate. It is active in dimeric form, although each identical subunit possesses a catalytic site. Experimental structures reveal a relatively localized opening/closure of loop 6 (Figure 4c, top panel). This loop (residues E168-P181 in TIM from Trypanosoma cruzi, TcTIM) closes over the active site and protects the substrate from hydration during the reaction. However, this opening/closure is not necessarily ligand-gated; it can take place in the apo state as well.79,80
Figure 4.

Essential subspace of conformers accessible to triosephosphate isomerase. (a) Subspace spanned by the first two PCs derived from ClustENM conformers (red) shows the confinement of experimental structures (blue) to a narrow region, contrary to broader area sampled by three independent MD runs (black, green and yellow). (b) MSFs of residues obtained by ClustENM (red) and MD (black) are highly correlated, except for large fluctuations observed in MD for loop 6 regions (indicated by circles). (c) Loop 6 (yellow) variability is observed in X-ray (blue) structures (top), and global structural variations are observed in ClustENM (red; middle) and MD data (green; bottom).
Several MD simulations and ENM studies have stressed the presence of collective motions in TIM, such as counter-rotation or bending of the subunits, which are coupled to loop six dynamics but not evident in experimental structures.80–84 In conformity with these findings, the conformers generated here cover a broader space in comparison to that experimentally observed (which tends to cluster in a confined region of the PC subspace). The figure also displays the MD snapshots obtained from three independent 100 ns runs, projected onto the same PC subspace. ClustENM conformers lie within the subspace sampled by MD simulations. For the details of MD simulations, please see the Supporting Information and Table S3.
Further comparison of the MSFs of residues observed in the ClustENM set and in MD simulations (Figure 4b) shows close quantitative agreement between the two data sets, except for the flexibility in the loop 6 (see encircled peaks in the figure) which was very pronounced in MD. The soft motions predicted by ClustENM are usually highly cooperative, and the large flexibility on a local scale may not be accounted for by these modes. The structural variabilities observed in experiments, and predicted by ClustENM and MD, can be also visualized in Figure 4c. Only local fluctuations at the catalytic loop are observed in X-ray data set (blue), whereas ClustENM (red) and MD (green) conformers exhibit highly distributed movements. A coupling between the catalytic loop opening/closing and the collective movements of the two monomers82 can be discerned in the ClustENM (red) conformers.
p38 Kinase
Mitogen-activated protein kinase p38 functions as a signal transduction mediator activated in response to extracellular stimuli such as osmotic shock, ultraviolet light, growth factors. It is linked to inflammation, cell cycle, cell death, and tumorigenesis in specific cell types.85
ClustENM results (red dots) projected onto the subspace spanned by 2 PCs (derived from the ClustENM ensemble) are presented in Figure 5a. A total of 221 experimentally resolved structures (blue open dots) are also projected onto the same subspace. These tend to cluster within a relatively small region in comparison to the ClustENM conformers and two independent MD runs (green and black small diamonds). The “grid-like” trend of the generated conformers stems from the persistent preferential selection of a specific direction (a bending motion), which can be also observed in Figure 5c (red conformers). We note that the residue MSF profiles (Figure 5b) obtained by ClustENM and MD show good agreement in general. Higher fluctuations observed for residues 100–115 in MD correspond to a loop region (indicated by black arrow in Figure 5c). Figure 5c compares the conformational variations observed in experiments (top; blue), and those observed in ClustENM conformers (red; middle) and MD simulations (green; bottom). The blue loop in the middle of top panel belongs to a region left out from alignments of experimental structures (residues 170–184), but it is present in both MD and ClustENM conformers.
Figure 5.

p38 kinase essential subspace of conformers. (a) Subspace spanned by the first two PCs of ClustENM conformers (red) onto which experimental (blue) and MD (black and green) data are projected. Generated conformers cover a “grid-like” region, which originates from the consistent selection of a specific direction throughout two generations. (b) Residue MSFs from ClustENM (red) and MD (black) exhibit similar trends. (c) Conformational space sampled by X-ray structures (blue), ClustENM (red), and MD (green). In all cases, the opaque structure corresponds to the starting structure.
HIV-1 Reverse Transcriptase (RT)
RT is essential for HIV-1 to reverse transcribe its viral RNA into double-stranded DNA during host cell infection and is, consequently, an important target for anti-HIV drug development. RT is a heterodimer composed of the p66 and p51 subunits. The p66 subunit has two domains with different functionalities, DNA polymerase and RNase H; and the DNA polymerase domain is further composed of four subdomains: fingers, palm, thumb, and connection.86
Figure 6a shows the PC subspace spanned by generated conformers, which covers most of the experimental and MD data. Even though two independent MD runs (100 ns each) mostly sample the right-hand side of the conformational space (PC1 > 0), some of the snapshots are observed on the left-hand side that is sampled by the generated conformers, similar to p38 case. One cluster of experimental data (located about PC1 = 50, PC2 = −100), which is not sampled by either the generated clusters or the MD snapshots, corresponds to the closed state of the clamp (observed in top panel of Figure 6c).
Figure 6.

Essential subspace accessible to HIV-1 RT. (a) Superposition of ClustENM conformers (red), experimental data (blue), and MD snapshots (black and green) in the subspace spanned by the first two PCs deduced from ClustENM conformers. The space covered by ClustENM conformers encloses that of MD and the experimental data, except for a region (around PC1 = 50, PC2 = −100) observed in experiments, which corresponds to a closed clamp. (b) MSFs for ClustENM (red) and MD (black) data show similar trends. (c) X-ray structures (blue) indicate clamp closure, ClustENM (red), and MD (green) conformer consistently reveal high fluctuations at the thumb and fingers subdomains of the p66 polymerase domain.
MSF for generated conformers and MD data indicate a satisfactory level of correspondence in the Figure 6b. High peaks on MSF correspond to either chain end or loop regions in subunit p51. As shown in Figure 6c, the clamp motion dominates the dynamics in experimental data (blue). Similar global motions are also observed in ClustENM (red) and MD (green) structures.
70S Ribosome
Ribosome, composed of ribosomal proteins and RNA chains, is a supramolecular machine that synthesizes proteins. 70S bacterial ribosome is formed by association of a small (30S) and a large (50S) subunit. Protein synthesis is enabled by several conformational changes that are challenging to observe by MD. Especially the mechanism of translocation still needs clarification.87,88 Several methods have been used to investigate ribosome dynamics including ENM,48,51,54,89,90 coarse-grained MD91 and MD using a multibasin structure-based model.87
In order to test the applicability of ClustENM to supramolecules, we used as starting conformer the crystal structure of 70S bacterial ribosome complexed with elongation factor G (EF-G), trapped in an intermediate state of translocation,64 called “chimeric pe*/E” state (PDB id: 4kdk (50S)–4kdj (30S)). The complex contains 50 ribosomal proteins, and mRNA and tRNA molecules and EF-G in addition to the subunits 23S, 16S, and 5S RNA. Using the energy-minimized 70S structure, we generated 101 representative conformers (Figure 7a). Due to the missing chains and/or residues in experimental structures, we could not project them onto the PC space. Instead we calculated mutual RMSDs based on the P atoms of the common chains 23S and 16S. Accordingly, the available 27 experimental structures including the initial structure fall into five classes (Figure S5). Comparison of ClustENM conformers with this set indicates that almost half of the generated conformers approach toward one of the experimental groups, other than the initial structure’s group (see Figure S6). This indicates that the ClustENM generation of conformers permits to sample different classes of structures, irrespective of the starting structure. Figure 7b further shows that the initial RMSD range (of the starting structure with respect to the remaining 26 experimental structures) is shifted to lower values, consistent with the intrinsic tendency of the ribosome to sample the functional states detected experimentally.
Figure 7.

Bacterial 70S ribosome. (a) PCA of generated clusters show a broad distribution of conformers (dot size is proportional to cluster weight). (b) The RMSDs with respect to experimental structures (based on 23S and 16S only) shift to the lower values in ClustENM conformers compared to those of the original structure. (c) Ratchet motion of the two subunits and the 30S head motion is distinguished in the conformational dynamics of the ribosome, shown from two different views (also see Supporting Information Movies). (d) Close-up view of protein dynamics and flexibility at the exit tunnel. RMSD values are obtained using PyMOL.92
Examination of the motions along the PC1 and PC2 derived from ClustENM conformers showed that these two respective axes described the ratchet motion of the subunits and the 30S head motions, respectively (Movie 1). These results are again consistent with those reported earlier48,51,54,87–91 and the computational cost to obtain those results is minimal. Figure 7c depicts the conformational variability of the complex using 32 highest-weight ClustENM conformers.
In another close-up movie (Movie 2, Supporting Information), the high mobility of the tRNA can be viewed together with that of the L1 stalk. The tRNA shows a tendency to move toward to the exit (E) site, i.e., away from the peptidyl (P) site (where it is bound in the crystal structure). We note that the presence of EF-G may accelerate this translocation in the forward direction. In Figure 7d and Movie 3, ribosomal tunnel on the 50S subunit, through which the nascent polypeptide chain exits, is shown together with nearby ribosomal proteins L4, L22, L23, L24, and L29. We observe the conformational flexibility of L4 and L24 in the ClustENM-generated conformers, whereas L22–23 and L29 exhibit rigid-body translations.
Assessment of Generated Conformers in Terms of Protein Geometry
The reliability of ClustENM conformers was checked for their internal geometry by using MOLPROBITY93 server. Especially specific conformers, which belong to the regions not sampled by MD simulations and/or crystal structures, were selected for TIM, p38 and RT. The scores for all systems were verified to be consistent with those of the energy-minimized starting X-ray structures, in support of their physical realism, as summarized in Table S4.
CONCLUSION
In this study, we introduced an ENM-based iterative methodology called ClustENM, which is shown to efficiently generate physically reliable and biologically relevant ensembles of conformers. These conformers are by definition those entropically favored because of the underlying model, ANM, which is exclusively based on inter-residue contact topology. The newly introduced protocol permits ClustENM to take advantage of the analytical solutions (soft modes) uniquely obtained (by the ANM) for each examined structure to map them into conformers resolved at atomic detail in accord with the force field used in MD simulations. Significantly, the method is particularly useful for supramolecular structures, the conformational space of which cannot be efficiently sampled by conventional MD. It also permits us to generate a broad distribution of conformers, encompassing those reached by large allosteric changes (e.g., RT).
Application to six systems varying in size from 144 residues (CAM) to ~11,000 (70S ribosome) supported the utility of ClustENM. AK served as a benchmarking system; the generated clusters were verified to be in close conformity with the previously reported free energy surface.71 In the case of CAM, a unique distribution of conformers was identified: a horseshoe shaped PC subspace, which was shown to be consistent with NMR models. In the case of TIM homodimer, a significantly broader range of conformational variability, compared to that observed in structures experimentally resolved (to date) was observed. The generated conformers were verified to agree well with (significantly more time-consuming) MD simulations. Here, p38 kinase and RT presented two cases where ClustENM accurately predicted the allosteric domain/subunit movements essential to enzymatic function. The critical assessment of the generated structures in terms of their geometry and energetics was found to meet established criteria, suggesting that the entropic driving potential underlying ClustENM permits to sample cooperative changes in structure that are beyond those typically sampled by MD simulations.
Finally, ClustENM conformers for the 70S ribosome in the presence of EF-G easily reproduced known dynamic features, such as the ratchet-like motion of the two subunits and the 30S head motions. It also revealed additional features such as the intrinsic tendency of the tRNA to progress toward to the exit (E) site, away from the peptidyl (P) site, which may be facilitated by the presence of EF-G. Among the proteins located in the tunnel region, L4 and L24 were distinguished by their high conformational flexibilities.
It is important to emphasize that ClustENM is not a path-sampling nor a transition-prediction method. It simply permits us to have a good understanding of the accessible conformational space, and in so doing, it also reveals which conformational transitions can be (relatively) easily accessible under native state conditions. It does not require a target conformation and produces relatively manageable number of conformers as a result of the clustering steps. Indeed, the use of clusters is known to lead to improved results in protein structure prediction94 as well as docking simulations.95 It is worth stressing the effectiveness of only a small number of generated structures in representing the experimentally observed conformational space. Even though a limited number of modes (3–5 slowest modes) were used here, one may also include more modes28,96 or specific modes of interest97 to explore the conformational space and/or to better represent a wider diversity of local motions.
Generated conformers can be used as an initial structure for other applications, such as flexible docking. Significantly, in all applications, the examined system selectively moved from the vicinity of a given (starting) conformer to that of others experimentally observed, and transitions that were preferentially sampled between functional substates became clear (as indicated by the tabulated RMSDs or histograms). This type of information on probable substates and preferred transitions in the absence of any bias can be advantageously used for constructing realistic kinetic schemes that can be adopted in higher scale simulations.
Supplementary Material
ACKNOWLEDGMENTS
Z.K. and P.D. thank Prof. Canan Atilgan and Dr. Seren Soner for fruitful discussions.
Funding
P.D. and Z.K. acknowledge partial support by the Scientific and Technological Research Council of Turkey (TUBITAK) Project No: 113M237 and the Bogazici University Scientific Research Fund (BAP) Project No: 9360. I.B. gratefully acknowledges support from NIH R01 GM099738.
ABBREVIATIONS
- AK
Adenylate Kinase
- ANM
Anisotropic Network Model
- CAM
Calmodulin
- ENM
Elastic Network Model
- HIV-1 RT
Human Immunodeficiency Virus-1 reverse transcriptase
- MD
Molecular Dynamics
- TIM
Triosephosphate isomerase
- RMSD
root-mean-square deviation
- PDB
Protein Data Bank
Footnotes
Author Contributions
The manuscript was written through contributions of all authors. All authors have given approval to the final version of the manuscript.
Notes
The authors declare no competing financial interest.
The Supporting Information is available free of charge on the ACS Publications website at DOI: 10.1021/acs.jctc.6b00319.
Energy minimization details; derivation of eq 3; principal component analysis details; MD simulation details. (PDF)
Six figures S1–S6 and four tables S1–S4. (PDF)
Three movie files. SI_Movie1: Generated conformers of 70S ribosome. SI_Movie2: tRNA movements in 70S generated conformers. SI_Movie 3: Movements of ribosomal tunnel proteins in 70S generated conformers. (ZIP)
REFERENCES
- (1).Grant BJ, Gorfe AA, McCammon JA. Large Conformational Changes in Proteins: Signaling and Other Functions. Curr. Opin. Struct. Biol. 2010;20:142–147. doi: 10.1016/j.sbi.2009.12.004. [DOI] [PMC free article] [PubMed] [Google Scholar]
- (2).Freddolino PL, Harrison CB, Liu Y, Schulten K. Challenges in Protein Folding Simulations: Timescale, Representation, and Analysis. Nat. Phys. 2010;6:751–758. doi: 10.1038/nphys1713. [DOI] [PMC free article] [PubMed] [Google Scholar]
- (3).Shaw DE, Dror RO, Salmon JK, Grossman JP, Mackenzie KM, Bank JA, Young C, Deneroff MM, Batson B, Bowers KJ, Chow E, Eastwood MP, Ierardi DJ, Klepeis JL, Kuskin JS, Larson RH, Lindorff-Larsen K, Maragakis P, Moraes MA, Piana S, Shan Y, Towles B. Millisecond-Scale Molecular Dynamics Simulations on Anton. Proceedings of the Conference on High Performance Computing Networking, Storage and Analysis; New York: ACM; 2009. pp. 39:1–39:11. SC ′09. [Google Scholar]
- (4).Dror RO, Dirks RM, Grossman JP, Xu H, Shaw DE. Biomolecular Simulation: A Computational Microscope for Molecular Biology. Annu. Rev. Biophys. 2012;41(1):429–452. doi: 10.1146/annurev-biophys-042910-155245. [DOI] [PubMed] [Google Scholar]
- (5).Grossman JP, Towles B, Greskamp B, Shaw DE. Filtering, Reductions and Synchronization in the Anton 2 Network. Parallel and Distributed Processing Symposium (IPDPS), 2015 IEEE International; 2015; pp. 860–870. 10.1109/IPDPS.2015.42. [Google Scholar]
- (6).Raval A, Piana S, Eastwood MP, Dror RO, Shaw DE. Refinement of Protein Structure Homology Models via Long, All-Atom Molecular Dynamics Simulations. Proteins: Struct., Funct., Genet. 2012;80:2071–2079. doi: 10.1002/prot.24098. [DOI] [PubMed] [Google Scholar]
- (7).Mahajan S, Sanejouand YH. On the Relationship between Low-Frequency Normal Modes and the Large-Scale Conformational Changes of Proteins. Arch. Biochem. Biophys. 2015;567:59–65. doi: 10.1016/j.abb.2014.12.020. [DOI] [PubMed] [Google Scholar]
- (8).May A, Zacharias M. Accounting for Global Protein Deformability During Protein–Protein and Protein–Ligand Docking. Biochim. Biophys. Acta, Proteins Proteomics. 2005;1754:225–231. doi: 10.1016/j.bbapap.2005.07.045. [DOI] [PubMed] [Google Scholar]
- (9).Vashisth H, Brooks CL. Conformational Sampling of Maltose-Transporter Components in Cartesian Collective Variables Is Governed by the Low-Frequency Normal Modes. J. Phys. Chem. Lett. 2012;3:3379–3384. doi: 10.1021/jz301650q. [DOI] [PMC free article] [PubMed] [Google Scholar]
- (10).Schlitter J, Engels M, Kruger P. Targeted Molecular Dynamics: A New Approach for Searching Pathways of Conformational Transitions. J. Mol. Graphics. 1994;12:84–89. doi: 10.1016/0263-7855(94)80072-3. [DOI] [PubMed] [Google Scholar]
- (11).Hamelberg D, Mongan J, McCammon JA. Accelerated Molecular Dynamics: A Promising and Efficient Simulation Method for Biomolecules. J. Chem. Phys. 2004;120:11919–11929. doi: 10.1063/1.1755656. [DOI] [PubMed] [Google Scholar]
- (12).Bussi G, Laio A, Parrinello M. Equilibrium Free Energies from Nonequilibrium Metadynamics. Phys. Rev. Lett. 2006;96:90601. doi: 10.1103/PhysRevLett.96.090601. [DOI] [PubMed] [Google Scholar]
- (13).Hansmann UHE. Parallel Tempering Algorithm for Conformational Studies of Biological Molecules. Chem. Phys. Lett. 1997;281:140–150. [Google Scholar]
- (14).Rader AJ. Coarse-Grained Models: Getting More with Less. Curr. Opin. Pharmacol. 2010;10(6):753–759. doi: 10.1016/j.coph.2010.09.003. [DOI] [PubMed] [Google Scholar]
- (15).Saunders MG, Voth GA. Coarse-Graining Methods for Computational Biology. Annu. Rev. Biophys. 2013;42(1):73–93. doi: 10.1146/annurev-biophys-083012-130348. [DOI] [PubMed] [Google Scholar]
- (16).Zhang Z. Systematic Methods for Defining Coarse-Grained Maps in Large Biomolecules. Adv. Exp. Med. Biol. 2015;827:33–48. doi: 10.1007/978-94-017-9245-5_4. [DOI] [PubMed] [Google Scholar]
- (17).Cui Q, Bahar I. Normal Mode Analysis: Theory and Applications to Biological and Chemical Systems. Chapman & Hall/CRC; 2005. [Google Scholar]
- (18).Miloshevsky GV, Jordan PC. The Open State Gating Mechanism of Gramicidin A Requires Relative Opposed Monomer Rotation and Simultaneous Lateral Displacement. Structure. 2006;14:1241–1249. doi: 10.1016/j.str.2006.06.007. [DOI] [PubMed] [Google Scholar]
- (19).Miloshevsky GV, Jordan PC. Open-State Conformation of the KcsA K+ Channel: Monte Carlo Normal Mode Following Simulations. Structure. 2007;15:1654–1662. doi: 10.1016/j.str.2007.09.022. [DOI] [PubMed] [Google Scholar]
- (20).Miloshevsky GV, Hassanein A, Jordan PC. Antiport Mechanism for Cl−/H+ in ClC-ec1 from Normal-Mode Analysis. Biophys. J. 2010;98:999–1008. doi: 10.1016/j.bpj.2009.11.035. [DOI] [PMC free article] [PubMed] [Google Scholar]
- (21).Batista PR, Robert CH, Maréchal J-D, Hamida-Rebaï MB, Pascutti PG, Bisch PM, Perahia D. Consensus Modes, a Robust Description of Protein Collective Motions from Multiple-Minima Normal Mode Analysis–Application to the HIV-1 Protease. Phys. Chem. Chem. Phys. 2010;12(12):2850–2859. doi: 10.1039/b919148h. [DOI] [PubMed] [Google Scholar]
- (22).Costa MGS, Batista PR, Bisch PM, Perahia D. Exploring Free Energy Landscapes of Large Conformational Changes: Molecular Dynamics with Excited Normal Modes. J. Chem. Theory Comput. 2015;11(6):2755–2767. doi: 10.1021/acs.jctc.5b00003. [DOI] [PubMed] [Google Scholar]
- (23).Mouawad L, Perahia D. Motions in Hemoglobin Studied by Normal Mode Analysis and Energy Minimization: Evidence for the Existence of Tertiary T-Like, Quaternary R-like Intermediate Structures. J. Mol. Biol. 1996;258(2):393–410. doi: 10.1006/jmbi.1996.0257. [DOI] [PubMed] [Google Scholar]
- (24).Tirion MM. Large Amplitude Elastic Motions in Proteins from a Single Parameter, Atomic Analysis. Phys. Rev. Lett. 1996;77:1905–1908. doi: 10.1103/PhysRevLett.77.1905. [DOI] [PubMed] [Google Scholar]
- (25).Bahar I, Lezon TR, Yang L-W, Eyal E. Global Dynamics of Proteins: Bridging Between Structure and Function. Annu. Rev. Biophys. 2010;39:23–42. doi: 10.1146/annurev.biophys.093008.131258. [DOI] [PMC free article] [PubMed] [Google Scholar]
- (26).Doruker P, Atilgan AR, Bahar I. Dynamics of Proteins Predicted by Molecular Dynamics Simulations and Analytical Approaches: Application to a-Amylase Inhibitor. Proteins: Struct., Funct., Genet. 2000;40:512–524. [PubMed] [Google Scholar]
- (27).Atilgan AR, Durell SR, Jernigan RL, Demirel MC, Keskin O, Bahar I. Anisotropy of Fluctuation Dynamics of Proteins with an Elastic Network Model. Biophys. J. 2001;80(1):505–515. doi: 10.1016/S0006-3495(01)76033-X. [DOI] [PMC free article] [PubMed] [Google Scholar]
- (28).Tama F, Sanejouand YH. Conformational Change of Proteins Arising from Normal Mode Calculations. Protein Eng., Des. Sel. 2001;14(1):1–6. doi: 10.1093/protein/14.1.1. [DOI] [PubMed] [Google Scholar]
- (29).Krebs WG, Alexandrov V, Wilson CA, Echols N, Yu H, Gerstein M. Normal Mode Analysis of Macromolecular Motions in a Database Framework: Developing Mode Concentration as a Useful Classifying Statistic. Proteins: Struct., Funct., Genet. 2002;48:682–695. doi: 10.1002/prot.10168. [DOI] [PubMed] [Google Scholar]
- (30).Yang L, Song G, Jernigan RL. How Well Can We Understand Large-Scale Protein Motions Using Normal Modes of Elastic Network Models? Biophys. J. 2007;93:920–929. doi: 10.1529/biophysj.106.095927. [DOI] [PMC free article] [PubMed] [Google Scholar]
- (31).Xu C, Tobi D, Bahar I. Allosteric Changes in Protein Structure Computed by a Simple Mechanical Model: Hemoglobin T↔R2 Transition. J. Mol. Biol. 2003;333(1):153–168. doi: 10.1016/j.jmb.2003.08.027. [DOI] [PubMed] [Google Scholar]
- (32).Tobi D, Bahar I. Structural Changes Involved in Protein Binding Correlate with Intrinsic Motions of Proteins in the Unbound State. Proc. Natl. Acad. Sci. U. S. A. 2005;102(52):18908–18913. doi: 10.1073/pnas.0507603102. [DOI] [PMC free article] [PubMed] [Google Scholar]
- (33).Bakan A, Bahar I. The Intrinsic Dynamics of Enzymes Plays a Dominant Role in Determining the Structural Changes Induced upon Inhibitor Binding. Proc. Natl. Acad. Sci. U. S. A. 2009;106(34):14349–14354. doi: 10.1073/pnas.0904214106. [DOI] [PMC free article] [PubMed] [Google Scholar]
- (34).Ahmed A, Rippmann F, Barnickel G, Gohlke H. A Normal Mode-Based Geometric Simulation Approach for Exploring Biologically Relevant Conformational Transitions in Proteins. J. Chem. Inf. Model. 2011;51:1604–1622. doi: 10.1021/ci100461k. [DOI] [PubMed] [Google Scholar]
- (35).Kim MK, Jernigan RL, Chirikjian GS. Efficient Generation of Feasible Pathways for Protein Conformational Transitions. Biophys. J. 2002;83:1620–1630. doi: 10.1016/S0006-3495(02)73931-3. [DOI] [PMC free article] [PubMed] [Google Scholar]
- (36).Kim MK, Jernigan RL, Chirikjian GS. Rigid-Cluster Models of Conformational Transitions in Macromolecular Machines and Assemblies. Biophys. J. 2005;89:43–55. doi: 10.1529/biophysj.104.044347. [DOI] [PMC free article] [PubMed] [Google Scholar]
- (37).Feng Y, Yang L, Kloczkowski A, Jernigan RL. The Energy Profiles of Atomic Conformational Transition Intermediates of Adenylate Kinase. Proteins: Struct., Funct., Genet. 2009;77:551–558. doi: 10.1002/prot.22467. [DOI] [PMC free article] [PubMed] [Google Scholar]
- (38).Zheng W, Brooks BR. Modeling Protein Conformational Changes by Iterative Fitting of Distance Constraints Using Reoriented Normal Modes. Biophys. J. 2006;90:4327–4336. doi: 10.1529/biophysj.105.076836. [DOI] [PMC free article] [PubMed] [Google Scholar]
- (39).Zheng W, Brooks BR. Normal Modes Based Prediction of Protein Conformational Changes Guided by Distance Constraints. Biophys. J. 2005;88:3109–3117. doi: 10.1529/biophysj.104.058453. [DOI] [PMC free article] [PubMed] [Google Scholar]
- (40).Zheng W, Brooks BR. Identification of Dynamical Correlations within the Myosin Motor Domain by the Normal Mode Analysis of Elastic Network Model. Biophys. J. 2005;88:3109–3117. doi: 10.1016/j.jmb.2004.12.020. [DOI] [PubMed] [Google Scholar]
- (41).Maragakis P, Karplus M. Large Amplitude Conformational Change in Proteins Explored with a Plastic Network Model: Adenylate Kinase. J. Mol. Biol. 2005;352:807–822. doi: 10.1016/j.jmb.2005.07.031. [DOI] [PubMed] [Google Scholar]
- (42).Kantarci-Carsibasi N, Haliloglu T, Doruker P. Conformational Transition Pathways Explored by Monte Carlo Simulation Integrated with Collective Modes. Biophys. J. 2008;95(12):5862–5873. doi: 10.1529/biophysj.107.128447. [DOI] [PMC free article] [PubMed] [Google Scholar]
- (43).Uyar A, Kantarci-Carsibasi N, Haliloglu T, Doruker P. Features of Large Hinge-Bending Conformational Transitions. Prediction of Closed Structure from Open State. Biophys. J. 2014;106:2656–2666. doi: 10.1016/j.bpj.2014.05.017. [DOI] [PMC free article] [PubMed] [Google Scholar]
- (44).Gur M, Madura JD, Bahar I. Global Transitions of Proteins Explored by a Multiscale Hybrid Methodology: Application to Adenylate Kinase. Biophys. J. 2013;105:1643–1652. doi: 10.1016/j.bpj.2013.07.058. [DOI] [PMC free article] [PubMed] [Google Scholar]
- (45).Das A, Gur M, Cheng MH, Jo S, Bahar I, Roux B. Exploring the Conformational Transitions of Biomolecular Systems Using a Simple Two-State Anisotropic Network Mode. PLoS Comput. Biol. 2014;24:267–276. doi: 10.1371/journal.pcbi.1003521. [DOI] [PMC free article] [PubMed] [Google Scholar]
- (46).Kirillova S, Cortes J, Stefaniu A, Simeon T. An NMA-Guided Path Planning Approach for Computing Large-Amplitude Conformational Changes in Proteins. Proteins: Struct., Funct., Genet. 2008;70:131–143. doi: 10.1002/prot.21570. [DOI] [PubMed] [Google Scholar]
- (47).Al-Bluwi I, Vaisset M, Simeon T, Cortes J. Modeling Protein Conformational Transitions by a Combination of Coarse-Grained Normal Mode Analysis and Robotics-Inspired Methods. BMC Struct. Biol. 2013;13:S2. doi: 10.1186/1472-6807-13-S1-S2. [DOI] [PMC free article] [PubMed] [Google Scholar]
- (48).Seo S, Jang Y, Qian P, Liu WK, Choi J-B, Lim BS, Kim MK. Efficient Prediction of Protein Conformational Pathways Based on the Hybrid Elastic Network Model. J. Mol. Graphics Modell. 2014;47:25–36. doi: 10.1016/j.jmgm.2013.10.009. [DOI] [PubMed] [Google Scholar]
- (49).Gur M, Zomot E, Cheng MH, Bahar I. Energy Landscape of LeuT from Molecular Simulations. J. Chem. Phys. 2015;143(24):243134. doi: 10.1063/1.4936133. [DOI] [PMC free article] [PubMed] [Google Scholar]
- (50).Kurkcuoglu Z, Doruker P. Ligand Docking to Intermediate and Close-To-Bound Conformers Generated by an Elastic Network Model Based Algorithm for Highly Flexible Proteins. PLoS One. 2016;11(6):e0158063. doi: 10.1371/journal.pone.0158063. [DOI] [PMC free article] [PubMed] [Google Scholar]
- (51).Kurkcuoglu O, Turgut OT, Cansu S, Jernigan RL, Doruker P. Focused Functional Dynamics of Supramolecules by Useof a Mixed-Resolution Elastic Network Model. Biophys. J. 2009;97:1178–1187. doi: 10.1016/j.bpj.2009.06.009. [DOI] [PMC free article] [PubMed] [Google Scholar]
- (52).Marques OA. BLZPACK: Description and User’s Guide. CERFACS; Toulouse, France: 1995. [Google Scholar]
- (53).Grimes RJ, Lewis J, Simon H. A Shifted Block Lanczos Algorithm for Solving Sparse Symmetric Generalized Eigenproblems. SIAM J. Matrix Anal. Appl. 1994;15:228–272. [Google Scholar]
- (54).Kurkcuoglu O, Kurkcuoglu Z, Doruker P, Jernigan RL. Collective Dynamics of the Ribosomal Tunnel Revealed by Elastic Network Modeling. Proteins: Struct., Funct., Genet. 2009;75(4):837–845. doi: 10.1002/prot.22292. [DOI] [PMC free article] [PubMed] [Google Scholar]
- (55).Feig M, Karanicolas J, Brooks CL., 3rd MMTSB Tool Set: enhanced sampling and multiscale modeling methods for applications in structural biology. J. Mol. Graphics Modell. 2004;22(5):377–395. doi: 10.1016/j.jmgm.2003.12.005. [DOI] [PubMed] [Google Scholar]
- (56).Dobbins SE, Lesk VI, Sternberg MJE. Insights into Protein Flexibility: The Relationship between Normal Modes and Conformational Change upon Protein–protein Docking. Proc. Natl. Acad. Sci. U. S. A. 2008;105(30):10390–10395. doi: 10.1073/pnas.0802496105. [DOI] [PMC free article] [PubMed] [Google Scholar]
- (57).Karaca E, Bonvin AMJJ. A Multidomain Flexible Docking Approach to Deal with Large Conformational Changes in the Modeling of Biomolecular Complexes. Structure. 2011;19(4):555–565. doi: 10.1016/j.str.2011.01.014. [DOI] [PubMed] [Google Scholar]
- (58).Muller CW, Schlauderer GJ, Reinstein J, Schulz GE. Adenylate Kinase Motions during Catalysis: An Energetic Counter-weight Balancing Substrate Binding. Structure. 1996;4(2):147–156. doi: 10.1016/s0969-2126(96)00018-4. [DOI] [PubMed] [Google Scholar]
- (59).Muller CW, Schulz GE. Structure of the Complex between Adenylate Kinase from Escherichia Coli and the Inhibitor Ap5A Refined at 1.9 A Resolution. A Model for a Catalytic Transition State. J. Mol. Biol. 1992;224(1):159–177. doi: 10.1016/0022-2836(92)90582-5. [DOI] [PubMed] [Google Scholar]
- (60).Chattopadhyaya R, Meador WE, Means AR, Quiocho FA. Calmodulin Structure Refined at 1.7 A Resolution. J. Mol. Biol. 1992;228(4):1177–1192. doi: 10.1016/0022-2836(92)90324-d. [DOI] [PubMed] [Google Scholar]
- (61).Esnouf R, Ren J, Ross C, Jones Y, Stammers D, Stuart D. Mechanism of Inhibition of HIV-1 Reverse Transcriptase by Non-Nucleoside Inhibitors. Nat. Struct. Biol. 1995;2(4):303–308. doi: 10.1038/nsb0495-303. [DOI] [PubMed] [Google Scholar]
- (62).Wang Z, Harkins PC, Ulevitch RJ, Han J, Cobb MH, Goldsmith EJ. The Structure of Mitogen-Activated Protein Kinase p38 at 2.1-A Resolution. Proc. Natl. Acad. Sci. U. S. A. 1997;94(6):2327–2332. doi: 10.1073/pnas.94.6.2327. [DOI] [PMC free article] [PubMed] [Google Scholar]
- (63).Maldonado E, Soriano-García M, Moreno a, Cabrera N, Garza-Ramos G, de Gómez-Puyou M, Gómez-Puyou a, Perez-Montfort R. Differences in the Intersubunit Contacts in Triosephosphate Isomerase from Two Closely Related Pathogenic Trypanosomes. J. Mol. Biol. 1998;283(1):193–203. doi: 10.1006/jmbi.1998.2094. [DOI] [PubMed] [Google Scholar]
- (64).Zhou J, Lancaster L, Donohue J, Noller HF. Crystal Structures of EF-G-Ribosome Complexes Trapped in Intermediate States of Translocation. Science (Washington, DC, U. S.) 2013;340(6140):1236086. doi: 10.1126/science.1236086. [DOI] [PMC free article] [PubMed] [Google Scholar]
- (65).Bakan A, Dutta A, Mao W, Liu Y, Chennubhotla C, Lezon TR, Bahar I. Evol and ProDy for Bridging Protein Sequence Evolution and Structural Dynamics. Bioinformatics. 2014;30(18):2681–2683. doi: 10.1093/bioinformatics/btu336. [DOI] [PMC free article] [PubMed] [Google Scholar]
- (66).Hanson JA, Duderstadt K, Watkins LP, Bhattacharyya S, Brokaw J, Chu J-W, Yang H. Illuminating the Mechanistic Roles of Enzyme Conformational Dynamics. Proc. Natl. Acad. Sci. U. S. A. 2007;104:18055–18060. doi: 10.1073/pnas.0708600104. [DOI] [PMC free article] [PubMed] [Google Scholar]
- (67).Henzler-Wildman KA, Thai V, Lei M, Ott M, Wolf-Watz M, Fenn T, Pozharski E, Wilson MA, Petsko GA, Karplus M, Hübner CG, Kern D. Intrinsic Motions Along an Enzymatic Reaction Trajectory. Nature. 2007;450:838–844. doi: 10.1038/nature06410. [DOI] [PubMed] [Google Scholar]
- (68).Seyler SL, Beckstein O. Sampling Large Conformational Transitions: Adenylate Kinase as a Testing Ground. Mol. Simul. 2014;40:855–877. [Google Scholar]
- (69).Schlauderer GJ, Proba K, Schulz GE. Structure of a Mutant Adenylate Kinase Ligated with an ATP-Analogue Showing Domain Closure over ATP. J. Mol. Biol. 1996;256(2):223–227. doi: 10.1006/jmbi.1996.0080. [DOI] [PubMed] [Google Scholar]
- (70).Diederichs K, Schulz GE. The Refined Structure of the Complex between Adenylate Kinase from Beef Heart Mitochondrial Matrix and Its Substrate AMP at 1.85 {Å} Resolution. J. Mol. Biol. 1991;217(3):541–549. doi: 10.1016/0022-2836(91)90756-v. [DOI] [PubMed] [Google Scholar]
- (71).Beckstein O, Denning EJ, Perilla JR, Woolf TB. Zipping and Unzipping of Adenylate Kinase: Atomistic Insights into the Ensemble of Open ↔ Closed Transitions. J. Mol. Biol. 2009;394:160–176. doi: 10.1016/j.jmb.2009.09.009. [DOI] [PMC free article] [PubMed] [Google Scholar]
- (72).Lou H, Cukier I. Molecular Dynamics of Apo-Adenylate Kinase: A Distance Replica Exchange Method for the Free Energy of Conformational Fluctuations. J. Phys. Chem. B. 2006;110:24121–24137. doi: 10.1021/jp064303c. [DOI] [PubMed] [Google Scholar]
- (73).Daily MD, Phillips GN, Cui Q. Many Local Motions Cooperate to Produce the Adenylate Kinase Conformational Transition. J. Mol. Biol. 2010;400:618–631. doi: 10.1016/j.jmb.2010.05.015. [DOI] [PMC free article] [PubMed] [Google Scholar]
- (74).Matsunaga Y, Fujisaki H, Terada T, Furuta T, Moritsugu K, Kidera A. Minimum Free Energy Path of Ligand-Induced Transition in Adenylate Kinase. PLoS Comput. Biol. 2012;8:e1002555. doi: 10.1371/journal.pcbi.1002555. [DOI] [PMC free article] [PubMed] [Google Scholar]
- (75).Arora K, Brooks CL. Large-Scale Allosteric Conformational Transitions of Adenylate Kinase Appear to Involve a Population-Shift Mechanism. Proc. Natl. Acad. Sci. U. S. A. 2007;104:18496–18501. doi: 10.1073/pnas.0706443104. [DOI] [PMC free article] [PubMed] [Google Scholar]
- (76).Meador W, Means A, Quiocho FA. Target Enzyme Recognition by Calmodulin: 2.4 A Structure of a Calmodulin-Peptide Complex. Science (Washington, DC, U. S.) 1992;257:1251–1255. doi: 10.1126/science.1519061. [DOI] [PubMed] [Google Scholar]
- (77).Aykut AO, Atilgan AR, Atilgan C. Designing Molecular Dynamics Simulations to Shift Populations of the Conformational States of Calmodulin. PLoS Comput. Biol. 2013;9:12. doi: 10.1371/journal.pcbi.1003366. [DOI] [PMC free article] [PubMed] [Google Scholar]
- (78).Gsponer J, Christodoulou J, Cavalli A, Bui JM, Richter B, Dobson CM, Vendruscolo M. A Coupled Equilibrium Shift Mechanism in Calmodulin-Mediated Signal Transduction. Structure. 2008;16:736–746. doi: 10.1016/j.str.2008.02.017. [DOI] [PMC free article] [PubMed] [Google Scholar]
- (79).Williams JC, McDermott AE. Dynamics of the Flexible Loop of Triosephoshate Isomerase: The Loop Motion Is Not Ligand Gated. Biochemistry. 1995;34:8309–8319. doi: 10.1021/bi00026a012. [DOI] [PubMed] [Google Scholar]
- (80).Cansu S, Doruker P. Dimerization Affects Collective Dynamics of Triosephosphate Isomerase. Biochemistry. 2008;47:1358–1368. doi: 10.1021/bi701916b. [DOI] [PubMed] [Google Scholar]
- (81).Kurkcuoglu O, Jernigan RL, Doruker P. Loop Motions of Triosephosphate Isomerase Observed with Elastic Networks. Biochemistry. 2006;45:1173–1182. doi: 10.1021/bi0518085. [DOI] [PMC free article] [PubMed] [Google Scholar]
- (82).Kurkcuoglu Z, Bakan A, Kocaman D, Bahar I, Doruker P. Coupling Between Catalytic Loop Motions and Enzyme Global Dynamics. PLoS Comput. Biol. 2012;8:e1002705. doi: 10.1371/journal.pcbi.1002705. [DOI] [PMC free article] [PubMed] [Google Scholar]
- (83).Skliros AM, Zimmermann MT, Chakraborty D, Saraswathi S, Katebi AR, Leelananda SP, Kloczkowski A, Jernigan RL. The Importance of Slow Motions for Protein Functional Loops. Phys. Biol. 2012;9:14001. doi: 10.1088/1478-3975/9/1/014001. [DOI] [PMC free article] [PubMed] [Google Scholar]
- (84).Kurkcuoglu Z, Doruker P. Substrate Effect on Catalytic Loop and Global Dynamics of Triosephosphate Isomerase. Entropy. 2013;15(3):1085–1099. [Google Scholar]
- (85).Zarubin T, Han J. Activation and Signaling of the p38 MAP Kinase Pathway. Cell Res. 2005;15(1):11–18. doi: 10.1038/sj.cr.7290257. [DOI] [PubMed] [Google Scholar]
- (86).Kohlstaedt LA, Wang J, Friedman JM, Rice PA, Steitz TA. Crystal Structure at 3.5 A Resolution of HIV-1 Reverse Transcriptase Complexed with an Inhibitor. Science (Washington, DC, U. S.) 1992;256:1783–1790. doi: 10.1126/science.1377403. [DOI] [PubMed] [Google Scholar]
- (87).Whitford PC, Sanbonmatsu KY. Simulating Movement of tRNA through the Ribosome during Hybrid-State Formation. J. Chem. Phys. 2013;139(12):1–9. doi: 10.1063/1.4817212. [DOI] [PMC free article] [PubMed] [Google Scholar]
- (88).Munro JB, Sanbonmatsu KY, Spahn CMT, Blanchard SC. Navigating the Ribosome’s Metastable Energy Landscape. Trends Biochem. Sci. 2009;34(8):390–400. doi: 10.1016/j.tibs.2009.04.004. [DOI] [PMC free article] [PubMed] [Google Scholar]
- (89).Tama F, Valle M, Frank J, Brooks CL. Dynamic Reorganization of the Functionally Active Ribosome Explored by Normal Mode Analysis and Cryo-Electron Microscopy. Proc. Natl. Acad. Sci. U. S. A. 2003;100:9319–9323. doi: 10.1073/pnas.1632476100. [DOI] [PMC free article] [PubMed] [Google Scholar]
- (90).Wang Y, Rader a J., Bahar I, Jernigan RL. Global Ribosome Motions Revealed with Elastic Network Model. J. Struct. Biol. 2004;147(3):302–314. doi: 10.1016/j.jsb.2004.01.005. [DOI] [PubMed] [Google Scholar]
- (91).Trylska J, Tozzini V, McCammon JA. Exploring Global Motions and Corelations in the Ribosome. Biophys. J. 2005;89:1455–1463. doi: 10.1529/biophysj.104.058495. [DOI] [PMC free article] [PubMed] [Google Scholar]
- (92).The PyMOL Molecular Graphics System, Version 1.7.0.5. Schrödinger, LLC; 2014. [Google Scholar]
- (93).Chen VB, Arendall WB, III, Headd JJ, Keedy DA, Immormino RM, Kapral GJ, Murray LW, Richardson JS, Richardson DC. MolProbity: All-Atom Structure Validation for Macromolecular Crystallography. Acta Crystallogr., Sect. D: Biol. Crystallogr. 2010;66(1):12–21. doi: 10.1107/S0907444909042073. [DOI] [PMC free article] [PubMed] [Google Scholar]
- (94).Kolinski A, Bujnicki JM. Generalized Protein Structure Prediction Based on Combination of Fold-Recognition with de Novo Folding and Evaluation of Models. Proteins: Struct., Funct., Genet. 2005;61(Suppl 7):84–90. doi: 10.1002/prot.20723. [DOI] [PubMed] [Google Scholar]
- (95).Kozakov D, Clodfelter KH, Vajda S, Camacho CJ. Optimal Clustering for Detecting near-Native Conformations in Protein Docking. Biophys. J. 2005;89(2):867–875. doi: 10.1529/biophysj.104.058768. [DOI] [PMC free article] [PubMed] [Google Scholar]
- (96).Pontiggia F, Colombo G, Micheletti C, Orland H. Anharmonicity and Self-Similarity of the Free Energy Landscape of Protein G. Phys. Rev. Lett. 2007;98(4):48102. doi: 10.1103/PhysRevLett.98.048102. [DOI] [PubMed] [Google Scholar]
- (97).Cavasotto CN, Kovacs JA, Abagyan RA. Representing Receptor Flexibility in Ligand Docking through Relevant Normal Modes Binding Site. J. Am. Chem. Soc. 2005;127:9632–9640. doi: 10.1021/ja042260c. [DOI] [PubMed] [Google Scholar]
Associated Data
This section collects any data citations, data availability statements, or supplementary materials included in this article.