

Here, Woodward et al. provide direct experimental evidence that defects in mitotic chromosome structure arising from condensin mutation can drive tumourigenesis. Using a hypomorph mouse model, they show that mice inheriting missense mutations in a condensin II subunit (Caph2nes) develop T-cell lymphoma.
Keywords: chromosome structure, condensin, genome instability, lymphoma, mitosis
Abstract
Chromosomal instability is a hallmark of cancer, but mitotic regulators are rarely mutated in tumors. Mutations in the condensin complexes, which restructure chromosomes to facilitate segregation during mitosis, are significantly enriched in cancer genomes, but experimental evidence implicating condensin dysfunction in tumorigenesis is lacking. We report that mice inheriting missense mutations in a condensin II subunit (Caph2nes) develop T-cell lymphoma. Before tumors develop, we found that the same Caph2 mutation impairs ploidy maintenance to a different extent in different hematopoietic cell types, with ploidy most severely perturbed at the CD4+CD8+ T-cell stage from which tumors initiate. Premalignant CD4+CD8+ T cells show persistent catenations during chromosome segregation, triggering DNA damage in diploid daughter cells and elevated ploidy. Genome sequencing revealed that Caph2 single-mutant tumors are near diploid but carry deletions spanning tumor suppressor genes, whereas P53 inactivation allowed Caph2 mutant cells with whole-chromosome gains and structural rearrangements to form highly aggressive disease. Together, our data challenge the view that mitotic chromosome formation is an invariant process during development and provide evidence that defective mitotic chromosome structure can promote tumorigenesis.
Genome integrity is maintained by molecular machines that drive the duplication and segregation of the genome and by checkpoints that monitor for incorrect execution of these processes. As cells enter mitosis, chromosomes undergo profound structural changes, which are driven by topoisomerase II and condensins (Swedlow and Hirano 2003). This process removes catenations between sister chromatids, generates stiff rod-like structures that are competent for chromosome segregation, and is essential for genome propagation through the cell cycle in all eukaryotes.
Condensins belong to the structural maintenance of chromosomes (SMC) complex family that also includes cohesin and SMC5/6. In eukaryotes, each SMC complex contains a heterodimer of SMC ATPase subunits, a single kleisin subunit, and additional accessory factors (Fig 1A; Losada and Hirano 2005; Nasmyth and Haering 2005). Within cohesin and condensin complexes, the C and N termini of kleisin interact with apposing SMC subunits to form a tripartite, asymmetric ring-like structure that can entrap DNA (Gruber et al. 2003; Onn et al. 2007; Nasmyth and Oliveira 2010; Cuylen et al. 2011; Piazza et al. 2014). This mode of association has been proposed to allow SMC complexes to form topological linkages between chromosomes or different regions on the same DNA molecule.
Figure 1.

Missense mutations in Caph2 induce thymic lymphoma. (A) Schematic of the condensin II complex (Bürmann et al. 2013; Piazza et al. 2014). The box indicates the region that is expanded in B. (B, right) Three-dimensional structure of the Smc head domain (SmcHead) and ScpA N-terminal domain (ScpAN) from Bacillus subtilis (Protein Data Bank ID 3ZGX) (Bürmann et al. 2013) is shown using PyMOL. The two noncontiguous sequence regions that together form the Smc ATPase head domain are color-coded in orange (SmcHeadN) and green (SmcHeadC), respectively, while the ScpAN domain fragment is shown in pink. (Left) The side chain of the I15 equivalent residue in B. subtilis ScpA (I22) and its interacting residues is depicted in sphere representation. Note that residues Y44 and M48 form part of the second α helix, which makes direct contact with the SMC coiled coil. (C) Kaplan-Meier plot showing survival of Caph2nes/nes and P53−/− mutant animals. The study was terminated at 15 mo, and surviving animals were examined for tumors during necropsy. (D) Flow cytometry dot plots show the distribution of thymic T-cell subsets according to CD4 and CD8 expression in tissue from young adult mice (±SEM; n = 5) and in representative terminal thymic lymphomas.
Metazoan genomes encode at least two distinct condensin complexes (Ono et al. 2003), which play nonredundant and incompletely understood roles in the regulation of chromosome architecture (Ono et al. 2003; Green et al. 2012; Hirano 2012; Nishide and Hirano 2014; Houlard et al. 2015). Condensin I gains access to chromosomes between prometaphase and telophase, whereas condensin II is present in both the nucleus and cytoplasm during interphase and becomes concentrated on chromosome axes and centromeres during prophase (Hirota et al. 2004; Ono et al. 2004). Loss of condensin I results in shorter wider mitotic chromosomes, whereas loss of condensin II produces long chromosomes with reduced axial rigidity (Ono et al. 2003; Shintomi and Hirano 2011; Green et al. 2012).
Chromosome structure and mitotic fidelity are compromised in many cancers, which leads to numerical and structural chromosome abnormalities and DNA damage. The underlying causes of abnormal mitosis in cancer are not well understood, and it is notable that mutations in known mitotic regulators do not occur at high frequency in cancer genomes. However, successful mitosis requires the concerted activity of hundreds of genes (Neumann et al. 2010). Biologically significant mutations could therefore be distributed across a large number of loci at relatively low frequency per gene. Evidence supporting this hypothesis recently arose from a gene network-based analysis of The Cancer Genome Atlas (TCGA) data set (Leiserson et al. 2015). With the exception of SMC4, mutations in condensin subunits were not statistically enriched in tumor genomes when considered individually; however, statistical significance was reached when subunits were considered together as a single functional entity, reflecting their concerted activity in the cell.
Previous mouse models of condensin deficiency have focused primarily on loss-of-function mutations (Smith et al. 2004; Nishide and Hirano 2014; Houlard et al. 2015), which cause chromosome segregation failure followed by cellular and organismal lethality. However, the majority of condensin mutations in TCGA are missense and are likely to exert sublethal effects on chromosome structure. To directly assess the consequences of hypomorphic condensin II deficiency on development and disease, we studied a viable mouse model carrying a constitutive missense mutation in the condensin II kleisin-β subunit Caph2 (Caph2nes). These mice were reported previously to exhibit a block during T-cell development, resulting in thymic hypoplasia and reduced numbers of circulating T cells (Gosling et al. 2007). During T-cell differentiation in wild-type mice, the earliest thymic progenitors do not express T-cell receptor (TCR) and are double negative (DN) for CD4 and CD8. Successful VDJ recombination at the TCRβ chain locus leads to progression through the β-selection checkpoint and rapid proliferation, during which cells up-regulate CD4 and CD8 to become double positive (DP). These rapidly proliferating early DP cells express the transferrin receptor CD71 (DP CD71+), but this marker is down-regulated upon cell cycle exit (DP CD71−) (Brekelmans et al. 1994), when rearrangement of the TCRα chain locus is completed. In Caph2nes/nes mice, T-cell development is blocked at the transition from DN to DP (Gosling et al. 2007), but the cellular defects and their consequences during aging have not been characterized. We found that Caph2nes/nes mice develop thymic lymphomas with high penetrance and then identified the cell of origin and characterized the cytological and genomic abnormalities that drive condensin II-dependent tumor formation. Our data provide direct experimental evidence that perturbation of the mitotic chromosome condensation apparatus can promote tumorigenesis.
Results
Caph2 mutation causes thymic lymphoma
The Caph2nes allele (I15N) replaces an evolutionarily conserved hydrophobic amino acid for a polar residue in the N terminus of Caph2 (Supplemental Fig. S1A). Based on available crystal structures (Bürmann et al. 2013; Kamada et al. 2013), the equivalent residue (I22) in prokaryotic condensins is largely buried and positioned within the first α helix of the kleisin subunit (ScpA) (Fig. 1A,B). As reported previously (Gosling et al. 2007), the thymuses and spleens of young Caph2nes/nes adults showed a marked reduction in T lymphocytes. Although Caph2nes/nes mice had lower body weight and reduced brain size compared with littermate controls (Martin et al. 2016), the development of lymphoid organs was disproportionately affected (Supplemental Fig. S1B).
To determine whether sublethal condensin II perturbation predisposes to cancer, a cohort of Caph2nes/nes mice was aged for 15 mo. Necropsy revealed lymphoma in nine of nine aged individuals compared with zero of eight controls (Fisher's exact, P < 1 × 10⁻⁴) (Fig. 1C). Other than a single case of leiomyosarcoma in a Caph2nes/nes animal with concurrent lymphoma, no other tumors were identified upon necropsy. More than half of the Caph2nes/nes cohort became terminally ill within the 15-mo study period (log rank, P < 0.02) (Fig. 1C). Lymphoma cells typically took over the thymus, spleen, and lymph nodes and infiltrated the lungs, kidneys, and liver (Supplemental Fig. S1B; data not shown). Lymphoma cells were either CD4+CD8+ DP or CD4loCD8+ (Fig. 1D), revealing their origin from thymic T progenitor cells that had progressed through the TCRβ selection checkpoint.
The cell cycles following thymic β selection are known to be particularly vulnerable to genomic instability because the most rapid spontaneous tumors to develop in P53-null mice are lymphomas with a CD4+CD8+ and immature CD4loCD8+ immunophenotype (Donehower et al. 1992; Jacks et al. 1994). To assess the role of P53 during Caph2-dependent lymphomagenesis, Caph2nes/nes; P53−/− double-homozygous mutants (referred to here as “double mutants”) were derived by intercrossing Caph2nes/nes; P53+/− parents. Double mutants were recovered at approximately Mendelian ratios (19% at weaning; n = 121; Fisher's exact, P = 0.35).
To monitor the early stages of tumor development, we made use of the fact that each T cell undergoing β selection carries a unique rearrangement at the TCRβ locus. This can be used as a molecular barcode to quantify clonal expansion, where the proportion of identical V-D-J sequences detectable in genomic DNA from the thymus should increase (Supplemental Material; Dudgeon et al. 2014). Such increases can be detected by deep sequencing of PCR amplicons spanning the variable to constant regions of the TCRβ locus (Dudgeon et al. 2014). At 3-wk post-partum, the highest proportion of replicated T-cell clones in the thymus of wild-type, Caph2nes/nes, or P53−/− single-mutant animals ranged from 0.05% to 0.19%, indicating that no substantial clonal expansion had occurred by this stage (Fig. 2). In contrast, the thymus of double-mutant animals already contained several expanded clones by 3-wk post-partum, with four or five distinct clones each comprising >1% of total sequence reads, and at least one clone accounting for >20% of the TCRβ rearrangements detected (Fig. 2). Clonal expansion in P53−/− single-mutant animals is first detectable at 9-wk post-partum (Dudgeon et al. 2014); hence, Caph2 mutation greatly accelerates the outgrowth of clonal T-cell populations in the thymuses of juvenile P53−/− animals.
Figure 2.

Caph2 mutation accelerates T-cell clonal outgrowth in a P53-dependent manner. Pie charts show the frequency of the five most abundant TCRβ clones (gray segments) in the thymuses of animals of different genotypes at 3-wk post-partum relative to the remainder of clones detected in each sample (white segment). The percentage of the top two clones in each sample is listed at the right of each chart. Data for P53 single-mutant animals were published previously (Dudgeon et al. 2014) and reanalyzed through the ImmunoSeq Analyzer portal on the Adaptive Biotechnologies Web site.
An aging cohort of 14 double mutants all became terminally ill within 100 d (median survival 81 d) (Fig. 1C), with massive thymic lymphoma apparent in every case. This represents a substantially reduced survival relative to either mutation alone (median 447 d for Caph2nes/nes; 144 d for P53−/−; Log rank P < 0.001 for both comparisons) (Fig. 1C). No evidence of nonlymphoid tumors was observed upon necropsy of double-mutant animals.
Abnormal metaphase chromosome structure and anaphase in Caph2nes/nes thymocytes
It has been reported previously that thymic T-cell development is impaired during the DN-to-DP transition in young adult Caph2nes/nes individuals (Gosling et al. 2007), which is also the stage during which our data reveal that lymphomas arise in aged animals (Fig. 1D). The cellular defects that block T-cell development in Caph2nes/nes animals are known to be T-cell-autonomous and independent of VDJ recombination (Gosling et al. 2007), but it is not known whether they affect mitosis or possible alternative functions of condensin II during interphase (Gosling et al. 2007; Rawlings et al. 2010; Wood et al. 2010).
Although we found that interphase cells at the DP stage were increased in size in Caph2nes/nes animals, this was attributable to increased ploidy rather than interphase chromosome decompaction because no difference in size was apparent between wild-type and mutant cells of equivalent DNA content (Supplemental Fig. S2A). No evidence for localized chromatin decondensation was observed in analyses of mean squared distances (d2) between fluorescence in situ hybridization (FISH) probes (Eskeland et al. 2010) separated by 0.1 Mb at the nonexpressed HoxA locus (Supplemental Fig. S2B) or 0.1, 1, and 5 Mb at the expressed CD8 locus (Supplemental Fig. S2C) in DP CD71+ Caph2nes/nes cells. Radial positioning (Supplemental Fig. S2D) and chromocenter clustering (J Woodward, unpubl.) were also not significantly affected by Caph2 mutation.
Expression microarray comparisons between DP thymocyte subsets from Caph2+/+ and Caph2nes/nes animals revealed only subtle effects on the transcriptome (R2= 0.99), as expected for comparisons between carefully stage-matched cell populations (Supplemental Fig. S3A). However, gene ontology enrichment analysis performed on gene lists ranked by fold change revealed functional classifiers that were strongly enriched among genes up-regulated in Caph2nes/nes cells (Supplemental Fig. S3). In both the rapidly cycling CD71+ and the quiescent CD71− DP population, the most significantly enriched terms centered on metabolism and proteostasis (Supplemental Fig. S3B,C; Supplemental Tables S1 and S2). Each of these processes has recently been implicated in the cellular stress response to aneuploidy (Torres et al. 2007; Williams et al. 2008; Sheltzer et al. 2012). Thus, although a tumor-causing mutation in Caph2 influences the size and transcriptional profile of premalignant cells, both differences are consistent with perturbation of the mitotic cell cycle. However, more subtle direct effects on interphase chromosome structure cannot be excluded.
We next sought evidence of abnormal cell cycle progression in premalignant Caph2nes/nes cells from the relevant developmental stage. DN thymocytes were purified from young adults before tumor onset by fluorescence-activated cell sorting (FACS) and cultured on monolayers of OP9-DL1 stromal cells (de Pooter and Zúñiga-Pflücker 2007), where they underwent extensive proliferation and differentiated into DP cells. Caph2nes/nes thymocytes showed impaired proliferation and differentiation in this ex vivo system (Supplemental Fig. S4A,B), validating its utility for mechanistic studies.
To address whether mitotic entry was delayed in primary Caph2nes/nes thymocytes, we used a BrdU chase assay to follow the kinetics of progression from S phase into M phase (Fig. 3A). BrdU and nocodazole were added simultaneously to day 5 OP9/DL1 cultures in order to label cells in S phase and arrest cells in prometaphase, respectively. Over a 4-h time course, we then used flow cytometry to measure the fraction of BrdU-labeled cells in mitosis based on expression of the mitotic marker histone H3 phosphorylated at Ser10 (pH3S10). Caph2 mutation did not affect the rate at which BrdU-labeled cells accumulated in mitosis (two-tailed t-test, P > 0.1 for all time points) (Fig. 3B).
Figure 3.

Tumor-causing Caph2 mutations impair mitotic progression. (A) Overview of the BrdU chase experiment to assess the progression of primary CD4+CD8+ thymocytes from S phase into M phase. (B) Line graph showing the accumulation of BrdU+ cells in M phase (pH3S10+) over a 4-h time course, as described in A. Error bars show SEM of two biological replicates and are representative of two independent experiments. (C) Mitotic phase distribution of unsynchronized H3S10P+ thymocytes from wild-type (blue) and Caph2nes/nes (red) OP9-DL1 cocultures stained with anti-H3S10P, anti-α-tubulin, and DAPI. Cells staining positive for the mitotic marker H3S10P were visually assigned to one of three mitotic phase categories. Data were pooled from two biological replicate experiments. n = 59 mitotic cells for Caph2+/+; n = 111 for Caph2nes/nes. (*) P < 0.003, two-tailed Fisher's exact. (D) Examples of anaphase/telophase cells following MG132 washout in Caph2nes/nes OP9/DL1 cocultures, costained for α-tubulin (green), H3S10P (red), and DAPI (blue). For clarity, tubulin staining is shown in only the multipolar spindle image. Bars, 3 µm. (E) The percentage of normal and abnormal anaphase/telophase T cells from OP9/DL1 cocultures 1 h following MG132 washout for wild type and the Caph2 mutant. Data represent one experiment. (F) Structured illumination microscopy (SIM) images of DAPI-stained metaphase chromosomes from wild-type (top) and Caph2nes/nes (bottom) cells. Images are representative of >30 metaphase spreads from three independent experiments.
To determine whether cell cycle progression was impaired after mitotic entry, immunofluorescence was performed on thymocytes grown on OP9-DL1 cocultures in the absence of nocodazole using antibodies against α-tubulin and pH3S10, and the proportion of pH3S10+ cells at different stages of mitosis was assessed. Cells at later stages (late anaphase and telophase) were significantly underrepresented relative to earlier stages in the Caph2nes/nes mutant cultures (Fisher's exact, P < 0.003) (Fig. 3C), indicating a cell cycle block that impaired progression into successful anaphase. To enrich for anaphase cells, primary Caph2nes/nes thymocytes from OP9/DL1 cocultures were released into anaphase following washout of the proteasome inhibitor MG132. Immunofluorescence revealed an elevated frequency of abnormalities (Fisher's exact, P < 0.0001), primarily comprising anaphase bridges plus occasional lagging chromosomes, multipolar spindles, and micronuclei (Fig. 3D,E). These mitotic abnormalities are likely to originate from defective mitotic chromosome structure because metaphase chromosomes showed a characteristic “zig-zag” appearance following hypotonic treatment (Fig. 3F), similar to previous reports of condensin II deficiency in immortalized vertebrate cells (Ono et al. 2003; Green et al. 2012). Abnormal mitosis had a profound effect on the ploidy of proliferating DP thymocytes, with an accumulation of cells with a DNA content of 4N or greater (Supplemental Fig. S4C). Importantly, T cells with abnormal ploidy were already abundant in neonatal Caph2nes/nes mice (Supplemental Fig. S4C) substantially before clonal expansion is first detectable (Fig. 2). The profound mitotic abnormalities evident in Caph2nes/nes T cells therefore precede malignant transformation and cannot be a downstream consequence.
Given that mitosis is thought to be a cell type-invariant process, we next sought to determine whether ploidy is perturbed to a similar extent in all cell types of Caph2nes/nes mice. Multiparametric flow cytometry was used to compare cellular DNA content as hematopoietic stem and early progenitor cells from Caph2nes/nes and control animals differentiate into αβ-T and B lymphocytes in vivo (Fig. 4; Supplemental Figs. S5, S6). This revealed that ploidy was largely unaffected by Caph2 mutation in bone marrow progenitor populations, B cells, and early thymic T-cell subsets, with abnormalities becoming evident only from the β-selection stage of T-cell development onwards (Fig. 4; Supplemental Fig. S5). This cell type-specific phenotype was not simply attributable to a greater proportion of proliferating cells because BrdU incorporation was detected in a comparable percentage of DP CD71+ T cells (61%) (Supplemental Fig. S5H) and B cells at the fraction C stage (59%) (Supplemental Fig. S5D) in wild-type mice, yet abnormal ploidy in Caph2 mutants was restricted to T cells (Fig. 4).
Figure 4.

Mitotic perturbation arises specifically in the tumor-initiating cell population. Flow cytometry histograms show cellular DNA content profiles during differentiation of T and B lymphocytes from multipotent progenitors in vivo. Tissues were harvested at 6–8 wk, before tumors are first detected. The tumor-initiating cell population (DP CD71+) is highlighted with a red box. Gates represent the 4N and >4N populations, which are quantified here for the tumor-initiating cell population and for all B-cell and T-cell subsets in Supplemental Figure S5. B-cell subsets were classified into Hardy fractions A–F (Hardy et al. 1991). Gating schemes used to identify each population are shown in Supplemental Figure S6, and cell surface markers and antibodies are listed in Supplemental Tables S5 and S6, respectively. Each histogram represents at least 2000 cells and is representative of three biological replicates for progenitor subsets and five biological replicates for T-cell and B-cell subsets.
Together, these data demonstrate that germline hypomorphic mutation in Caph2 impairs cell cycle progression at a specific stage of αβ-T-cell development; CD4+CD8+ thymocytes enter mitosis with normal kinetics but abnormal chromosome structure, which leads to anaphase bridges and impaired mitotic progression in premalignant cells, preceding tumor initiation. Moreover, our studies of hematopoietic differentiation demonstrate that the same mutation in condensin II can elicit different effects on chromosome segregation in different proliferative cell types, which suggests that the formation of segregation-competent mitotic chromosomes is a developmentally regulated process.
Exit from Caph2-deficient mitosis leads to DNA damage, tetraploidy, and P53 activation
Using imaging flow cytometry, we next assessed the incidence of DNA damage in primary thymocytes at different phases of the cell cycle by the simultaneous quantification of γH2AX foci, BrdU incorporation, and DNA content (Fig. 5A–C). In the smallest 25% of cells with 2N DNA content, which includes cells that have recently completed mitosis, γH2AX foci occurred in 85% of Caph2nes/nes, compared with just 2% of wild-type cells (Supplemental Fig. S7). The average number of discrete γH2AX foci per nucleus was also significantly increased by Caph2 mutation (Fig. 5C; Supplemental Fig. S7B). However, elevated frequencies of cells with γH2AX foci were also observed in S and G2 phase (Fig. 5B), which could be explained by defective DNA repair or the ongoing acquisition of damage during S phase.
Figure 5.
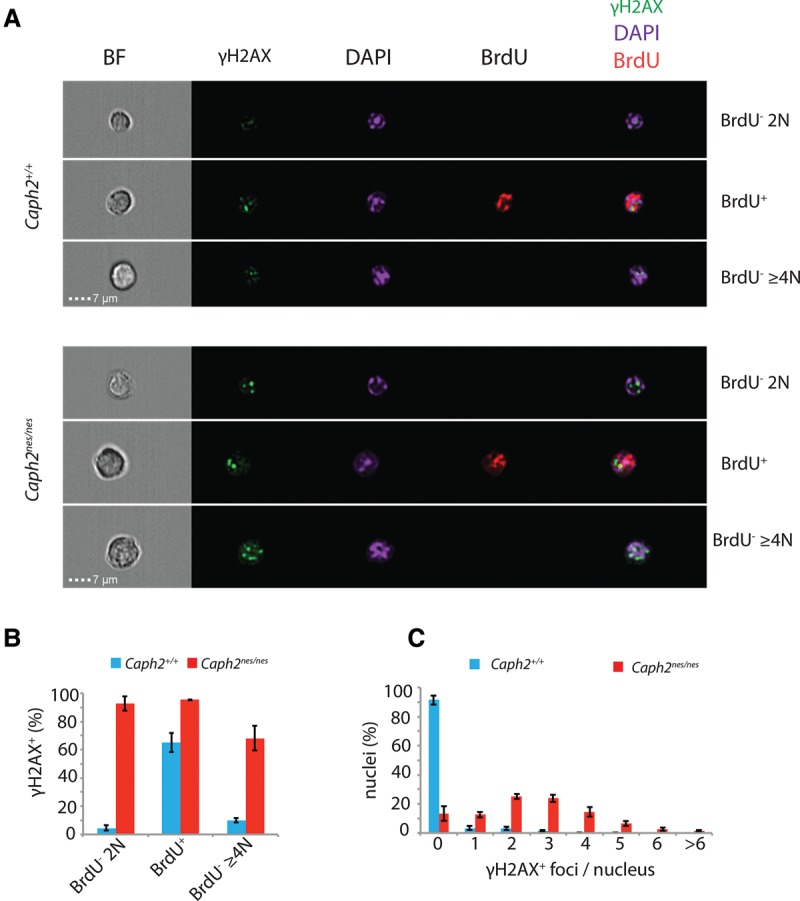
Widespread DNA damage in Caph2 mutant thymocytes. (A) Multispectral images showing representative thymocytes from different cell cycle stages, classified based on DNA content and BrdU incorporation. Images were acquired on an ImageStream flow cytometer using a 60× objective. (B) Histogram showing the percentage of cells with at least one bright γH2AX focus at different cell cycle stages. (C) Histogram showing the frequency of γH2AX foci per nucleus across all cell cycle stages. For B and C, error bars show SEM of n = 3 biological replicate experiments, each comprising 10,000 cells per sample.
In addition to diploid cells with DNA damage, we found an abundance of abnormally large DP cells that had undergone cell cycle arrest (Fig. 6A,B). Quantification of DNA content in this population revealed that they were 4N (Fig. 6C), suggesting arrest either during G2 or in a tetraploid G1 phase. However, given that Caph2nes/nes thymocytes progress from S phase to M phase with normal kinetics (Fig. 3B), we hypothesized that a tetraploid G1 was the more likely scenario. To confirm this, we assessed sister chromatid cohesion in FACS-purified 4N cells using FISH experiments that combined fosmid probes and chromosome paints (Fig. 6D). This revealed that, contrary to the expectation for a G2 cell, the four chromosomal homologs were typically not subject to sister chromatid cohesion (Fig. 6D,E). We therefore conclude that these arrested 4N cells, which make up at least 20% of all CD4+CD8+ cells in the Caph2nes/nes thymus (Fig. 6A,B), are arrested in a tetraploid cell cycle phase resembling G1, presumably following mitotic exit without completing chromosome segregation and cytokinesis.
Figure 6.
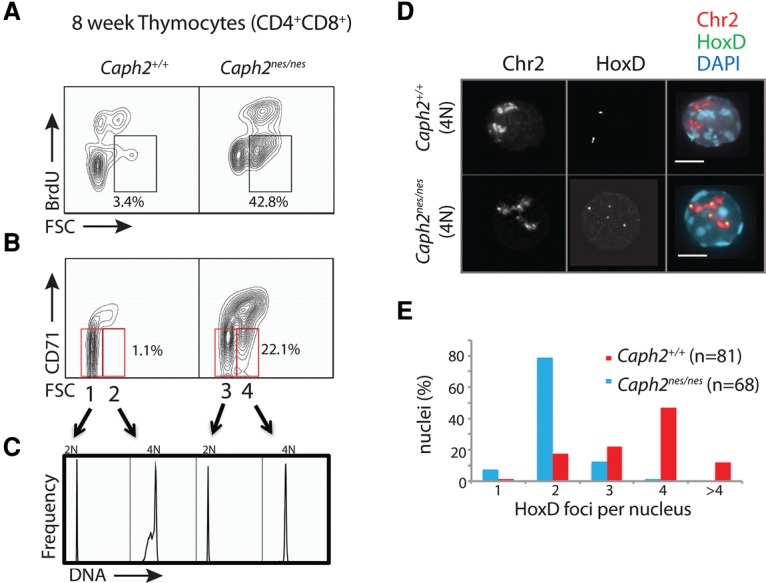
Genome doubling causes cell cycle exit in Caph2 mutant thymocytes. (A) Flow cytometry contour plots (gated on CD4+CD8+ thymocytes from 6-wk to 12-wk animals) showing a substantial increase in the proportion of abnormally large (FSChi) nonproliferating (BrdU−) cells in Caph2nes/nes animals. Percentages represent mean values from three biological replicates. (B) Contour plots are presented as in A, with proliferation status measured by cell surface expression of CD71. Gates that define populations 1–4 in C are shown in red. Percentages represent mean values from three biological replicates. (C) DNA content of populations 1–4 from B, determined by flow cytometry quantification of DAPI fluorescence. The noncycling population that is greatly expanded in the Caph2nes/nes mutant thymus (FSChiCD71lo) is exclusively 4N. Data are representative of five biological replicates. (D) FISH analysis of FACS-purified nonproliferating large thymocytes (populations 2 and 4 in B) using a chromosome 2 (Chr2) exome paint (red) and a probe (green) corresponding to the HoxD locus (HoxD) on chromosome 2. Two paired fosmid signals per nucleus are visible in population 2, whereas population 4 has four individual signals per nucleus, indicating the absence of sister chromatid cohesion. Bar, 4 μm. (E) Quantification of spatially separated (>0.5 µm) HoxD signals is depicted in the histogram. Data were pooled from two biological replicates. n = 81 Caph2+/+; n = 68 Caph2nes/nes.
P53-dependent checkpoints ordinarily limit the proliferation of cells with DNA damage (Kastan et al. 1991; Lowe et al. 1993) and abnormal ploidy (Fujiwara et al. 2005; Thompson and Compton 2010) and play a key role in suppressing lymphomagenesis in both wild-type (Donehower et al. 1992) and Caph2nes/nes animals (Figs. 1C, 2). To interrogate the signaling pathways operating downstream from P53 in Caph2nes/nes thymocytes, we assessed the expression of 84 known P53 targets by quantitative RT–PCR (qRT–PCR) in noncycling (CD71−) DP cell populations isolated from young animals prior to tumor establishment. Key regulators of apoptosis (Noxa and Fas) and cell cycle arrest (Cdkn1a) were up-regulated by >2.5-fold in Caph2nes/nes thymocytes in a P53-dependent manner (Supplemental Fig. S8A; Supplemental Table S3). Notably, we found that the up-regulation of P53 targets occurred in cells with 2N as well as 4N DNA content (Supplemental Fig. S8B), demonstrating that P53 signaling is activated regardless of whether cells exit mitosis in a diploid or tetraploid state.
P53 status determines copy number changes in Caph2 mutant tumors
To characterize genomic changes that accompany lymphomagenesis in Caph2 mutant T cells, we performed shallow whole-genome sequencing (Scheinin et al. 2014) of genomic DNA extracted from terminal tumors of animals with germline mutation in Caph2 and P53 (Fig. 7; Supplemental Fig. S9). Whole-chromosome aneuploidy (WCA) was rare in terminal tumors from Caph2nes/nes single mutants (n = 7 tumors; mean WCA = 1.4; median WCA = 1) (Fig. 7B). Absolute copy number enumeration of selected loci by FISH (Supplemental Fig. S10) confirmed that Caph2nes/nes single-mutant tumors were near diploid rather than tetraploid. Although deletions spanning the P53 locus were not apparent in Caph2nes/nes single-mutant lymphomas, several top-scoring deletions encompassed key P53 pathway components such as Cdkn2a and Pten and other known suppressors of human T-cell malignancy such as Bcl11b (Supplemental Table S4; Gutierrez et al. 2011). Thus, despite the abundance of tetraploid cells in the premalignant DP population (Figs. 4, 6; Supplemental Fig. S4C), these data argue that tumors from Caph2nes/nes; P53+/+ mice initiate from cells that acquire DNA damage and mutation without undergoing genome doubling (Fig. 5; Supplemental Fig. S7).
Figure 7.

P53 status determines the frequency of WCA and segmental aneuploidy in Caph2 mutant tumors. (A) Example copy number aberration (CNA) plots showing read depth from shallow whole-genome sequencing of Caph2nes/nes; P53+/+, Caph2+/+; P53−/−, and Caph2nes/nes; P53−/− double-mutant tumors. Copy number gains are shown in red, and deletions are shown in blue. Additional plots are shown in Supplemental Figure S9. (B) Frequency of WCAs based on shallow whole-genome sequencing in tumors arising on the indicated genotypes and control DNA from aged (9–15 mo) Caph2nes/nes tail. Red bars indicate the mean. Error bars show SEM. Brackets above the plot link conditions for which two-tailed t-tests gave significant P-values (<0.001). (C) Frequency of CNAs ≥1 Mb, presented as in B. Error bars link conditions for which two-tailed t-tests gave significant P-values (<0.03). (D) Frequency of CNAs ≥30 kb, presented as in B. Error bars link conditions for which two-tailed t-tests gave significant P-values (<0.05).
Tumors from double-mutant animals contained significantly more WCAs than Caph2nes/nes single mutants (n = 13 tumors; mean WCA = 7.3; median WCA = 6; two-tailed t-test P < 0.001) (Fig. 7B; Supplemental Fig. S9). Double-mutant tumors also contained, on average, twofold to threefold more segmental copy number aberrations (CNAs) compared with Caph2 single-mutant tumors and >25-fold more than tail DNA (Fig. 7C,D). Recurrently amplified regions contained known oncogenic drivers of human malignancy, including Notch (12 of 13 tumors) and Smyd2 (11 of 13 tumors). We conclude that the large population of cells with abnormal ploidy, which is present in the Caph2nes/nes thymus before clonal expansion, has the potential to form highly aggressive tumors but is ordinarily prevented from doing so by a P53-dependent mechanism.
Discussion
In this study, we provide experimental support for the hypothesis that condensin dysfunction can promote tumorigenesis (Ham et al. 2007; Longworth et al. 2008; Coschi et al. 2010, 2014; Manning et al. 2010; Hirano 2012). We found that tumors initiate from thymic T cells progressing from the DN to DP stage, which allowed us to characterize the cellular abnormalities that precede and therefore presumably drive Caph2-dependent malignancy. Through detailed cytological analysis of tumor-initiating cells in the thymuses of Caph2nes/nes mice, we show that a tumor-causing mutation in Caph2 does not promote global decondensation of interphase chromatin (Supplemental Fig. S2) or major changes in developmental gene expression programs (Supplemental Fig. S3). However, we leave open the possibility that the Caph2nes mutation impairs interphase processes in a manner that was not detected in our study.
Abundant evidence was obtained for a direct effect of the Caph2nes mutation on mitosis. Tumor-initiating cells at the DP CD71+ stage of T-cell differentiation show impaired mitotic progression, but not mitotic entry (Fig. 3), and generate two distinctly abnormal cell populations upon mitotic exit. Diploid cells show extensive DNA damage (Fig. 5; Supplemental Fig. S7), and we propose that when such damage yields mutations in tumor suppressor genes such as Cdkn2a, Pten, or Bcl11b (Supplemental Table S4), this population can give rise to the near diploid lymphomas observed in aging Caph2nes/nes animals (Fig. 7A; Supplemental Figs. S9, S10). In addition, a large fraction (>20%) of all DP thymocytes in young Caph2 mutants exits mitosis in a tetraploid state (Fig. 6B,C).
The fact that tumors in Caph2nes/nes animals with an intact P53 pathway do not show frequent whole-chromosome gains argues that tetraploidy does not promote malignancy in the presence of P53, consistent with previous reports (Fujiwara et al. 2005). Under these circumstances, we speculate that mitotic exit in the tetraploid state may be a more favorable outcome for cells with persistent catenations than completion of chromosome segregation with DNA damage because the latter has greater potential to generate oncogenic mutations.
Disease progression is markedly accelerated when the P53 pathway is disabled (Fig. 1C), where abnormal clonal outgrowth is readily detectable by deep sequencing of the TCRβ repertoire during the first 3 wk of life (Fig. 2). In a Caph2nes/nes P53−/− background, dominant clones exhibit multiple whole-chromosome gains (Fig. 7A; Supplemental Fig. S9D) or evidence of genome doubling (Supplemental Fig. S9D). The high fraction of viable tetraploid cells that arise spontaneously in the Caph2nes/nes thymus (Fig. 6), combined with the rapid and highly reproducible course of disease progression in Caph2nes/nes P53−/− animals (Figs. 1C, 2), provides an attractive model for future studies on the pathological consequences of genome doubling in vivo.
In a companion study, we describe a cohort of four human patients with germline condensin mutations that result in microcephalic primordial dwarfism (Martin et al. 2016). One of these patients died from malignant anaplastic medulloblastoma at the age of 11, which suggests that germline condensin deficiency may increase the risk of tumorigenesis in humans. Somatic condensin mutations occur in a small but statistically significant fraction of human cancers (4.2%) (Leiserson et al. 2015), and a large majority of condensin mutations in the COSMIC database (http://cancer.sanger.ac.uk/cosmic) comprises missense substitutions analogous to Caph2nes (Fig. 1B; Supplemental Fig. S1A). However, genomic analyses of human T-cell leukemias and lymphomas (Zhang et al. 2012; Kataoka et al. 2015) indicate that condensin mutations are no more frequent than in other tumor types, suggesting that the strong tissue selectivity reported here is likely to be species-specific. The reasons that murine T-cell development is uniquely vulnerable to global condensin II mutation are likely to be multifaceted but could involve kinetic properties of the cell cycle or stress responses arising from aberrant mitosis that distinguish the highly proliferative cells at the DN-to-DP transition from other somatic cell types.
Several recent reports have provided evidence that condensin II function could be impaired in human tumors via a more widespread mechanism that does not require mutations in the core complex (Longworth et al. 2008; Coschi et al. 2010, 2014; Manning et al. 2010). Mutations in the Rb tumor suppressor, which is among the most frequently mutated genes in a broad range of human tumors, partially impair condensin II loading and function (Longworth et al. 2008; Coschi et al. 2010, 2014; Manning et al. 2010). This provides a possible explanation for the high levels of chromosomal instability reported in Rb1-deficient tumors and, together with the data reported here, suggests that the clinical relevance of this alternative Rb1 function should be carefully evaluated.
Materials and methods
Animals and primary cell isolation
The animal studies described here were carried out under the guidance issued by the Medical Research Council in Responsibility in the Use of Animals for Medical Research (July 1993) and Home Office Project License no PPL60/4424. Animals were housed in individually ventilated cages within the Biomedical Research Facility at the Western General Hospital, Edinburgh. Tumor samples from Caph2+/+; P53−/− tumors used for copy number analysis were from animals housed in the Biological Services Unit facilities at the Cancer Research UK Beatson Institute under project license PPL60/4181. The Caph2nes (Nelms and Goodnow 2001; Gosling et al. 2007) and P53− (Jacks et al. 1994) mutations were generated as described previously and maintained on a C57BL6/J background. Unless otherwise stated, nontumor tissues were harvested from 6- to 12-wk animals and processed immediately. No differences in T-cell phenotype were observed between male and female mice; hence, animals of either gender were used interchangeably. Female mice were used for all aging studies, with the exception of the Caph2nes/nes P53−/− genotype, for which males were used due to a low frequency of female mice recovered.
Single-cell suspensions were obtained from thymuses by gentle tissue dissociation through a 40-µm filter and from femurs and tibias by flushing bone cavities with PBS (B cells) or crushing bones with a pestle and mortar (LSK and CLP populations). Tissues were collected and processed immediately following termination, and cell counts were conducted on a Moxi-Z automated cell counter (Orflo). For BrdU incorporation studies, 150 µL of 10 mg/mL BrdU solution was injected into the intraperitoneal cavity 2 h prior to termination.
Cell culture
For primary T-cell cultures, CD4+ and CD8+ thymocytes were depleted using MACS beads (Miltenyi) according to the manufacturer's instructions. For the proliferation and differentiation assays shown in Supplemental Figure S4 and the mitotic studies shown in Figure 3, DN3 cells were then purified by FACS using surface expression of CD25 and CD44. For the BrdU chase experiment in Figure 3, A and B, total DN cells were seeded, whereas, for all other OP9/DL1 experiments of mitosis and cell cycle progression, DN3 cells were seeded directly following FACS purification. Details of cell surface marker combinations used for immunophenotyping are in Supplemental Table S5. DN cells (1 × 10⁵ to 5 × 10⁵ cells) or DN3 cells (2.5 × 10⁴ cells) were seeded onto each well of a six-well plate containing subconfluent monolayers of OP9-DL1 stromal cells in α-MEM medium (+nucleosides) supplemented with 20% fetal bovine serum, 1% penicillin/streptomycin, 15 µM β-mercaptoethanol, and 1 ng/mL IL-7 (Peprotech). Cell cycle studies were conducted 4 or 5 d after seeding total DN cells, when lymphocytes were removed from monolayers by gentle pipetting and then passed through a 40-µm filter to remove clumps of stromal cells before further processing. For BrdU chase experiments, 10 µM BrdU (final concentration) and 300 ng/mL nocodazole were added to cultures on day 4 or 5, and cells were collected at the specified time points before staining for cell surface markers pH3S10 and BrdU using the APC BrdU Flow kit (BD Pharmingen) according to the manufacturer's instructions, with pH3S10 antibody added at the same time as anti-BrdU.
Immunofluorescence
Cells from OP9-DL1 cocultures were washed once with PBS and allowed to settle on polylysine-coated coverslips. For MG132 release, MG132 (Cayman) was added to day 4 OP9/DL1 cocultures to a final concentration of 15 µM. After 2 h, T cells were removed by gentle pipetting, washed once with PBS, and seeded on fresh OP9-DL1 monolayers in medium lacking MG132. After 60 min, T cells were removed by gentle pipetting and allowed to settle on polylysine-coated coverslips. Cells were fixed in 4% paraformaldehyde for 10 min, washed three times for 5 min in PBS (referred to here as “washed”), permeabilized in 0.5% Triton X in PBS for 10 min, washed, blocked in goat or donkey serum (5% in PBS) for 30 min, incubated with primary antibodies overnight at 4°C, washed, incubated with secondary antibodies for 1 h at room temperature, washed, incubated in 0.5 µg/mL DAPI for 5 min, and then mounted in VectaShield (Vector Laboratories). Antibodies used in this study are in Supplemental Table S6.
Metaphase spreads
To generate metaphase spreads, cells were treated with hypotonic solution (0.5% sodium citrate, 0.25% potassium chloride in deionized water) and fixed in 3:1 methanol:acetic acid added drop-wise while vortexing the sample. The samples were incubated for 30 min at room temperature before centrifugation, resuspended in 10 mL of fix, and stored overnight at −20°C. The cell suspension was dropped onto high-precision coverglass (Marienfelt), stained with 50 ng/mL DAPI in PBS, and mounted in Prolong Gold (Life Technologies). Three-dimensional structured illumination microscopy (SIM) images were acquired on a N-SIM (Nikon Instruments) using a 100× 1.49 NA lens and refractive index-matched immersion oil (Nikon Instruments). SIM images were reconstructed using NiS Elements software (Nikon Instruments) from a z-stack comprised of no less than 1 µm of optical sections.
FISH probe synthesis, hybridization, and image analysis
To prepare nuclei for three-dimensional FISH, cells were allowed to settle on polylysine-coated slides, fixed in 4% PFA for 10 min at 37°C, washed, permeablized in 0.5% Triton X in PBS for 10 min, washed, and left to dehydrate at room temperature before being stored for up to 2 mo at −80°C. Upon thawing, slides were rinsed in 2× SSC and then incubated in 2× SSC containing 100 µg/mL RNase (Roche) for 1 h at 37°C. Slides were washed in 2× SSC and then dehydrated through a series of 2-min ethanol washes (70%, 90%, and 100%) before being air-dried. Slides were then heated for 5 min in a 70°C oven and denatured for 30 min at 80°C in 70% formamide/2× SSC (pH 7.5). The slides were transferred to ice-cold 70% EtOH for 2 min before further dehydration in 90% and 100% ethanol for 2 min each at room temperature.
With the exception of the experiment presented in Figure 5 (see below), all FISH probes were generated from fosmids (details in Supplemental Table S7). To prepare fosmid probes, DNA was isolated using standard alkaline lysis and labeled by nick translation with digoxigenin-11-dUTP or biotin-16-dUTP (Roche). Approximately 70–100 ng of fosmid was used per slide, together with 18 µg of mouse Cot1 (Invitrogen) DNA and 5 µg of salmon sperm DNA (Sigma). Ethanol-precipitated DNA was resuspended in 15 µL of hybridization mix (50% deionized formamide, 10% dextran sulfate, 1% Tween 200 in 2× SSC). Probes were denatured for 5 min at 70°C and then reannealed at 37°C before being applied to the slide and sealed under a coverslip at 37°C. After 48 h, coverslips were removed, and slides underwent four 2-min washes in 2× SSC at 45°C and then four 3-min washes in 0.1× SSC at 60°C. Slides were then transferred to 4× SSC/0.1% Tween at room temperature before a 5-min incubation with blocking buffer (4× SSC, 5% Marvel) under a coverslip. Biotinylated probes were detected using 1 mg/mL Texas Red (TR)-conjugated avidin stock diluted 1:500 in blocking buffer followed by 0.5 mg/µL biotinylated antiavidin (BAA) diluted 1:100 and a final layer of 1 mg/mL TR-conjugated avidin diluted 1:500. Digoxigenin-labeled probes were detected with sequential layers of 200 µg/mL fluorsecein isothiocyanate (FITC)-conjugated anti-digoxigenin diluted 1:20 and 1.5 mg/mL FITC-conjugated anti-sheep diluted 1:100. All antibodies were obtained from Vector Laboratories with the exception of FITC-conjugated anti-digoxigenin, which was obtained from Roche. Antibody incubations were carried out in a humid chamber for 30–60 min at 37°C followed by three 2-min washes in 4× SSC/0.1% Tween at 37°C before the addition of the next layer of antibody. After the last antibody incubation, slides were incubated in 4× SSC/0.1% Tween with 50 ng/mL DAPI for 2 min before mounting in VectaShield (Vector Laboratories).
For the experiment to assess sister chromatid cohesion presented in Figure 6, D and E, both the chromosome 2 exome paint and 130-kb HoxD-specific probe were generated by direct labeling of liquid-phase oligonucleotide pools obtained using sequence capture technology (Boyle et al. 2011). The oligonucleotide isolation, labeling, and hybridization steps were performed as described previously (Boyle et al. 2011). To assess sister chromatid cohesion, we FACS-purified 4N cells and counted the number of distinct HoxD signals per nucleus. For quantification purposes, only signals separated by >0.5 µm were counted. Probes generated from oligonucleotide pools (Fig. 6D,E) lacked repetitive sequences, and hence false positive signals were greatly reduced.
Flow cytometry, FACS, and imaging flow cytometry
Single-cell suspensions were incubated with antibodies against cell surface antigens for 10 min at room temperature and washed once in PBS prior to analysis. The combination of cell surface markers used to identify each cell population is in Supplemental Table S5, with antibody details in Supplemental Table S6. For DNA content analysis, surface stains were fixed using the CytoFix/CytoPerm kit (BD) according to the manufacturer's instructions before a secondary fixation step in cold 70% ethanol for 20 min at 4°C and a wash in cytoperm buffer (BD Pharmingen) before resuspension in cytoperm buffer containing 10 µg/mL DAPI. Data were acquired on a BD FACSAria II cell sorter or BD LSRFortessa cell analyzer and processed using FlowJo software (TreeStar). DNA content measurements by flow cytometry were susceptible to artifacts arising from cell aggregates. For all conventional flow cytometry experiments, we performed strict aggregate exclusion based on area versus height of the DAPI and forward scatter signals (data not shown). We also validated our finding of elevated polyploidy in Caph2nes/nes cells using imaging flow cytometry and FISH (data not shown).
BrdU staining was performed using the APC BrdU Flow kit (BD Pharmingen) according to the manufacturer's instructions. For quantification of γH2AX-positive cells at different cell cycle stages, total thymocytes were isolated from the thymuses of mice 2 h following BrdU injection and stained with anti-BrdU-APC, anti-γH2Ax-FITC, and DAPI using the BrdU Flow kit protocol (BD Pharmingen). Fluorescent and bright-field images were captured using an ISx MKII (Amnis) using a 60× objective. Following acquisition and compensation, the data were analyzed with IDEAS (Amnis) software using a modified version of published methods (Parris et al. 2015) as follows. In addition to the automatically generated system image masks, three further masks were built. The first mask eroded the DAPI mask by two pixels to ensure that any perinuclear signal was not included in subsequent analysis of nuclear staining patterns and intensities. A second mask was generated based on FITC intensity, removing pixels with an intensity of ≤600 to remove background and nonspecific staining and ensure that only clearly defined intense spots were retained for counting. A third mask used a Boolean instruction to combine the two masks described above to ensure that only FITC foci localized to the region of the nuclei were counted. A spot count feature was generated based on the combined mask.
A data analysis pathway identified round single cells (RSCs) on the basis of size and circularity of the bright-field images. Gated RSCs were input into a histogram to select cells in focus based on the intensity of adjacent pixels in an image (the gradient root mean squared function). In-focus RSCs were then used as the population in a histogram to identify BrdU-positive and BrdU-negative cells. Cells that were 2N and ≥4N were identified from the BrdU-negative population based on DAPI fluorescence. The three populations were plotted by number of γH2AX foci against overall γH2AX staining intensity (e), and cells with at least one focus above an intensity threshold were categorized as γH2AX-positive.
TCR sequencing
DNA was extracted from flash-frozen thymus tissue using DNeasy blood and tissue kit (Qiagen). The TCRβ locus was sequenced using the ImmunoSeq assay (Adaptive Biotechnologies) at survey-level resolution using 0.8–1 µg of starting material. PCR amplicons spanning the variable to constant sections of the TCRβ chain were sequenced using the Illumina MiSeq platform, and potential PCR biases were controlled using algorithms provided by Adaptive Biotechnologies (Carlson et al. 2013). Data were analyzed using the ImmunoSeq data analysis portal on the Adaptive Biotechnologies Web site. The two samples from P53−/− single mutants were from a published study (Dudgeon et al. 2014), the data for which were available through the ImmunoSeq portal for analysis alongside the data generated for this study.
Copy number data generation
Genomic DNA was isolated from FFPE tumor samples using the BioStic FFPE kit (Mo Bio Laboratories) and from flash-frozen tumor samples using the DNAeasy kit (Qiagen). Copy number analysis was performed as described previously (Scheinin et al. 2014). In brief, DNA was sheared with a Covaris S2 (Covaris) followed by the TruSeq NANO kit version 2 (Illumina). Final sequence library amplification was performed with 10 PCR cycles for the FFPE-derived DNA samples and eight PCR cycles for DNA derived from fresh samples. The yield of the sequence library was assessed with a DNA 7500 chip on a 2100 BioAnalyzer (Agilent Technologies). A double-sided bead size selection procedure with Agencourt AMPure XP beads (Beckman Coultier) was performed to clean the DNA preparations. The barcoded mouse samples were equimolarly pooled, and 12.5 pM molarity with 1% φX was loaded onto a HiSeq Single-End FlowCell (Illumina). This was followed by cluster generation on a cBot (Illumina) and sequencing on a HiSeq 2500 (Illumina) in single-read 50-cycle run mode (SR50-HTV4). Sequence data are available from the Sequence Read Archive under project accession SRP065379.
Copy number data analysis
The mouse reference version GRCm38/mm10 was used to determine GC content and mappability. GC content was calculated for 30-kb and 1-Mb bin sizes, and mappability was determined with GEM mappability (Derrien et al. 2012) allowing two mismatches. Loess residuals, used to make a mouse C57BL/6J-specific blacklist, were calculated with 24 samples obtained from a publicly available normal mouse C57BL/6J data set (Gnerre et al. 2011). Only the first 50 base pairs (bp) of the forward read were included for residual calculation. In addition, the 50-bp reads of the three normal mouse C57BL/6J samples, sequenced in parallel with the tumors, were included in the residual calculations. The data were analyzed with QDNAseq version 1.4.2 (Scheinin et al. 2014). Copy number profiles were segmented with DNAcopy (Venkatraman and Olshen 2007), and CNAs were called by selecting segments with a log2 ratio >0.20 or lower than −0.23, corresponding to a single gain or a single loss in 30% of the analyzed cells (van Thuijl et al. 2014). Breakpoints were defined at the junction between bins of different copy number according to the criteria above. For the deletion list in Supplemental Table S4, we started with all regions of copy number loss in Caph2nes/nes single-mutant tumor samples and removed regions corresponding to the X chromosome and TCR loci in addition to regions also deleted in Caph2nes/nes tail DNA. The remaining regions were ranked according to log2 ratio, and the top 10 ranking regions were manually curated to identify tumor suppressor genes.
Homology detection and structural interpretation of mutation
The mouse Caph2 sequence was used to search for homologous structures using the HHPred server (Söding et al. 2005). Three bacterial condensin structure hits (Protein Data Band IDs 4I98_A, 3ZGX_C, and 3W6J_A) were returned with their corresponding alignment that included the first two α helices. Additional Caph2 vertebrate orthologs were detected with a BLAST search against the SwissProt database at the NPS@ server (Combet 2000) and included into the multiple sequence alignment with minor manual editing. Figure 1B was prepared using ESPript version 3 (Gouet et al. 2003). Intraprotein interactions for the I15N equivalent residue in Bacillus subtilis (I22) were analyzed using the protein interactions calculator (PIC) (Tina et al. 2007) using a 5 Å sphere radius cutoff. Residue-specific solvent accessibility calculations were performed using ASAView (Ahmad et al. 2004). Structure visualization and analysis and the preparation of Figure 1B were conducted using PyMOL (http://www.pymol.org; Schrödinger LLC).
Transcriptome analysis
Total RNA was extracted using TRIzol reagent (Life technologies), and RNA quality was assessed using Bioanalyzer (Agilent). From each of three biological replicates per sample (cell purification scheme detailed in Supplemental Fig. S3A), 80 ng of RNA was amplified and biotinylated using the MessageAmp II kit (Ambion). cRNA (750 ng) was hybridized to mouse Ref-8 version 2 Expression Beadchips (Illumina) using a whole-genome expression direct hybridization kit (Illumina) and scanned with a Highscan (Illumina). Raw data were analyzed using Bioconductor with the FlexArray software package (http://genomequebec.mcgill.ca/FlexArray). RMA background adjustment, variance stabilization transformation (VST), and robust spline normalization were applied. Mean signal values were calculated at the gene level using ANOVA, and tests for difference between sample types were conducted using equal variance t-tests. Using conventional cutoffs for statistical significance (>twofold change, P < 0.05), very few transcripts were returned as differentially expressed between stage-matched DP thymocyte populations. To identify more subtle trends, all genes on the array with associated Ensembl and gene symbol annotations were first ranked according to fold change (Caph2nes/nes/Caph2+/+), and the ranked list was used as the input for gene ontology term enrichment within the “process” classification using the GOrilla tool (http://cbl-gorilla.cs.technion.ac.il). Full lists of terms returned by the GOrilla tool are in Supplemental Tables S1, S2, and S8. MIAME-compliant microarray data are available under Gene Expression Omnibus accession number GSE65199.
qRT–PCR
For the qPCR array experiments depicted in Supplemental Figure S8A and Supplemental Table S3, DP CD71− cells were purified from thymocytes that were first enriched for CD4+ cells by MACS (miltenyi) and then FACS purified for CD4+, CD8+, and CD71+ using the scheme outlined in Supplemental Figure S6C. Cell purity was typically 85%–95%. Total RNA was extracted from cells using TRIzol reagent (Life technologies) followed by purification through an RNAeasy colum (Qiagen). RNA quality was assessed using Bioanalyzer (Agilent). From each of two biological replicates per sample, 100 ng of RNA was reverse-transcribed using the RT2 first strand kit (Qiagen). qRT–PCR was performed on technical quadruplicates using the mouse P53 pathway qRT–PCR array (Qiagen, PAMM-027Z). Normalization and all downstream analysis steps were performed according to the manufacturer's instructions, and data analysis was conducted using the RT2 profiler PCR array software (Qiagen). For the experiment in Supplemental Figure S8B, total thymocytes were incubated with Hoechst for 30 min in Hank's balanced salts solution, sorted according to DNA content, and processed as above using primers designed in house. All qRT–PCR data in Supplemental Figure S8, A and B, and Supplemental Table S3 represent mean values from two biological replicate experiments, each comprising two technical replicate PCRs.
Supplementary Material
Acknowledgments
We are grateful to V. Chalei for contributions to the early stages of this work, A. Fahrer for providing Caph2 mutant mice, E. Freyer for assistance with FACS, the Biomedical Research Facility at the Western General Hospital and Biological Services Unit facilities at the Cancer Research UK Beatson Institute (C596/A17196) for animal husbandry, the Edinburgh Wellcome Trust Clinical Research Facility for processing transcriptome microarrays, A. Wheeler and the Edinburgh Superresolution Imaging Consortium facility for superresolution microscopy, D. van Essen and P. Eijk for performing the whole-genome sequencing experiments, I. Scheinin for assistance with mouse genome sequence analysis, M. Navarro for assistance with OP9/DL1 culture, and members of the Wood and Bickmore laboratories for stimulating discussions. We thank N. Gilbert and A. Fahrer for critical reading of the manuscript. A.J.W. is a Sir Henry Dale Fellow funded by the Wellcome Trust and The Royal Society. W.A.B. and A.P.J. are funded by Medical Research Counci University Unit programs. K.B. receives Cancer Research UK core funding, K.R.K. is a Cancer Research UK Senior Fellow. K.R.K.’s laboratory is supported by grants from Cancer Research UK, Bloodwise, and the Kay Kendall Leukaemia Fund.
Footnotes
Supplemental material is available for this article.
Article published online ahead of print. Article and publication date are online at http://www.genesdev.org/cgi/doi/10.1101/gad.284562.116.
References
- Ahmad S, Gromiha M, Fawareh H, Sarai A. 2004. ASAView: database and tool for solvent accessibility representation in proteins. BMC Bioinformatics 5: 51. [DOI] [PMC free article] [PubMed] [Google Scholar]
- Boyle S, Rodesch MJ, Halvensleben HA, Jeddeloh JA, Bickmore WA. 2011. Fluorescence in situ hybridization with high-complexity repeat-free oligonucleotide probes generated by massively parallel synthesis. Chromosome Res 19: 901–909. [DOI] [PMC free article] [PubMed] [Google Scholar]
- Brekelmans P, van Soest P, Voerman J, Platenburg PP, Leenen PJM, van Ewijk W. 1994. Transferrin receptor expression as a marker of immature cycling thymocytes in the mouse. Cell Immunol 159: 331–339. [DOI] [PubMed] [Google Scholar]
- Bürmann F, Shin H-C, Basquin J, Soh Y-M, Giménez-Oya V, Kim Y-G, Oh B-H, Gruber S. 2013. An asymmetric SMC–kleisin bridge in prokaryotic condensin. Nat Struct Mol Biol 20: 371–379. [DOI] [PubMed] [Google Scholar]
- Carlson CS, Emerson RO, Sherwood AM, Desmarais C, Chung M-W, Parsons JM, Steen MS, LaMadrid-Herrmannsfeldt MA, Williamson DW, Livingston RJ, et al. 2013. Using synthetic templates to design an unbiased multiplex PCR assay. Nat Commun 4: 2680. [DOI] [PubMed] [Google Scholar]
- Combet C. 2000. NPS@: network protein sequence analysis. Trends Biochem Sci 25: 147–150. [DOI] [PubMed] [Google Scholar]
- Coschi CH, Martens AL, Ritchie K, Francis SM, Chakrabarti S, Berube NG, Dick FA. 2010. Mitotic chromosome condensation mediated by the retinoblastoma protein is tumor-suppressive. Genes Dev 24: 1351–1363. [DOI] [PMC free article] [PubMed] [Google Scholar]
- Coschi CH, Ishak CA, Gallo D, Marshall A, Talluri S, Wang J, Cecchini MJ, Martens AL, Percy V, Welch I, et al. 2014. Haploinsufficiency of an RB–E2F1–condensin II complex leads to aberrant replication and aneuploidy. Cancer Discov 4: 840–853. [DOI] [PubMed] [Google Scholar]
- Cuylen S, Metz J, Haering CH. 2011. Condensin structures chromosomal DNA through topological links. Nat Struct Mol Biol 18: 894–901. [DOI] [PubMed] [Google Scholar]
- de Pooter R, Zúñiga-Pflücker JC. 2007. T-cell potential and development in vitro: the OP9-DL1 approach. Curr Opin Immunol 19: 163–168. [DOI] [PubMed] [Google Scholar]
- Derrien T, Estellé J, Marco Sola S, Knowles DG, Raineri E, Guigo R, Ribeca P. 2012. Fast computation and applications of genome mappability. PLoS One 7: e30377. [DOI] [PMC free article] [PubMed] [Google Scholar]
- Donehower LA, Harvey M, Slagle BL, McArthur MJ, Montgomery CA, Butel JS, Bradley A. 1992. Mice deficient for p53 are developmentally normal but susceptible to spontaneous tumours. Nature 356: 215–221. [DOI] [PubMed] [Google Scholar]
- Dudgeon C, Chan C, Kang W, Sun Y, Emerson R, Robins H, Levine AJ. 2014. The evolution of thymic lymphomas in p53 knockout mice. Genes Dev 28: 2613–2620. [DOI] [PMC free article] [PubMed] [Google Scholar]
- Eskeland R, Leeb M, Grimes GR, Kress C, Boyle S, Sproul D, Gilbert N, Fan Y, Skoultchi AI, Wutz A. 2010. Ring1B compacts chromatin structure and represses gene expression independent of histone ubiquitination. Mol Cell 38: 452–464. [DOI] [PMC free article] [PubMed] [Google Scholar]
- Fujiwara T, Bandi M, Nitta M, Ivanova EV, Bronson RT, Pellman D. 2005. Cytokinesis failure generating tetraploids promotes tumorigenesis in p53-null cells. Nature 437: 1043–1047. [DOI] [PubMed] [Google Scholar]
- Gnerre S, Maccallum I, Przybylski D, Ribeiro FJ, Burton JN, Walker BJ, Sharpe T, Hall G, Shea TP, Sykes S, et al. 2011. High-quality draft assemblies of mammalian genomes from massively parallel sequence data. Proc Natl Acad Sci 108: 1513–1518. [DOI] [PMC free article] [PubMed] [Google Scholar]
- Gosling KM, Makaroff LE, Theodoratos A, Kim Y-H, Whittle B, Rui L, Wu H, Hong NA, Kennedy GC, Fritz J-A, et al. 2007. A mutation in a chromosome condensin II subunit, kleisin β, specifically disrupts T cell development. Proc Natl Acad Sci 104: 12445–12450. [DOI] [PMC free article] [PubMed] [Google Scholar]
- Gouet P, Robert X, Courcelle E. 2003. ESPript/ENDscript: extracting and rendering sequence and 3D information from atomic structures of proteins. Nucleic Acids Res 31: 3320–3323. [DOI] [PMC free article] [PubMed] [Google Scholar]
- Green LC, Kalitsis P, Chang TM, Cipetic M, Kim JH, Marshall O, Turnbull L, Whitchurch CB, Vagnarelli P, Samejima K, et al. 2012. Contrasting roles of condensin I and condensin II in mitotic chromosome formation. J Cell Sci 125: 1591–1604. [DOI] [PMC free article] [PubMed] [Google Scholar]
- Gruber S, Haering CH, Nasmyth K. 2003. Chromosomal cohesin forms a ring. Cell 112: 765–777. [DOI] [PubMed] [Google Scholar]
- Gutierrez A, Kentsis A, Sanda T, Holmfeldt L, Chen S-C, Zhang J, Protopopov A, Chin L, Dahlberg SE, Neuberg DS, et al. 2011. The BCL11B tumor suppressor is mutated across the major molecular subtypes of T-cell acute lymphoblastic leukemia. Blood 118: 4169–4173. [DOI] [PMC free article] [PubMed] [Google Scholar]
- Ham MF, Takakuwa T, Rahadiani N, Tresnasari K, Nakajima H, Aozasa K. 2007. Condensin mutations and abnormal chromosomal structures in pyothorax-associated lymphoma. Cancer Sci 98: 1041–1047. [DOI] [PMC free article] [PubMed] [Google Scholar]
- Hardy RR, Carmack CE, Shinton SA, Kemp JD, Hayakawa K. 1991. Resolution and characterization of pro-B and pre-pro-B cell stages in normal mouse bone marrow. J Exp Med 173: 1213–1225. [DOI] [PMC free article] [PubMed] [Google Scholar]
- Hirano T. 2012. Condensins: universal organizers of chromosomes with diverse functions. Genes Dev 26: 1659–1678. [DOI] [PMC free article] [PubMed] [Google Scholar]
- Hirota T, Gerlich D, Koch B, Ellenberg J, Peters J-M. 2004. Distinct functions of condensin I and II in mitotic chromosome assembly. J Cell Sci 117: 6435–6445. [DOI] [PubMed] [Google Scholar]
- Houlard M, Godwin J, Metson J, Lee J, Hirano T, Nasmyth K. 2015. Condensin confers the longitudinal rigidity of chromosomes. Nat Cell Biol 17: 771–781. [DOI] [PMC free article] [PubMed] [Google Scholar]
- Jacks T, Remington L, Williams BO, Schmitt EM, Halachmi S, Bronson RT, Weinberg RA. 1994. Tumor spectrum analysis in p53-mutant mice. Curr Biol 4: 1–7. [DOI] [PubMed] [Google Scholar]
- Kamada K, Miyata M, Hirano T. 2013. Molecular basis of SMC ATPase activation: role of internal structural changes of the regulatory subcomplex ScpAB. Structure 21: 581–594. [DOI] [PubMed] [Google Scholar]
- Kastan MB, Onyekwere O, Sidransky D, Vogelstein B, Craig RW. 1991. Participation of p53 protein in the cellular response to DNA damage. Cancer Res 51: 6304–6311. [PubMed] [Google Scholar]
- Kataoka K, Nagata Y, Kitanaka A, Shiraishi Y, Shimamura T, Yasunaga J-I, Totoki Y, Chiba K, Sato-Otsubo A, Nagae G, et al. 2015. Integrated molecular analysis of adult T cell leukemia/lymphoma. Nat Genet 47: 1304–1315. [DOI] [PubMed] [Google Scholar]
- Leiserson MDM, Vandin F, Wu H-T, Dobson JR, Eldridge JV, Thomas JL, Papoutsaki A, Kim Y, Niu B, McLellan M, et al. 2015. Pan-cancer network analysis identifies combinations of rare somatic mutations across pathways and protein complexes. Nat Genet 47: 106–114. [DOI] [PMC free article] [PubMed] [Google Scholar]
- Longworth MS, Herr A, Ji JY, Dyson NJ. 2008. RBF1 promotes chromatin condensation through a conserved interaction with the Condensin II protein dCAP-D3. Genes Dev 22: 1011–1024. [DOI] [PMC free article] [PubMed] [Google Scholar]
- Losada A, Hirano T. 2005. Dynamic molecular linkers of the genome: the first decade of SMC proteins. Genes Dev 19: 1269–1287. [DOI] [PubMed] [Google Scholar]
- Lowe SW, Schmitt EM, Smith SW, Osborne BA, Jacks T. 1993. p53 is required for radiation-induced apoptosis in mouse thymocytes. Nature:: 362: 847–849. [DOI] [PubMed] [Google Scholar]
- Manning AL, Longworth MS, Dyson NJ. 2010. Loss of pRB causes centromere dysfunction and chromosomal instability. Genes Dev 24: 1364–1376. [DOI] [PMC free article] [PubMed] [Google Scholar]
- Martin C-A, Murray JE, Carroll P, Leitch A, Mackenzie KJ, Halachev M, Fetit AE, Keith C, Bicknell LS, Fluteau A, et al. 2016. Mutations in genes encoding condensin complex proteins cause microcephaly through decatenation failure at mitosis. Genes Dev (this issue). doi: 10.1101/gad.286351.116. [DOI] [PMC free article] [PubMed] [Google Scholar]
- Nasmyth K, Haering CH. 2005. The structure and function of SMC and kleisin complexes. Annu Rev Biochem 74: 595–648. [DOI] [PubMed] [Google Scholar]
- Nasmyth K, Oliveira RA. 2010. Splitting the nucleus what's wrong with the tripartite ring model? Cold Spring Harb Symp Quant Biol 75: 375–388. [DOI] [PubMed] [Google Scholar]
- Nelms KA, Goodnow CC. 2001. Genome-wide ENU mutagenesis to reveal immune regulators. Immunity 15: 409–418. [DOI] [PubMed] [Google Scholar]
- Neumann B, Walter T, Hériché J-K, Bulkescher J, Erfle H, Conrad C, Rogers P, Poser I, Held M, Liebel U, et al. 2010. Phenotypic profiling of the human genome by time-lapse microscopy reveals cell division genes. Nature 464: 721–727. [DOI] [PMC free article] [PubMed] [Google Scholar]
- Nishide K, Hirano T. 2014. Overlapping and non-overlapping functions of condensins I and II in neural stem cell divisions. PLoS Genet 10: e1004847. [DOI] [PMC free article] [PubMed] [Google Scholar]
- Onn I, Aono N, Hirano M, Hirano T. 2007. Reconstitution and subunit geometry of human condensin complexes. EMBO J 26: 1024–1034. [DOI] [PMC free article] [PubMed] [Google Scholar]
- Ono T, Losada A, Hirano M, Myers MP, Neuwald AF, Hirano T. 2003. Differential contributions of condensin I and condensin II to mitotic chromosome architecture in vertebrate cells. Cell 115: 109–121. [DOI] [PubMed] [Google Scholar]
- Ono T, Fang Y, Spector DL, Hirano T. 2004. Spatial and temporal regulation of condensins I and II in mitotic chromosome assembly in human cells. Mol Biol Cell 15: 3296–3308. [DOI] [PMC free article] [PubMed] [Google Scholar]
- Parris CN, Adam Zahir S, Al-Ali H, Bourton EC, Plowman C, Plowman PN. 2015. Enhanced γ-H2AX DNA damage foci detection using multimagnification and extended depth of field in imaging flow cytometry. Cytometry A 87: 717–723. [DOI] [PMC free article] [PubMed] [Google Scholar]
- Piazza I, Rutkowska A, Ori A, Walczak M, Metz J, Pelechano V, Beck M, Haering CH. 2014. Association of condensin with chromosomes depends on DNA binding by its HEAT-repeat subunits. Nat Struct Mol Biol 21: 560–568. [DOI] [PubMed] [Google Scholar]
- Rawlings JS, Gatzka M, Thomas PG, Ihle JN. 2010. Chromatin condensation via the condensin II complex is required for peripheral T-cell quiescence. EMBO J 30: 263–276. [DOI] [PMC free article] [PubMed] [Google Scholar]
- Scheinin I, Sie D, Bengtsson H, van de Wiel MA, Olshen AB, van Thuijl HF, van Essen HF, Eijk PP, Rustenburg F, Meijer GA, et al. 2014. DNA copy number analysis of fresh and formalin-fixed specimens by shallow whole-genome sequencing with identification and exclusion of problematic regions in the genome assembly. Genome Res 24: 2022–2032. [DOI] [PMC free article] [PubMed] [Google Scholar]
- Sheltzer JM, Torres EM, Dunham MJ, Amon A. 2012. Transcriptional consequences of aneuploidy. Proc Natl Acad Sci 109: 12644–12649. [DOI] [PMC free article] [PubMed] [Google Scholar]
- Shintomi K, Hirano T. 2011. The relative ratio of condensin I to II determines chromosome shapes. Genes Dev 25: 1464–1469. [DOI] [PMC free article] [PubMed] [Google Scholar]
- Smith ED, Xu Y, Tomson BN, Leung CG, Fujiwara Y, Orkin SH, Crispino JD. 2004. More than blood, a novel gene required for mammalian postimplantation development. Mol Cell Biol 24: 1168–1173. [DOI] [PMC free article] [PubMed] [Google Scholar]
- Söding J, Biegert A, Lupas AN. 2005. The HHpred interactive server for protein homology detection and structure prediction. Nucleic Acids Res 33: W244–W248. [DOI] [PMC free article] [PubMed] [Google Scholar]
- Swedlow JR, Hirano T. 2003. The making of the mitotic chromosome: modern insights into classical questions. Mol Cell 11: 557–569. [DOI] [PubMed] [Google Scholar]
- Thompson SL, Compton DA. 2010. Proliferation of aneuploid human cells is limited by a p53-dependent mechanism. J Cell Biol 188: 369–381. [DOI] [PMC free article] [PubMed] [Google Scholar]
- Tina KG, Bhadra R, Srinivasan N. 2007. PIC: protein interactions calculator. Nucleic Acids Res 35: W473–W476. [DOI] [PMC free article] [PubMed] [Google Scholar]
- Torres EM, Sokolsky T, Tucker CM, Chan LY, Boselli M, Dunham MJ, Amon A. 2007. Effects of aneuploidy on cellular physiology and cell division in haploid yeast. Science 317: 916–924. [DOI] [PubMed] [Google Scholar]
- van Thuijl HF, Scheinin I, Sie D, Alentorn A, van Essen HF, Cordes M, Fleischeuer R, Gijtenbeek AM, Beute G, van den Brink WA, et al. 2014. Spatial and temporal evolution of distal 10q deletion, a prognostically unfavorable event in diffuse low-grade gliomas. Genome Biol 15: 471. [DOI] [PMC free article] [PubMed] [Google Scholar]
- Venkatraman ES, Olshen AB. 2007. A faster circular binary segmentation algorithm for the analysis of array CGH data. Bioinformatics 23: 657–663. [DOI] [PubMed] [Google Scholar]
- Williams BR, Prabhu VR, Hunter KE, Glazier CM, Whittaker CA, Housman DE, Amon A. 2008. Aneuploidy affects proliferation and spontaneous immortalization in mammalian cells. Science 322: 703–709. [DOI] [PMC free article] [PubMed] [Google Scholar]
- Wood AJ, Severson AF, Meyer BJ. 2010. Condensin and cohesin complexity: the expanding repertoire of functions. Nat Rev Genet 11: 391–404. [DOI] [PMC free article] [PubMed] [Google Scholar]
- Zhang J, Ding L, Holmfeldt L, Wu G, Heatley SL, Payne-Turner D, Easton J, Chen X, Wang J, Rusch M, et al. 2012. The genetic basis of early T-cell precursor acute lymphoblastic leukaemia. Nature 481: 157–163. [DOI] [PMC free article] [PubMed] [Google Scholar]
Associated Data
This section collects any data citations, data availability statements, or supplementary materials included in this article.