

Abstract
Mammalian cells have developed intricate mechanisms to interpret, integrate, and respond to extracellular stimuli. For example, tumor necrosis factor (TNF) rapidly activates proinflammatory genes, but our understanding of how this occurs against the ongoing transcriptional program of the cell is far from complete. Here, we monitor the early phase of this cascade at high spatiotemporal resolution in TNF-stimulated human endothelial cells. NF-κB, the transcription factor complex driving the response, interferes with the regulatory machinery by binding active enhancers already in interaction with gene promoters. Notably, >50% of these enhancers do not encode canonical NF-κB binding motifs. Using a combination of genomics tools, we find that binding site selection plays a key role in NF-κΒ–mediated transcriptional activation and repression. We demonstrate the latter by describing the synergy between NF-κΒ and the corepressor JDP2. Finally, detailed analysis of a 2.8-Mbp locus using sub-kbp-resolution targeted chromatin conformation capture and genome editing uncovers how NF-κΒ that has just entered the nucleus exploits pre-existing chromatin looping to exert its multimodal role. This work highlights the involvement of topology in cis-regulatory element function during acute transcriptional responses, where primary DNA sequence and its higher-order structure constitute a regulatory context leading to either gene activation or repression.
Mammalian cells, embedded in a multicellular environment, require intricate mechanisms in order to interpret, integrate, and ultimately respond to extracellular stimuli. Inflammatory signaling constitutes a well-studied example (Bhatt and Ghosh 2014; Smale and Natoli 2014); tumor necrosis factor (TNF) rapidly remodels gene expression programs through its main effector, nuclear factor κB (NF-κB) (Hayden and Ghosh 2008; Bhatt et al. 2012). TNF activates the same genes across cell types (Moynagh 2005), but the cascade needs to unfold against the ongoing transcriptional program of the stimulated cell. Along these lines, recent work in adipocytes showed that NF-κB is involved in gene repression via redistribution of prebound factors (Schmidt et al. 2015). This is tightly linked to the choice of NF-κB binding in vivo, but the specific principles that guide this choice in three-dimensional (3D) nuclear space and over time are still not well understood, despite the wealth of data on the different phases of the inflammatory response. For example, we now know that signaling directs binding of its downstream effectors to already-active cis-regulatory elements in the context of both inflammation (Ghisletti et al. 2010; Jin et al. 2011) and development (Trompouki et al. 2011). Yet, the repertoire of active cis-elements per cell type is not constant, and introduction of a new transcription factor (TF) upon signaling also activates hitherto inactive enhancers (Kaikkonen et al. 2013; Ostuni et al. 2013; Brown et al. 2014). Notably, high-throughput studies of the binding preferences of various NF-κB dimers in vitro (Wong et al. 2011; Siggers et al. 2012) and in vivo (Antonaki et al. 2011; Zhao et al. 2014) showed that binding to nonconsensus motifs is permissible. Still, how binding to noncanonical sites underlies the different NF-κB functions remains unknown.
Cis-regulatory elements, such as active enhancers, are pivotal in driving gene expression by looping onto target promoters and recruiting relevant transcription factors (Heinz et al. 2015). Moreover, many enhancers regulating TNF-inducible genes are prelooped prior to stimulation, giving rise to a poised chromatin configuration (Jin et al. 2013). This is in agreement with an overarching 3D genome structure comprised by “topologically associating domains” (TADs) (Dixon et al. 2015). TAD boundaries do not change dramatically upon cytokine signaling (Le Dily et al. 2014) or during differentiation (Dixon et al. 2015; Fraser et al. 2015). Enhancer-promoter interactions are typically confined within TADs, the disruption of which leads to dysregulated gene expression (Lupianez et al. 2015; Tsujimura et al. 2015). Hence, higher-order chromatin organization influences (and is influenced by) the spatial interplay of cis-regulatory elements, and the regulation of proinflammatory signaling cannot constitute an exception (Kuznetsova et al. 2015; Pombo and Dillon 2015).
In human endothelial cells, proinflammatory stimulation is linked to both acute and chronic disorders (Libby et al. 2011; Brown et al. 2014), and we previously used these cells to characterize the dynamic clustering of NF-κB–regulated genes in 3D space (Papantonis et al. 2012), and global chromatin “priming” prior to NF-κB–dependent transcription (Diermeier et al. 2014). Here, we study the still-elusive properties of how the new proinflammatory transcriptional program is integrated in the pre-existing one in 3D space and over time.
Results
TNF stimulation rapidly remodels the nascent transcriptome of HUVECs
The inflammatory response is characterized by rapid changes in RNA synthesis occurring within minutes of TNF stimulation (Hao and Baltimore 2009; Bhatt et al. 2012; Schmidt et al. 2015). In order to track these changes, we isolated and sequenced total-cell RNA collected at 0, 30, 60, and 90 min post-stimulation. Samples were ribodepleted and sequenced to >100 million read pairs each to obtain robust intron coverage and data analyzed using the iRNA-seq pipeline (Madsen et al. 2015) to assess changes at the nascent (intronic) RNA level. Analysis showed that >1000 genes are up- or down-regulated on average at each time point (at least 30% more than those seen by poly(A)+ RNA sequenced to the same depth) (Fig. 1A,B; Supplemental Fig. S1A,B), with a most pronounced transcriptional induction at 30 min (Fig. 1C). Gene ontology (GO) analysis of differentially expressed genes at the different times revealed that up-regulated ones are mostly proinflammatory, while down-regulated ones are mostly involved in negative regulation by RNA polymerase II (RNAPII), metabolic processes, and the cell cycle (Fig. 1D). GO term profiles change gradually as the cells move from the early (30 min) into the later phases (60 and 90 min), and iRNA-seq revealed a changing network of regulated genes along the time course, with the different time-points sharing <50% of up-/down-regulated genes (Fig. 1D,E).
Figure 1.

Analysis of gene expression at the level of intronic RNA. HUVECs were treated with TNF for 0–90 min, total RNA sequenced, and changes in intronic RNA levels assessed using the iRNA-seq pipeline. (A) Log2-normalized mean counts of reads mapping to introns at the different times. Only genes up- (orange) and down-regulated (blue) by TNF are shown. (B) Browser views of typical RNA-seq coverage (reads per million) along a TNF-induced (HIVEP2) and a TNF-repressed gene (ARHGAP18). (C) Log2-fold changes of intronic RNA levels for up- (≥0.6) and down-regulated genes (≤−0.6) at the different times compared to 0 min. (*) Significantly different mean; P < 0.01, two-tailed Student's unpaired t-test. (D) The five most significantly enriched GO terms relevant to up- and down-regulated genes. (E) Venn diagrams showing shared and unique up- (left) and down-regulated genes (right) at the different times post-stimulation. (F) Log2-fold changes of intronic RNA levels (30- versus 0-min levels) for TNF-induced/-repressed genes lying alone (“1”), in pairs (“2”), or in groups of three or more (“≥3”) in a given TAD (the total number of genes in each group are shown on top of or below each box plot). (*) Significantly different mean; P < 0.01, two-tailed Student's unpaired t-test.
Genomic architecture contributes significantly to gene regulation in response to extracellular stimuli (Jin et al. 2013; Le Dily et al. 2014). Hence, we performed genome-wide chromosome conformation capture (Hi-C) (Belton et al. 2012) in HUVECs stimulated with TNF for 30 min, sequenced libraries to 200 million read pairs, obtained interaction maps (at 100-kbp resolution) (Supplemental Fig. S1C), computationally identified TAD boundaries (Lévy-Leduc et al. 2014), and examined how TNF-responsive genes cluster within them. One thousand seventy-four genes up-regulated at 30 min reside singly in a TAD, whereas 208 and 47 genes reside in a given TAD in pairs or groups of ≥3 genes, respectively; this also applies to down-regulated genes but with a notably higher number of 202 genes in groups of ≥3 per TAD. In both cases, it is densely clustered genes that show the highest mean fold-change, presumably indicative of coordinated regulation within TADs (Fig. 1F).
NF-κB binds already-active enhancers to both stimulate and suppress expression
The RELA::NFKB1 (p65∷p50) heterodimer, the predominant NF-κB isoform studied here, strongly binds the canonical 5′-GGRRNNYYCC-3′ motif (Wong et al. 2011; Zhao et al. 2014). There are >575,000 such motifs in the human genome (hg18), yet RELA ChIP-seq reveals ∼8500 high-confidence binding peaks at 30 min post-stimulation (for a typical example, see Fig. 2A; Papantonis et al. 2012). Our analysis shows that RELA predominantly binds predicted strong enhancers in unstimulated HUVECs (Supplemental Fig. S2A), and >60% of 30-min RELA peaks are found outside transcription start sites and overlap H3K4me1 and H3K27ac 0-min peaks (Fig. 2B). Reassuringly, we also detect RELA binding at “latent” enhancers (Ostuni et al. 2013; Supplemental Fig. S2B).
Figure 2.

RELA binds already-active enhancers “with” or “without” a canonical binding motif. HUVECs were treated with TNF for 0 or 30 min and NF-κB binding assessed (via RELA ChIP-seq). (A) ChIP- and RNA-seq coverage (reads per million) of the responsive NFKBIA locus; “motifs” refers to canonical NF-κB binding motifs. Closed and open arrows (bottom): a RELA peak overlapping a canonical and a noncanonical recognition motif, respectively. (B) (Top) The overlap between 0-min H3K4me1 (gray), H3K27ac (teal), and 30-min RELA (orange) ChIP-seq peaks; 5366 peaks are bound by RELA at 30 min. (Bottom) Percent RELA-bound peaks that carry (or not) the canonical motif, are intragenic, or overlap a TSS or a CTCF peak. (C) Relative enrichment of transcription factor (TF) binding motifs in DNase-hypersensitive footprints around “with” (blue) or “without” (red) canonical RELA binding motifs. TFs induced or repressed by TNF are colored orange and blue, respectively. (D) Occupancy (read tags per bp) for MAX, FOS, JUN, and GATA2 ChIP-seq in the 2 kbp around RELA peaks “with” (orange) or “without” (black) canonical motifs. (E) Conservation (among 17 vertebrates) in the 5 kbp around “with”/”without” RELA or CTCF peaks. (F) The most significantly enriched GO terms (biological process) associated with genes assigned to 30-min RELA peaks “with”/”without” motifs in the same TAD; GO terms for up-regulated genes are shown for comparison. Note that any gene linked to both “with” and “without” peaks is classified as “with.” (G) Heat maps illustrating RNAPII signal (grouped hierarchically into five clusters) in the 4 kbp around RELA peaks “with”/”without” motifs. (H) Changes in eRNAs levels (data from Caudron-Herger et al. 2015) around RELA peaks from “with” (top) and “without” (bottom) cluster 4. (AS) Antisense-strand signal, (S) sense-strand signal. (I) The fraction of RELA peaks per cluster (as in G) overlapping H3K27ac peaks at the different times.
Intriguingly, >55% of 30-min RELA peaks do not overlap a canonical RELA::NFKB1 motif (Fig. 2B, bottom). Instead, essentially all these peaks carry a degenerate 5′-RKRNHTYYCH-3′ REL-family motif (discovered using de novo motif analysis; FDR < 0.001) but still exhibit enrichments for RELA that are comparable to those seen at canonical sites (assessed by ChIP-qPCR) (Supplemental Fig. S2C). Visual inspection of the data in the early responsive NFKBIA locus revealed that peaks not overlapping the canonical motif (Fig. 2A, white arrow) showed decreasing H3K27ac levels upon stimulation, compared to an increase at peaks that carry motifs (Fig. 2A, black arrow). A sensitive analysis of motifs located specifically within DNase I-hypersensitive (DHS) footprints (Gusmao et al. 2016) showed that peaks encoding the canonical motif (“with”) are strongly marked by RELA and NFKB1 binding elements, whereas peaks lacking canonical motifs (“without”) are enriched for JUN- and FOS-family binding elements (forming AP-1 sites) (Fig. 2C; Karin et al. 1997). This was verified using HUVEC ENCODE ChIP-seq data (The ENCODE Project Consortium 2012): Co-binding of RELA and JUN/FOS is supported by at least double the read density at “without” than at “with” sites (Fig. 2D). Again, reassuringly, segregation of RELA peaks into “with” and “without” motifs can also be observed in ChIP-seq data generated using milder crosslinking and different antisera (Brown et al. 2014; data not shown).
RELA-bound sites overlap ∼1/4 of JUN or FOS 0-min peaks; “without” peaks overlap almost twice as many JUN/FOS peaks as “with” ones (Supplemental Fig. S2D). However, RELA and FOS, but not RELA and JUN, coimmunoprecipitate at the sites of active transcription after TNF stimulation (as shown in experiments where these are separately purified) (Melnik et al. 2016; see Methods and Supplemental Fig. S2E), and we hypothesize that this interaction can help stabilize NF-κB binding at “without” sites. Notably, “without” enhancers are better conserved than “with” ones among 17 vertebrates (Fig. 2E). GO term analysis of the genes closest to each RELA peak (ensuring both lie in the same TAD) showed that those linked to “with” peaks associate with proinflammatory signaling, while those linked to “without” peaks also associate with hypoxia and angiogenesis (Fig. 2F), two processes shown to also involve transcriptional repression in endothelial cells (Kishore et al. 2005; Cartee et al. 2012).
Because these GO terms differed from those assigned to 30-min up-regulated genes (Fig. 2F), we speculated that RELA might also invoke transcriptional repression. We compared 0- and 30-min RNAPII ChIP-seq levels (from Papantonis et al. 2012) at RELA-bound sites and clustered sites according to their profiles. This revealed increasing RNAPII signal post-stimulation around RELA peaks, with the exception of a subset of ∼770 “without” peaks where RNAPII and eRNA levels do not increase in response to TNF (Fig. 2G,H). Motif analysis in DHS footprints verified that individual “without” clusters are specifically enriched for FOS-/JUN-binding elements. Moreover, compared to all other clusters, cluster “4-without” was most enriched for cognate motifs of JDP2, an AP-1 repressor (Supplemental Fig. S2F,G; Aronheim et al. 1997). This cluster also becomes largely depleted of H3K27ac signal post-stimulation (unlike other clusters) (Fig. 2Ι) and contains RELA peaks linked to the most repressed genes (while RELA “with” peaks are predominantly associated with genes up-regulated upon stimulation) (Supplemental Fig. S2H). Collectively, these data point to a TNF-induced, RELA-mediated, repressive mechanism.
ChIA-PET analysis reveals differential functions of RELA-bound enhancers
Binding of NF-κB at already-active enhancers along the linear fiber has been described (Ghisletti et al. 2010; Jin et al. 2011; Brown et al. 2014), but in order to identify the genes that these enhancers regulate, chromatin looping data need to be integrated. To this end, we used ChIA-PET data generated in HUVECs at 0 and 30 min after TNF stimulation (from Papantonis et al. 2012); this data set provides essentially base-pair resolution (Li et al. 2014) of spatial interactions that involve active RNAPII. We filtered the two libraries for high-confidence contacts (supported by ≥3 PETs each), and analyzed ∼37,000 unique interactions per time-point (Supplemental Fig. S3A). Of these, ∼50% are seen at both 0 and 30 min post-stimulation, and the other half dynamically change within the TAD boundaries defined using Hi-C (Supplemental Fig. S3B,C).
Using 0-min ChIA-PET data, we see that both up- (e.g., NFKBIA) and down-regulated genes (e.g., CTGF) engage in preformed spatial interactions that bind RELA at 30 min (Fig. 3A); more than half of the 5366 RELA-bound enhancers partake in such prelooped interactions. The vast majority of these interactions concerns enhancer-enhancer (59%) and enhancer-promoter (28%) contacts (Fig. 3B), and more than half lack canonical NF-κB recognition motifs (Fig. 3B, highlight). Further analysis showed that genes prelooped to “without” RELA peaks associate with lower 30-min H3K27ac median levels and contact more genes down-regulated post-stimulation (compared to those prelooped to “with” RELA peaks) (Fig. 3C,D). Of all 30-min up-/down-regulated genes (Fig. 1A), ∼1/5 engage in 0-min ChIA-PET interactions; of these, ∼70% and ∼40% of the up- and down-regulated genes, respectively, are prelooped to an already-active enhancer. Most up-regulated genes are prelooped to “with” enhancers, whereas most down-regulated genes are prelooped to “without” ones and exhibit stronger suppression on average (Fig. 3E,F). Overall, these data suggest that suppression is predominantly linked to interactions of gene promoters and RELA “without” peaks.
Figure 3.

Global analysis of contacts made by RELA-bound enhancers “with” or “without” motif. HUVECs were stimulated with TNF for 0 or 30 min, and ChIA-PET was performed after pulling-down chromatin complexes associated with active RNA polymerase II isoforms. (A) Browser views of typical ChIA-PET interactions at gene loci induced (NFKBIA) or repressed (CTGF) by TNF. 0-min ChIA-PET contacts are shown alongside ChIP-seq data for RELA (30 min) and CTCF (0 min), and positions of canonical NF-κB motifs. RELA-bound contacts are highlighted (magenta). (B) More than half of the 5366 RELA-bound enhancers (defined as in Fig. 2B) are involved in 0-min ChIA-PET interactions, and are connected to other already-active enhancers (orange), gene TSSs (circles), or CTCF cites (hexagons) to different extents. Fifty-seven percent of RELA-bound enhancers carry noncanonical motifs (gray highlight). (C) Boxplots showing H3K27ac levels (using ChIP-seq ±TNF) at each of the 2791 RELA-bound enhancers present in the 0-min ChIA-PET data. Enhancers are grouped according to their underlying motif as “with” (orange) or “without” (gray). (*) Significantly different mean; two-tailed, unpaired, Student's t-test. (D) Log2-fold changes of intronic RNA levels (30- or 60- versus 0-min; only changes of ±0.6 or more are shown) for genes connected with RELA-bound enhancers in 0-min ChIA-PET data. Genes associated to “with” and “without” RELA peaks are denoted by orange and gray points, respectively, and their numbers per quartile are shown (right). (E) Pie chart showing that 73% of the 305 TSSs of up-regulated genes in 0-min ChIA-PET are prelooped to already-active enhancers. Boxplots depict the log2 fold-change in intronic RNA levels for genes contacting “with” (orange), “without” (gray) or non-RELA-bound peaks (light green). (F) Pie charts and boxplots as in E, but for the 39% of the 235 TSSs of down-regulated genes in 0-min ChIA-PET that are prelooped to already-active enhancers. (*) Significantly different mean; two-tailed, unpaired, Student's t-test.
Comparative analysis of multiple loci confirms different NF-κB regulatory modes
ChIA-PET data suggest diverse regulatory modes for NF-κB via multiple enhancer-centered interactions. However, to dissect how single promoters spatially communicate with their surrounding cis-regulatory elements, we performed 3C-seq (Stadhouders et al. 2013) from six viewpoints within two multi-Mbp regions on Chromosomes 6 and 14. These encode both responsive and nonresponsive genes, and we monitored interactions at 0–60 min post-stimulation, focusing on those with RELA-bound enhancers.
On Chromosome 6, the transcription start site (TSS) of constitutively expressed EDN1 forms interactions that span three TADs. It contacts a downstream cluster of enhancers that are predominantly “without motif,” and it partakes in reciprocal contacts with HIVEP1. Up-regulated NEDD9 forms contacts essentially only within its TAD involving a large stretch of “with” enhancers (Supplemental Fig. S4A). On Chromosome 14, at 0 min, the TSS of inducible SAMD4A is prelooped to an intragenic CTCF site (documented before [Larkin et al. 2012]) and to a large enhancer cluster in its first intron, presumably to ensure its efficient activation (Fig. 4). After stimulation, SAMD4A develops RELA-driven contacts with other active genes in the same TAD (GMFB, CGRRF1, GCH1) (Fig. 4). CDKN3 interactions are confined by its flanking CTCF peaks, while BMP4 contacts stretch over large genomic space not occupied by other genes (Fig. 4). In summary, all TSSs contact RELA-bound enhancers (arrows in Fig. 4; Supplemental Fig. S4A). However, the majority of enhancers contacted by inducible SAMD4A and NEDD9 are “with motif” (Fig. 4, bottom), while those contacted by noninducible EDN1 are mostly “without” (Supplemental Fig. S4A, bottom). Hence, we would assume the latter have contacts enriched for FOS/JUN binding (see Fig. 2C,D), and that is indeed the case (Supplemental Fig. S4B). Notably, the overall change in spatial contacts seen by 3C-seq in both loci before and after stimulation is small and points to a key role of prelooping in facilitating regulation upon TNF stimulation.
Figure 4.
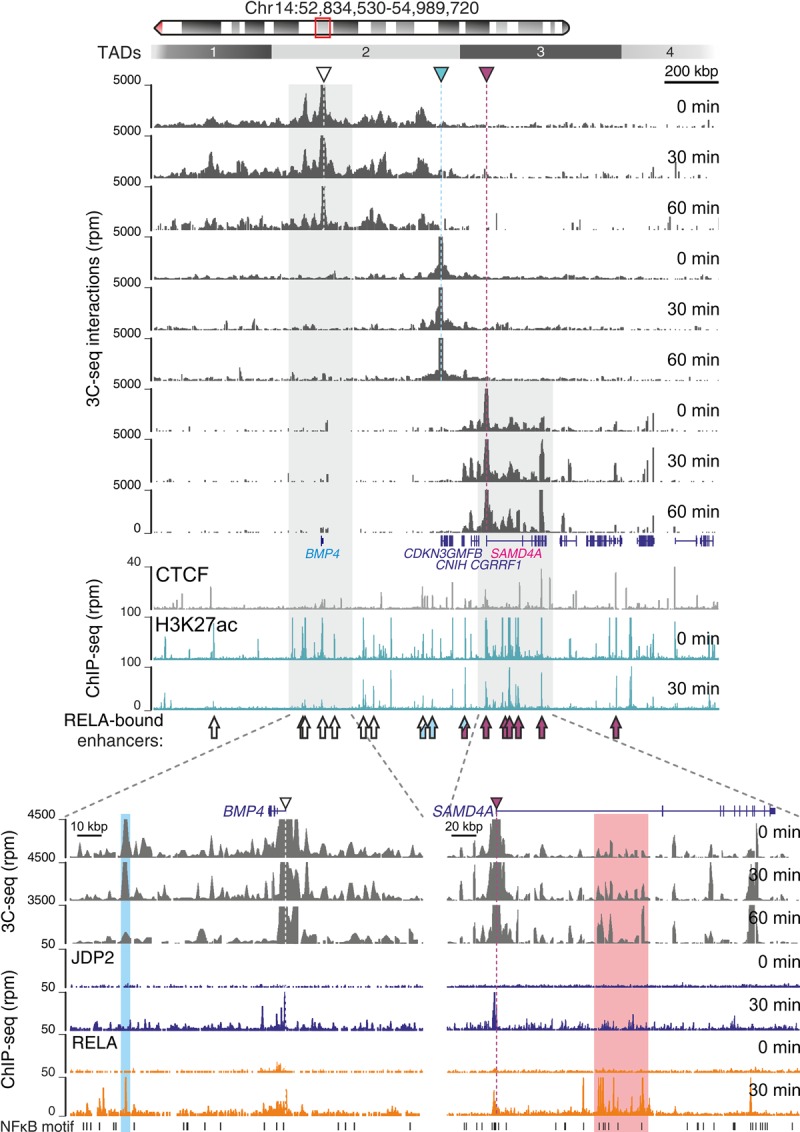
Spatial interactions in a TNF-responsive locus. HUVECs were stimulated with TNF for 0, 30, or 60 min, and 3C-seq performed using the TSSs of the BMP4, CDKN3, and SAMD4A genes as viewpoints. (Top) Browser view, including ChIP-seq data, of 2 Mbp on Chromosome 14 (ideogram on top). Rectangles 1–4: TADs. Colored triangles: 3C-seq viewpoints. Arrows (bottom): RELA-bound enhancers contacted by BMP4 (white), CDKN3 (blue), and SAMD4A (maroon). (Bottom) Zoom-in on the interactions formed by TNF-suppressed BMP4 and TNF-induced SAMD4A TSSs. 3C-seq profiles are shown alongside JDP2 and RELA ChIP-seq data at 0 and 30 min post-stimulation.
The most prominent contact of down-regulated BMP4 (∼70 kbp upstream of its TSS) (Fig. 4, bottom) is with a single enhancer belonging to the “4-without” cluster (see Fig. 2G). This, again, is a prelooped interaction bound by RELA at 30 min and then markedly reduced at 60 min. Overall, changes in BMP4 contact profiles relative to ChIP-seq occupancy upon TNF stimulation are indicative of RELA-mediated repression (Fig. 4; Supplemental Fig. S5A). Thus, we hypothesized that the down-regulation of some genes associated with the ∼770 RELA peaks of the “4-without” cluster (Fig. 2G) will involve binding of the JDP2 repressor, as predicted by DHS motif analysis (Supplemental Fig. S2F).
We performed ChIP-seq at both 0 and 30 min and mapped ∼8800 JDP2 binding sites in stimulated HUVECs. JDP2 displays a strong preference for TSS-proximal binding on TNF induction and overlaps sites where H3K27ac levels are both induced and suppressed (Supplemental Fig. S5B,C). In accordance, ChIA-PET connects JDP2 peaks to both up- and down-regulated genes. Of these, five times more down-regulated genes bound by JDP2 are connected to “without” than “with” RELA peaks in ChIA-PET; similarly, twice as many up-regulated genes are connected to “with” than “without” peaks in the same data set (Supplemental Fig. S5D,E). Up-regulated JDP2-bound genes associate with GO terms typical of TNF-stimulated genes, whereas down-regulated ones associate with terms similar to TNF-suppressed genes (Supplemental Fig. S5F). Finally, to establish causality, we performed a knock-down of JDP2 using siRNAs. We achieved a 50% reduction in JDP2 expression levels, which resulted in the up-regulation of exemplary TNF-repressed genes connected to “without” peaks (including BMP4). In contrast, genes connected to “with” peaks were not affected (Supplemental Fig. S5G). Taken together, these results are in support of the idea that NF-κB–mediated gene repression involves binding at “without” peaks and often the recruitment of JDP2 as a cofactor.
Enhancer inhibition affects prelooping at different loci
The most prominent SAMD4A and EDN1 contacts are with large, dense enhancer clusters resembling “super-enhancers” (SEs) (Fig. 4; Supplemental Fig. S4A; Hnisz et al. 2013). SEs have been implicated in the proinflammatory response (Brown et al. 2014; Schmidt et al. 2015), and RELA peaks form such clusters along HUVEC chromosomes (Supplemental Fig. S6A). Using the original HUVEC SE list (Hnisz et al. 2013) and H3K27ac 0-min signal, we find that 77% of 608 HUVEC SEs become bound by RELA at 30 min (Supplemental Fig. S6B). Conversely, ∼50% of all RELA SEs at 30 min were active before stimulation (Supplemental Fig. S6C,D) and associate with genes that respond strongly to TNF and are linked to GO terms relevant to that of both up- and down-regulated processes (Supplemental Fig. S6E,F). Importantly, a significant fraction of these SEs are “without motif,” despite being composed of a number of individual enhancers (Supplemental Fig. S6G). Thus, categorization of RELA enhancers into “with” and “without” motif also applies to SEs and may drive both gene activation and repression.
In an effort to understand how “with” and “without” NF-κB peaks differentially regulate gene expression on top of a prelooped spatial configuration, we speculated that reducing the activity levels of RELA-bound enhancers might also impair prelooping. To achieve this, we treated HUVECs with C646, a drug inhibiting the EP300 acetyltransferase and, thus, reducing H3K27ac levels (Bowers et al. 2010). Although NF-κB is also acetylated by EP300, its binding capacity is not impaired by deacetylation (Buerki et al. 2008). C646 nearly abolishes prelooping of the SAMD4A and the EDN1 TSS to their downstream SEs (Fig. 5A,B; Supplemental Fig. S7A,B). This coincides with a drop in H3K27ac levels at enhancers and gene promoters and with a variable decrease in nascent transcription at the same loci (Supplemental Fig. S7C–E). Interestingly, TNF-inducible SAMD4A can restore contacts to its intronic SE upon 30 min of stimulation, but constitutively expressed EDN1 cannot. Note here that the SAMD4A SE is predominantly comprised of “with” RELA peaks, while the EDN1 SE almost exclusively of “without” ones.
Figure 5.

C646 treatment represses the proinflammatory expression program. HUVECs were treated with C646 for 1 h, followed by TNF stimulation for 0 or 30 min and analyzed. (A) Top: cumulative separation of RELA-bound (30 min) and CTCF peaks (0 min) in the 2.8-Mbp SAMD4A locus. (Bottom) Browser view of RNA- and ChIP-seq data (in reads per million) along SAMD4A and CGRRF1. The RELA-bound super-enhancer (magenta rectangle) and peaks “with” (black arrows) or “without” NF-κΒ motif (white arrows) are demarcated. (B) Browser view of 3C-seq data (in reads per million) generated using the SAMD4A TSS as a viewpoint (yellow triangle) at 0 and 30 min in the presence or absence of inhibitors C646 and DRB. (C) Log2-normalized mean counts of reads mapping to introns at 30 min post-stimulation in the presence or absence of C646. Only genes up- (orange) and down-regulated (blue) are shown. Pie chart: 15% and 9% of the 967 down-regulated genes associate with “with” and “without” RELA peaks, respectively. (D) The most significantly enriched GO terms (biological process) associated with C646-down-regulated genes assigned to 30-min RELA peaks “with”/”without” motifs in the same TAD.
Next, we sequenced total RNA from HUVECs treated with C646 for 1 h and with TNF for another 30 min (and samples were “spiked” to allow normalization [Risso et al. 2014]) (Supplemental Fig. S7F). Differential expression analysis found >950 genes down-regulated by C646, 15% of which could be assigned to a “with” RELA peak in the same TAD (compared to 9% assigned to “without” peaks) (Fig. 5C). These include mostly key proinflammatory genes (Fig. 5D; Supplemental Fig. S7G), and this trend was verified when ChIA-PET was used to instruct TSS-enhancer connections (Supplemental Fig. S7H). Hence, prelooping might also depend on enhancer acetylation levels to facilitate an acute response.
Altering prelooped topology in the SAMD4A locus affects local regulatory crosstalk
We next used the extended SAMD4A locus to get a better understanding of how a cluster of “with” and “without” enhancer peaks affects gene transcription. We applied a high-resolution 3C variant, “targeted chromatin capture” (T2C) (Kolovos et al. 2014), to analyze changes in spatial interactions at 0 and 30 min post-stimulation. T2C (using HindIII) gave reproducible contact maps of kilobase-resolution matching those obtained by high-resolution Hi-C (Supplemental Fig. S8A,B). In line with 3C-seq results, T2C showed that the overarching locus structure remains largely the same on stimulation. However, we calculated the “directionality index” (i.e., the upstream or downstream interaction bias for all genomic segments) (Dixon et al. 2015) along the locus at 0 and 30 min to find that coregulated SAMD4A and GCH1 are brought into the same subdomain on stimulation (Supplemental Fig. S8C). This subdomain fusion can be explained by the loss of a strong contact between the SAMD4A TSS and a downstream CTCF peak at 30 min (Supplemental Fig. S8D, top). Analysis of contacts involving RELA-bound enhancers showed that the SAMD4A SE is prelooped onto the promoter at 0 min, but also that individual enhancers in the cluster interact strongly with one another (Supplemental Fig. S8D, bottom).
Next, we inserted a strong “barrier” between the SAMD4A TSS and its intronic SE using custom zinc-finger nucleases (Supplemental Fig. S9A). We chose the RN7SK gene promoter as an insert because it is not responsive to TNF (Supplemental Fig. S9B), it is known not to contact RNAPII-transcribed units (Xu and Cook 2008), and active RNAPIII genes are often located at TAD boundaries (Zirkel and Papantonis 2014) and can thus hinder intrachromosomal interactions. We inserted this 128-bp element ∼13.5 kbp downstream from the SAMD4A TSS (in the same orientation as the gene) so as not to interfere with transcriptional initiation (Larkin et al. 2012; Supplemental Fig. S9C). While targeted gene editing of immortalized cells is now routine, it remains challenging to achieve this in primary cells (Gaj et al. 2013); nonetheless, a single cell-derived HUVEC clone carrying a homozygous insertion that responds normally to TNF and shows expected RELA binding profiles was generated (Supplemental Fig. S9D,E).
T2C (using ApoI) was applied to wild-type (“wt”) and modified cells (“7SKi”) and allowed locus-wide comparisons at ∼0.5-kbp resolution. Again, this revealed little change in the global overarching topology (Supplemental Fig. S9F,G). Although transcription at both the TSS and the SE cluster remain essentially unaffected (assessed by RNA-seq in 7SKi cells), local changes in spatial contacts did occur (and this was verified by 3C-seq using either the SAMD4A TSS or the RN7SK insertion as viewpoints) (Fig. 6A–C). More specifically, a loss of upstream spatial contacts from the SAMD4A intronic SE and a reshuffling of interactions involving downstream targets was observed (especially at 30 min) (Fig. 6D). The effect of contact loss varied, consistent with the idea of multimodal and context-specific regulation by NF-κB. For example, both responsive LGALS3 and TBPL2 genes (associated with RELA “with” peaks) are suppressed in 7SKi cells, while the TNF-suppressed FBXO34 gene (associated with promoter-bound JDP2) displays increased expression (Fig. 6E). Still, GCH1 RNA levels do not change, as it is contacted by the SE in both 7SKi and wild-type cells, and SAMD4A levels are only marginally affected, which is reminiscent of its response to C646. Taken together, these results show how a cluster of “with” and “without” enhancers can exert variable regulatory effects based on the context it is spatially brought in—and this, again, may involve both stimulatory and repressive effects.
Figure 6.

Inserting the RN7SK promoter in SAMD4A alters NF-κB–driven spatial interactions. Wild-type (wt) or 7SKi HUVECs (a single cell-derived clone with the RN7SK promoter inserted 13.5 kbp downstream from the SAMD4A TSS) were treated with TNF for 0 or 30 min. (Purple triangles) Insertions, (magenta boxes) intronic SAMD4A enhancer cluster. (A) T2C contact maps. (White circles) Two exemplary interactions of the SAMD4A TSS that differ in the two cell populations. One (left) involves contacts with the intronic enhancer cluster, the second (right) with the CTCF site immediately downstream from the enhancer cluster. RELA and CTCF ChIP-seq tracks are also shown below the SAMD4A gene model. (B) 3C- and ChIP-seq data (in reads per million) from wt (gray background) and 7SKi HUVECs. (Yellow triangle) 3C-seq viewpoint at the SAMD4A TSS, (purple triangle) 3C-seq viewpoint at the RN7SK insertion. (C) Total RNA- and ChIP-seq data (in reads per million) from wt (gray background) and 7SKi HUVECs along the SAMD4A locus. (D) Interactions captured by T2C between the 13 RELA-bound enhancers at 0 and 30 min in the two cell populations; RELA ChIP-seq levels for each peak are also shown (right). (E) (Top) Interactions captured by T2C between the intronic SAMD4A enhancer cluster (“SE”) and gene TSSs within 3 Mbp. All interactions with ≥0.013 rpm are indicated by the spider plot. (Bottom) Log2-fold changes in intronic RNA levels after 30 min of TNF stimulation of genes in the extended locus (iRNA-seq data); noncontacted TNFAIP3 and CXCL3 serve as controls.
Discussion
Gene expression in human endothelial cells is rapidly remodeled during the early phase that follows TNF stimulation (Fig. 1). This is all essentially the result of nuclear translocation and DNA binding of the NF-κB heterodimer (Bhatt and Ghosh 2014; Smale and Natoli 2014), which, despite the presence of hundreds of thousands of canonical recognition motifs in the genome, binds sites not carrying the expected motif in >50% of cases (this can be detected for ∼30% of binding events in LPS-stimulated cells and in in vitro binding arrays) (Ghisletti et al. 2010; Wong et al. 2011; Saliba et al. 2014; Zhao et al. 2014). Here, >60% of all early RELA binding events involve binding at already-active cis-elements, mostly AP-1–bound enhancers that are “without motif” and are more conserved among vertebrates compared to sites “with motif” (Fig. 2). Thus, the cell-type–specific cis-regulatory circuitry and its spatial interactome, both controlling the cell's core gene expression program, need to become bound by NF-κB soon after stimulation to facilitate induction of the proinflammatory cascade (Figs. 3, 4). This, of course, cannot be a feature unique to NF-κB (see, for example, studies on the binding of the glucocorticoid receptor) (Rogatsky et al. 2002; Schiller et al. 2014) but serves as a broadly applicable example of how TFs might ignore some of their cognate sites and bind noncanonical ones via cofactors.
The deployment of a new transcriptional program in response to cytokine stimulation is bound to suppress at least part of the cell's ongoing program. NF-κB has been shown to achieve this either directly via non-RELA-containing complexes (NFKB1::NFKB2, NFKB2::NFKB2, which we do not detect here) (Hayden and Ghosh 2008; Zhao et al. 2014) or via cofactor redistribution (Schmidt et al. 2015). Here, we show that direct RELA-mediated repression can also take place, using the BMP4 locus and genome-wide JDP2 binding as an example (Fig. 4; Supplemental Fig. S5). Gene promoters looped to RELA “with” enhancers are generally up-regulated by TNF, regardless of whether they might bind JDP2 or not. On the other hand, looping to a RELA “without” enhancer and binding JDP2 can invoke repression (Fig. 3; Supplemental Figs. S2, S5). Although the former association is stronger than the latter, this highlights a hitherto underappreciated function of NF-κB and suggests that TFs driving other signaling responses might also function in this manner. Of course, other, perhaps indirect, pathways might lead also to repression, and these remain to be dissected.
RELA-bound “super-enhancers” have been implicated in the inflammatory response (Brown et al. 2014; Schmidt et al. 2015). However, it is very likely that many such clusters will not act as a single unit (Hay et al. 2016; Shin et al. 2016), and we find many of them carrying both “with” and “without” peaks (Supplemental Fig. S6). One such large cluster in the SAMD4A intron is prelooped to the TSS of the gene (Fig. 4; Supplemental Fig. S8). Abrogation of this prelooping via C646 treatment or via the insertion of the RN7SK promoter does not severely inhibit transcription of the gene itself. However, in genome-modified HUVECs, the SE develops a different interactome that differentially affects the regulation of surrounding genes (Fig. 6), an effect similar to that observed upon insertion of the beta globin locus control region into a gene-dense region of the mouse genome (Noordermeer et al. 2008). This diverse regulatory output is in line with a role for NF-κB as both an activator and a repressor and with the formation of NF-κB–driven spatial networks (Papantonis et al. 2012; Kuznetsova et al. 2015).
Finally, our work highlights how TADs offer a stable context into which cis-regulatory elements exert their multimodal roles. Once this context is altered, in this case upon nuclear translocation of a transcription factor that binds and remodels pre-existing spatial interactions, the same cis-elements may take up new, often completely different, regulatory roles. Hence, a quantitative understanding of cell-type–specific TF-binding determinants and of the extent, strength, and hierarchical construction of stimulus-driven spatial networks is necessary.
Methods
Cell culture
HUVECs from pooled donors were grown to 85%–90% confluence in Endothelial Basal Medium 2-MV with supplements (EBM; Lonza) and 5% FBS, “starved” for 16–18 h in EBM+0.5% FBS, treated with TNF (10 ng/mL; Peprotech), and harvested at 0, 30, 60, or 90 min post-stimulation; in some cases, 50 µM C646 (an EP300 inhibitor) (Bowers et al. 2010) or 50 µM DRB (5,6-dichloro-1-β-D-ribo-furanosyl-benzimidazole) was added for 1 h before harvesting.
High-throughput RNA sequencing (RNA-seq) and data analysis
Total RNA was extracted from HUVECs at different times post-stimulation using TRIzol (Ambion), DNase-treated, rRNA-depleted using a kit (RiboMinus; Epicentre), chemically fragmented into pieces of ∼350 nt, and cDNA was generated using random hexamers according to the TruSeq protocol before sequencing on a HiSeq 2000 (Illumina). Poly(A)+-enriched samples were obtained using the same procedure with the addition of a selection on an oligo-dT column (Kelly et al. 2015). Approximately 180 and 120 million read pairs/sample of total and poly(A)+-selected RNA were generated, respectively. Reads were then aligned to the human reference genome (NCBI build 36; hg18) using TopHat (Trapnell et al. 2009) and default parameters (“no-coverage-search,” “segment-length 18” as input options), and reads that did not map uniquely were discarded. Counts of uniquely mapped reads from total, ribodepleted RNA-seq were used as input for the “iRNA-seq” pipeline (Madsen et al. 2015) using the “intron” option for analysis of differential gene expression. For poly(A)+ RNA-seq analysis, uniquely mapped reads were counted per each RefSeq gene exon using HTseq (Anders et al. 2015), and statistical analysis of differentially expressed genes was performed via DESeq (Anders and Huber 2010). In all cases, up- and down-regulated genes were selected to have at least ±0.6 log2 fold-change in RNA levels compared to 0-min levels, and ≥1 FPKM at the stimulated or unstimulated state, respectively. These gene subsets were used for generating boxplots (“spear” whiskers) (Spitzer et al. 2014) and for performing Gene Ontology analysis (http://www.metascape.org/; Tripathi et al. 2015). For normalization of RNA-seq samples (especially those involving C646 treatment or the RN7SK insertion that could compromise differential expression analysis), we used artificial “spike-in” sequences developed by the External RNA Controls Consortium (ERCC) (https://www.thermofisher.com/order/catalog/product/4456740) in all samples. Following sequencing, paired-end reads were aligned to a modified genome containing the ERCC sequences using TopHat (Trapnell et al. 2009), counted using HTseq (Anders et al. 2015), and differential expression analysis performed via the RUVSeq package under default settings (Risso et al. 2014). Genes deemed as up-/down-regulated in all conditions are listed in Supplemental Tables S1–S3.
Chromatin immunoprecipitation (ChIP-seq) and data analysis
Typically, 15–30 million HUVECs were crosslinked (10 min, 20°C) in 1% paraformaldehyde (Electron Microscopy Science) at 0, 30, or 60 min after TNF induction, nuclei were isolated, and chromatin was prepared, fragmented, and collected using the ChIP-It High Sensitivity kit (Active Motif); immunoprecipitations were performed on aliquots of ∼25 µg chromatin using antisera targeting acetylated lysine 27 of histone H3 (Abcam; ab4729), the phospho-CTD of RNA polymerase II (a gift by Hiroshi Kimura) (Papantonis et al. 2012), JDP2 (Santa Cruz Biotechnology; sc-367695X), or IgG controls (Active Motif; 53017). DNA was purified using a DNA clean-up kit (Zymo Research) and used either for qPCR analysis on a Rotor-Gene 3000 cycler (Qiagen) or as template for high throughput DNA sequencing on an Illumina HiSeq 2000 platform. ChIP-seq data for NF-κB (targeting its RELA subunit) were generated previously (Papantonis et al. 2012). All other data on CTCF binding, DNase I footprinting, and histone modifications in unstimulated HUVECs come from the ENCODE project (The ENCODE Project Consortium 2012). In all cases, raw read files were aligned to the human reference genome (NCBI build 36; hg18) using Bowtie (Langmead et al. 2009) and discarding reads mapping to multiple genomic locations. Uniquely mapped reads were given a fragment size of 200 bp in MACS, which was used to identify binding peaks (Zhang et al. 2008), and the ShortRead package (Morgan et al. 2009) was used to convert these into genome-wide coverage files. Using negative binomial distributions, we assigned P-values and false discovery rates (FDRs) to each binding region (Rozowsky et al. 2009), and the final peak lists were compiled according to the following criteria: ≥20 read counts at each peak summit and FDR ≤ 0.001 (using nonspecific, IgG, ChIP-seq data as background). Overlaps between binding peaks in the different data sets were identified using the “findOverlaps” function from the GenomicRanges suite, while the iRanges package (Lawrence et al. 2013) was used in custom R scripts for annotating the genomic location of peaks and defining the closest gene to each (where the ChIP-seq peak and the gene TSS were required to reside in the same TAD), as well as the overlap to the 575,090 canonical NF-κB binding sites. Finally, heat maps and line plots were generated using seqMINER (“raw” k-means clustering) (Ye et al. 2011) and NGSplot (Shen et al. 2014).
Chromosome conformation (3C) and targeted chromatin capture
3C-seq (Stadhouders et al. 2013) and T2C (Kolovos et al. 2014) were both performed in two biological replicates as described. In brief, ∼10 million HUVEC nuclei were crosslinked in 1% paraformaldehyde (10 min, 20°C; Electron Microscopy Science) and isolated at 0, 30, and 60 min post-stimulation. Chromatin was cut using ApoI or HindIII (New England Biolabs) and ligated in dilution under conditions that allowed most nuclei to remain intact. For 3C-seq, ligated DNA was recut with DpnII and ligated, and PCR was performed for each viewpoint (primer list in Supplemental Table S4) before the amplified material was sequenced to 3 million reads/sample on average. For T2C, ligated DNA was reduced in size by a combination of DpnII digestion and sonication and sequenced to >25 million reads/sample (details in Supplemental Table S5) on a HiSeq 2000 platform (Illumina). Raw data were mapped to the reference genome (hg18) and analyzed using the r3Cseq (Thongjuea et al. 2013) or a custom pipeline (Kolovos et al. 2014) for 3C-seq and T2C, respectively. 3C-seq data were visualized on the UCSC Genome Browser using “bedGraph” files and the 6-pixel smoothing option; T2C data were visualized in 2D interaction plots as previously described (Kolovos et al. 2014). NGSplot (Shen et al. 2014) was used to generate coverage plots along 3C-seq fragments carrying >100 reads per million of signal (a cutoff defined based on the average 3C-seq read distribution, so as to avoid analysis of poorly contacted fragments). For Hi-C procedures and analyses, please refer to the Supplemental Methods.
Generation of genome-edited HUVECs using zinc-finger nucleases (ZFNs)
A pair of ZFNs designed to specifically target an intronic region 13.5 kbp downstream from the SAMD4A TSS (Chr 14: 54,117,868–54,117,908; hg18) was custom-produced (Sigma-Aldrich). Plasmids carrying the ZFN open reading frames were in vitro transcribed to obtain the ZFN mRNAs according to the manufacturer's instructions. In brief, plasmids were linearized by digestion with XbaI (New England Biolabs), purified, and in vitro transcribed using the Message MAX T7 ARCA-Capped Message Transcription kit (Epicentre). Poly-adenylation was carried out using the Poly(A) Polymerase Tailing kit (Epicentre), and ZFN mRNAs were purified using the MEGAclear kit (Ambion). ZFN mRNA quality was assessed on denaturing 1.2% agarose gels containing formaldehyde. The cutting and targeting efficiency of the ZFNs was verified via CelI enzymatic assays (Transgenomic SURVEYOR kit) as per the manufacturer's instructions using HUVECs transfected with 2.5 µg of each ZFN plasmid or 2 µg of each ZFN mRNA. To achieve insertions, a repair vector was generated by cloning the pUC19 polylinker between the upstream and downstream SAMD4A homology regions (each ∼750 bp long), and then subcloning the 128-bp RN7SK promoter (Xu and Cook 2008) between XbaI and KpnI sites. The constructs were validated by sequencing, amplified in One Shot TOP10 Chemically Competent cells (Invitrogen) and purified using a maxiprep kit (Qiagen). The inserted promoter sequence is the following:
1 AAGCTTAGATCAGCTTGCATGCCTGCAGGTCGACTCTAGAT AGCGCTACCGGACTCAGATCTCGA
66 GCTCAAGCTTCGAATTCTGCAGTATTTAGCATGCCCCACCC ATCTGCAAGGCATTCTGGATAG
As HUVECs are difficult to transfect, we optimized conditions using the Amaxa HUVEC Nucleofector kit (Lonza) and the pmax-GFP plasmid (Lonza) and assessed efficiency by fluorescence microscopy. Finally, HUVECs from pooled donors (Lonza), grown to 80%–90% confluence in 10-cm dishes, were transfected with 2 µg of the RN7SK-repair template plus 1.5 µg of each ZFN plasmid or 2 µg of each ZFN mRNA, and harvested at 80% confluence to isolate genomic DNA using the GenElute Mammalian Genomic DNA Miniprep kit (Sigma-Aldrich) for an initial PCR-based screen. In our hands, ZFN plasmid transfections worked best; hence, these cells were then grown in 96-well plates at single-cell dilution and maintained in quadruplets for downstream work. Single cell-derived HUVEC populations were PCR-screened for the insertion using primers that (1) anneal to the homology regions and should amplify both remaining plasmid and the genomic locus, (2) anneal in the upstream homology region and a region only found on the repair template to control for the amount of nondegraded plasmid, or (3) anneal to the upstream homology region or insert, respectively, and just downstream from the homology region within SAMD4A to amplify only the genomic locus. PCRs were conducted using the GoTaq DNA polymerase (Promega), and amplimers were resolved by electrophoresis in ready-made 1% agarose gel containing ethidium bromide (E-Gel 96, Invitrogen). Clones that were positive in these screens were grown into increasingly larger tissue culture containers (24-well, 12-well, 10- and 15-cm plates), tested for genome integrity using Comet assays, and expanded to obtain sufficient cell numbers for RNA-, 3C-, and ChIP-seq for RELA and EP300 (outsourced to Active Motif) at 0 and/or 30 min post-stimulation, making sure cells did not enter senescence.
Data access
RNA-seq, ChIP-seq, Hi-C, 4C-seq, and T2C data from this study have been submitted to the NCBI Sequence Read Archive (SRA; http://www.ncbi.nlm.nih.gov/sra/) under accession number SRP066044.
Supplementary Material
Acknowledgments
We thank Alvaro Rada-Iglesias, Dimitris Thanos, Joost Gribnau, Danny Huylebroeck, and members of our labs for comments on the manuscript, and the Cologne Center for Genomics for sequencing. This work was supported by funding from the Wellcome Trust (to P.R.C.), the SyBoss, Bluescript EU Integrated Project, MEC Booster, and Seventh Framework Programme: Epigensys (ERASysBio+/FP7) initiatives (to P.K. and F.G.G.), the Interdisciplinary Centre for Clinical Research of the RWTH Aachen University (to I.G.C.), and by CMMC intramural and Fritz Thyssen Stiftung funds (3D-DM1, to A.P.).
Author contributions: P.K., F.G.G., P.R.C., and A.P. conceived experiments. P.K., T.G., A.K., J.D.L., A.Z., L.B., and A.P. performed experiments. P.K., T.G., M.N., and A.P. performed bioinformatic analysis. E.G.G. and I.G.C. performed DHS-footprint and de novo motif analyses. T.A.K. helped design T2C probes. W.F.I. sequenced 3C-seq, T2C, and ChIP-seq libraries. All authors interpreted data and prepared figures. P.K., F.G.G., and A.P. wrote the manuscript with input from all other coauthors.
Footnotes
[Supplemental material is available for this article.]
Article published online before print. Article, supplemental material, and publication date are at http://www.genome.org/cgi/doi/10.1101/gr.210005.116.
References
- Anders S, Huber W. 2010. Differential expression analysis for sequence count data. Genome Biol 11: R106. [DOI] [PMC free article] [PubMed] [Google Scholar]
- Anders S, Pyl PT, Huber W. 2015. HTSeq—a Python framework to work with high-throughput sequencing data. Bioinformatics 31: 166–169. [DOI] [PMC free article] [PubMed] [Google Scholar]
- Antonaki A, Demetriades C, Polyzos A, Banos A, Vatsellas G, Lavigne MD, Apostolou E, Mantouvalou E, Papadopoulou D, Mosialos G, et al. 2011. Genomic analysis reveals a novel nuclear factor-κB (NF-κB)-binding site in Alu-repetitive elements. J Biol Chem 286: 38768–38782. [DOI] [PMC free article] [PubMed] [Google Scholar]
- Aronheim A, Zandi E, Hennemann H, Elledge SJ, Karin M. 1997. Isolation of an AP-1 repressor by a novel method for detecting protein-protein interactions. Mol Cell Biol 17: 3094–3102. [DOI] [PMC free article] [PubMed] [Google Scholar]
- Belton JM, McCord RP, Gibcus JH, Naumova N, Zhan Y, Dekker J. 2012. Hi-C: a comprehensive technique to capture the conformation of genomes. Methods 58: 268–276. [DOI] [PMC free article] [PubMed] [Google Scholar]
- Bhatt D, Ghosh S. 2014. Regulation of the NF-κB-mediated transcription of inflammatory genes. Front Immunol 5: 71. [DOI] [PMC free article] [PubMed] [Google Scholar]
- Bhatt DM, Pandya-Jones A, Tong AJ, Barozzi I, Lissner MM, Natoli G, Black DL, Smale ST. 2012. Transcript dynamics of proinflammatory genes revealed by sequence analysis of subcellular RNA fractions. Cell 150: 279–290. [DOI] [PMC free article] [PubMed] [Google Scholar]
- Bowers EM, Yan G, Mukherjee C, Orry A, Wang L, Holbert MA, Crump NT, Hazzalin CA, Liszczak G, Yuan H, et al. 2010. Virtual ligand screening of the p300/CBP histone acetyltransferase: identification of a selective small molecule inhibitor. Chem Biol 17: 471–482. [DOI] [PMC free article] [PubMed] [Google Scholar]
- Brown JD, Lin CY, Duan Q, Griffin G, Federation AJ, Paranal RM, Bair S, Newton G, Lichtman AH, Kung AL, et al. 2014. NF-κB directs dynamic super enhancer formation in inflammation and atherogenesis. Mol Cell 56: 219–231. [DOI] [PMC free article] [PubMed] [Google Scholar]
- Buerki C, Rothgiesser KM, Valovka T, Owen HR, Rehrauer H, Fey M, Lane WS, Hottiger MO. 2008. Functional relevance of novel p300-mediated lysine 314 and 315 acetylation of RelA/p65. Nucleic Acids Res 36: 1665–1680. [DOI] [PMC free article] [PubMed] [Google Scholar]
- Cartee TV, White KJ, Newton-West M, Swerlick RA. 2012. Hypoxia and hypoxia mimetics inhibit TNF-dependent VCAM1 induction in the 5A32 endothelial cell line via a hypoxia inducible factor dependent mechanism. J Dermatol Sci 65: 86–94. [DOI] [PMC free article] [PubMed] [Google Scholar]
- Caudron-Herger M, Cook PR, Rippe K, Papantonis A. 2015. Dissecting the nascent human transcriptome by analysing the RNA content of transcription factories. Nucleic Acids Res 43: e95. [DOI] [PMC free article] [PubMed] [Google Scholar]
- Diermeier S, Kolovos P, Heizinger L, Schwartz U, Georgomanolis T, Zirkel A, Wedemann G, Grosveld F, Knoch TA, Merkl R, et al. 2014. TNFα signalling primes chromatin for NF-κB binding and induces rapid and widespread nucleosome repositioning. Genome Biol 15: 536. [DOI] [PMC free article] [PubMed] [Google Scholar]
- Dixon JR, Jung I, Selvaraj S, Shen Y, Antosiewicz-Bourget JE, Lee AY, Ye Z, Kim A, Rajagopal N, Xie W, et al. 2015. Chromatin architecture reorganization during stem cell differentiation. Nature 518: 331–336. [DOI] [PMC free article] [PubMed] [Google Scholar]
- The ENCODE Project Consortium. 2012. An integrated encyclopedia of DNA elements in the human genome. Nature 489: 57–74. [DOI] [PMC free article] [PubMed] [Google Scholar]
- Fraser J, Ferrai C, Chiariello AM, Schueler M, Rito T, Laudanno G, Barbieri M, Moore BL, Kraemer DC, Aitken S, et al. 2015. Hierarchical folding and reorganization of chromosomes are linked to transcriptional changes in cellular differentiation. Mol Syst Biol 11: 852. [DOI] [PMC free article] [PubMed] [Google Scholar]
- Gaj T, Gersbach CA, Barbas CF III. 2013. ZFN, TALEN, and CRISPR/Cas-based methods for genome engineering. Trends Biotechnol 31: 397–405. [DOI] [PMC free article] [PubMed] [Google Scholar]
- Ghisletti S, Barozzi I, Mietton F, Polletti S, De Santa F, Venturini E, Gregory L, Lonie L, Chew A, Wei CL, et al. 2010. Identification and characterization of enhancers controlling the inflammatory gene expression program in macrophages. Immunity 32: 317–328. [DOI] [PubMed] [Google Scholar]
- Gusmao EG, Allhoff M, Zenke M, Costa IG. 2016. Analysis of computational footprinting methods for DNase sequencing experiments. Nat Methods 13: 303–309. [DOI] [PubMed] [Google Scholar]
- Hao S, Baltimore D. 2009. The stability of mRNA influences the temporal order of the induction of genes encoding inflammatory molecules. Nat Immunol 10: 281–288. [DOI] [PMC free article] [PubMed] [Google Scholar]
- Hay D, Hughes JR, Babbs C, Davies JO, Graham BJ, Hanssen LL, Kassouf MT, Oudelaar AM, Sharpe JA, Suciu MC, et al. 2016. Genetic dissection of the α-globin super-enhancer in vivo. Nat Genet 48: 895–903. [DOI] [PMC free article] [PubMed] [Google Scholar]
- Hayden MS, Ghosh S. 2008. Shared principles in NF-κB signaling. Cell 132: 344–362. [DOI] [PubMed] [Google Scholar]
- Heinz S, Romanoski CE, Benner C, Glass CK. 2015. The selection and function of cell type-specific enhancers. Nat Rev Mol Cell Biol 16: 144–154. [DOI] [PMC free article] [PubMed] [Google Scholar]
- Hnisz D, Abraham BJ, Lee TI, Lau A, Saint-Andre V, Sigova AA, Hoke HA, Young RA. 2013. Super-enhancers in the control of cell identity and disease. Cell 155: 934–947. [DOI] [PMC free article] [PubMed] [Google Scholar]
- Jin F, Li Y, Ren B, Natarajan R. 2011. PU.1 and C/EBPα synergistically program distinct response to NF-κB activation through establishing monocyte specific enhancers. Proc Natl Acad Sci 108: 5290–5295. [DOI] [PMC free article] [PubMed] [Google Scholar]
- Jin F, Li Y, Dixon JR, Selvaraj S, Ye Z, Lee AY, Yen CA, Schmitt AD, Espinoza CA, Ren B. 2013. A high-resolution map of the three-dimensional chromatin interactome in human cells. Nature 503: 290–294. [DOI] [PMC free article] [PubMed] [Google Scholar]
- Kaikkonen MU, Spann NJ, Heinz S, Romanoski CE, Allison KA, Stender JD, Chun HB, Tough DF, Prinjha RK, Benner C, et al. 2013. Remodeling of the enhancer landscape during macrophage activation is coupled to enhancer transcription. Mol Cell 51: 310–325. [DOI] [PMC free article] [PubMed] [Google Scholar]
- Karin M, Liu Z, Zandi E. 1997. AP-1 function and regulation. Curr Opin Cell Biol 9: 240–246. [DOI] [PubMed] [Google Scholar]
- Kelly S, Greenman C, Cook PR, Papantonis A. 2015. Exon skipping is correlated with exon circularization. J Mol Biol 427: 2414–2417. [DOI] [PubMed] [Google Scholar]
- Kishore R, Qin G, Luedemann C, Bord E, Hanley A, Silver M, Gavin M, Yoon YS, Goukassian D, Losordo DW. 2005. The cytoskeletal protein ezrin regulates EC proliferation and angiogenesis via TNF-α-induced transcriptional repression of cyclin A. J Clin Invest 115: 1785–1796. [DOI] [PMC free article] [PubMed] [Google Scholar]
- Kolovos P, van de Werken HJ, Kepper N, Zuin J, Brouwer RW, Kockx CE, Wendt KS, van IJcken WF, Grosveld F, Knoch TA. 2014. Targeted Chromatin Capture (T2C): a novel high resolution high throughput method to detect genomic interactions and regulatory elements. Epigenetics Chromatin 7: 10. [DOI] [PMC free article] [PubMed] [Google Scholar]
- Kuznetsova T, Wang SY, Rao NA, Mandoli A, Martens JH, Rother N, Aartse A, Groh L, Janssen-Megens EM, Li G, et al. 2015. Glucocorticoid receptor and nuclear factor κ-b affect three-dimensional chromatin organization. Genome Biol 16: 264. [DOI] [PMC free article] [PubMed] [Google Scholar]
- Langmead B, Trapnell C, Pop M, Salzberg SL. 2009. Ultrafast and memory-efficient alignment of short DNA sequences to the human genome. Genome Biol 10: R25. [DOI] [PMC free article] [PubMed] [Google Scholar]
- Larkin JD, Cook PR, Papantonis A. 2012. Dynamic reconfiguration of long human genes during one transcription cycle. Mol Cell Biol 32: 2738–2747. [DOI] [PMC free article] [PubMed] [Google Scholar]
- Lawrence M, Huber W, Pages H, Aboyoun P, Carlson M, Gentleman R, Morgan MT, Carey VJ. 2013. Software for computing and annotating genomic ranges. Plos Comput Biol 9: e1003118. [DOI] [PMC free article] [PubMed] [Google Scholar]
- Le Dily F, Bau D, Pohl A, Vicent GP, Serra F, Soronellas D, Castellano G, Wright RH, Ballare C, Filion G, et al. 2014. Distinct structural transitions of chromatin topological domains correlate with coordinated hormone-induced gene regulation. Genes Dev 28: 2151–2162. [DOI] [PMC free article] [PubMed] [Google Scholar]
- Lévy-Leduc C, Delattre M, Mary-Huard T, Robin S. 2014. Two-dimensional segmentation for analyzing Hi-C data. Bioinformatics 30: 386–392. [DOI] [PMC free article] [PubMed] [Google Scholar]
- Li G, Cai L, Chang H, Hong P, Zhou Q, Kulakova EV, Kolchanov NA, Ruan Y. 2014. Chromatin Interaction Analysis with Paired-End Tag (ChIA-PET) sequencing technology and application. BMC Genomics 15: S11. [DOI] [PMC free article] [PubMed] [Google Scholar]
- Libby P, Ridker PM, Hansson GK. 2011. Progress and challenges in translating the biology of atherosclerosis. Nature 473: 317–325. [DOI] [PubMed] [Google Scholar]
- Lupianez DG, Kraft K, Heinrich V, Krawitz P, Brancati F, Klopocki E, Horn D, Kayserili H, Opitz JM, Laxova R, et al. 2015. Disruptions of topological chromatin domains cause pathogenic rewiring of gene-enhancer interactions. Cell 161: 1012–1025. [DOI] [PMC free article] [PubMed] [Google Scholar]
- Madsen JG, Schmidt SF, Larsen BD, Loft A, Nielsen R, Mandrup S. 2015. iRNA-seq: computational method for genome-wide assessment of acute transcriptional regulation from total RNA-seq data. Nucleic Acids Res 43: e40. [DOI] [PMC free article] [PubMed] [Google Scholar]
- Melnik S, Caudron-Herger M, Brant L, Carr IM, Rippe K, Cook PR, Papantonis A. 2016. Isolation of the protein and RNA content of active sites of transcription from mammalian cells. Nat Protoc 11: 553–565. [DOI] [PubMed] [Google Scholar]
- Morgan M, Anders S, Lawrence M, Aboyoun P, Pages H, Gentleman R. 2009. ShortRead: a bioconductor package for input, quality assessment and exploration of high-throughput sequence data. Bioinformatics 25: 2607–2608. [DOI] [PMC free article] [PubMed] [Google Scholar]
- Moynagh PN. 2005. The NF-κB pathway. J Cell Sci 118: 4589–4592. [DOI] [PubMed] [Google Scholar]
- Noordermeer D, Branco MR, Splinter E, Klous P, van Ijcken W, Swagemakers S, Koutsourakis M, van der Spek P, Pombo A, de Laat W. 2008. Transcription and chromatin organization of a housekeeping gene cluster containing an integrated β-globin locus control region. PLoS Genet 4: e1000016. [DOI] [PMC free article] [PubMed] [Google Scholar]
- Ostuni R, Piccolo V, Barozzi I, Polletti S, Termanini A, Bonifacio S, Curina A, Prosperini E, Ghisletti S, Natoli G. 2013. Latent enhancers activated by stimulation in differentiated cells. Cell 152: 157–171. [DOI] [PubMed] [Google Scholar]
- Papantonis A, Kohro T, Baboo S, Larkin JD, Deng B, Short P, Tsutsumi S, Taylor S, Kanki Y, Kobayashi M, et al. 2012. TNFα signals through specialized factories where responsive coding and miRNA genes are transcribed. EMBO J 31: 4404–4414. [DOI] [PMC free article] [PubMed] [Google Scholar]
- Pombo A, Dillon N. 2015. Three-dimensional genome architecture: players and mechanisms. Nat Rev Mol Cell Biol 16: 245–257. [DOI] [PubMed] [Google Scholar]
- Risso D, Ngai J, Speed TP, Dudoit S. 2014. Normalization of RNA-seq data using factor analysis of control genes or samples. Nat Biotechnol 32: 896–902. [DOI] [PMC free article] [PubMed] [Google Scholar]
- Rogatsky I, Luecke HF, Leitman DC, Yamamoto KR. 2002. Alternate surfaces of transcriptional coregulator GRIP1 function in different glucocorticoid receptor activation and repression contexts. Proc Natl Acad Sci 99: 16701–16706. [DOI] [PMC free article] [PubMed] [Google Scholar]
- Rozowsky J, Euskirchen G, Auerbach RK, Zhang ZD, Gibson T, Bjornson R, Carriero N, Snyder M, Gerstein MB. 2009. PeakSeq enables systematic scoring of ChIP-seq experiments relative to controls. Nat Biotechnol 27: 66–75. [DOI] [PMC free article] [PubMed] [Google Scholar]
- Saliba DG, Heger A, Eames HL, Oikonomopoulos S, Teixeira A, Blazek K, Androulidaki A, Wong D, Goh FG, Weiss M, et al. 2014. IRF5:RelA interaction targets inflammatory genes in macrophages. Cell Rep 8: 1308–1317. [DOI] [PMC free article] [PubMed] [Google Scholar]
- Schiller BJ, Chodankar R, Watson LC, Stallcup MR, Yamamoto KR. 2014. Glucocorticoid receptor binds half sites as a monomer and regulates specific target genes. Genome Biol 15: 418. [DOI] [PMC free article] [PubMed] [Google Scholar]
- Schmidt SF, Larsen BD, Loft A, Nielsen R, Madsen JG, Mandrup S. 2015. Acute TNF-induced repression of cell identity genes is mediated by NFκB-directed redistribution of cofactors from super-enhancers. Genome Res 25: 1281–1294. [DOI] [PMC free article] [PubMed] [Google Scholar]
- Shen L, Shao N, Liu X, Nestler E. 2014. ngs.plot: quick mining and visualization of next-generation sequencing data by integrating genomic databases. BMC Genomics 15: 284. [DOI] [PMC free article] [PubMed] [Google Scholar]
- Shin HY, Willi M, Yoo KH, Zeng X, Wang C, Metser G, Hennighausen L. 2016. Hierarchy within the mammary STAT5-driven Wap super-enhancer. Nat Genet 48: 904–911. [DOI] [PMC free article] [PubMed] [Google Scholar]
- Siggers T, Chang AB, Teixeira A, Wong D, Williams KJ, Ahmed B, Ragoussis J, Udalova IA, Smale ST, Bulyk ML. 2012. Principles of dimer-specific gene regulation revealed by a comprehensive characterization of NF-κB family DNA binding. Nat Immunol 13: 95–102. [DOI] [PMC free article] [PubMed] [Google Scholar]
- Smale ST, Natoli G. 2014. Transcriptional control of inflammatory responses. Cold Spring Harb Perspect Biol 6: a016261. [DOI] [PMC free article] [PubMed] [Google Scholar]
- Spitzer M, Wildenhain J, Rappsilber J, Tyers M. 2014. BoxPlotR: a web tool for generation of box plots. Nat Methods 11: 121–122. [DOI] [PMC free article] [PubMed] [Google Scholar]
- Stadhouders R, Kolovos P, Brouwer R, Zuin J, van den Heuvel A, Kockx C, Palstra RJ, Wendt KS, Grosveld F, van Ijcken W, et al. 2013. Multiplexed chromosome conformation capture sequencing for rapid genome-scale high-resolution detection of long-range chromatin interactions. Nat Protoc 8: 509–524. [DOI] [PubMed] [Google Scholar]
- Thongjuea S, Stadhouders R, Grosveld FG, Soler E, Lenhard B. 2013. r3Cseq: an R/Bioconductor package for the discovery of long-range genomic interactions from chromosome conformation capture and next-generation sequencing data. Nucleic Acids Res 41: e132. [DOI] [PMC free article] [PubMed] [Google Scholar]
- Trapnell C, Pachter L, Salzberg SL. 2009. TopHat: discovering splice junctions with RNA-Seq. Bioinformatics 25: 1105–1111. [DOI] [PMC free article] [PubMed] [Google Scholar]
- Tripathi S, Pohl MO, Zhou Y, Rodriguez-Frandsen A, Wang G, Stein DA, Moulton HM, DeJesus P, Che J, Mulder LC, et al. 2015. Meta- and orthogonal integration of influenza “OMICs” data defines a role for UBR4 in virus budding. Cell Host Microbe 18: 723–735. [DOI] [PMC free article] [PubMed] [Google Scholar]
- Trompouki E, Bowman TV, Lawton LN, Fan ZP, Wu DC, DiBiase A, Martin CS, Cech JN, Sessa AK, Leblanc JL, et al. 2011. Lineage regulators direct BMP and Wnt pathways to cell-specific programs during differentiation and regeneration. Cell 147: 577–589. [DOI] [PMC free article] [PubMed] [Google Scholar]
- Tsujimura T, Klein FA, Langenfeld K, Glaser J, Huber W, Spitz F. 2015. A discrete transition zone organizes the topological and regulatory autonomy of the adjacent Tfap2c and Bmp7 genes. PLoS Genet 11: e1004897. [DOI] [PMC free article] [PubMed] [Google Scholar]
- Wong D, Teixeira A, Oikonomopoulos S, Humburg P, Lone IN, Saliba D, Siggers T, Bulyk M, Angelov D, Dimitrov S, et al. 2011. Extensive characterization of NF-κB binding uncovers non-canonical motifs and advances the interpretation of genetic functional traits. Genome Biol 12: R70. [DOI] [PMC free article] [PubMed] [Google Scholar]
- Xu M, Cook PR. 2008. Similar active genes cluster in specialized transcription factories. J Cell Biol 181: 615–623. [DOI] [PMC free article] [PubMed] [Google Scholar]
- Ye T, Krebs AR, Choukrallah MA, Keime C, Plewniak F, Davidson I, Tora L. 2011. seqMINER: an integrated ChIP-seq data interpretation platform. Nucleic Acids Res 39: e35. [DOI] [PMC free article] [PubMed] [Google Scholar]
- Zhang Y, Liu T, Meyer CA, Eeckhoute J, Johnson DS, Bernstein BE, Nusbaum C, Myers RM, Brown M, Li W, et al. 2008. Model-based analysis of ChIP-Seq (MACS). Genome Biol 9: R137. [DOI] [PMC free article] [PubMed] [Google Scholar]
- Zhao B, Barrera LA, Ersing I, Willox B, Schmidt SC, Greenfeld H, Zhou H, Mollo SB, Shi TT, Takasaki K, et al. 2014. The NF-κB genomic landscape in lymphoblastoid B cells. Cell Rep 8: 1595–1606. [DOI] [PMC free article] [PubMed] [Google Scholar]
- Zirkel A, Papantonis A. 2014. Transcription as a force partitioning the eukaryotic genome. Biol Chem 395: 1301–1305. [DOI] [PubMed] [Google Scholar]
Associated Data
This section collects any data citations, data availability statements, or supplementary materials included in this article.