

Abstract
Advances in single-cell genomics enable commensurate improvements in methods for uncovering lineage relations among individual cells. Current sequencing-based methods for cell lineage analysis depend on low-resolution bulk analysis or rely on extensive single-cell sequencing, which is not scalable and could be biased by functional dependencies. Here we show an integrated biochemical-computational platform for generic single-cell lineage analysis that is retrospective, cost-effective, and scalable. It consists of a biochemical-computational pipeline that inputs individual cells, produces targeted single-cell sequencing data, and uses it to generate a lineage tree of the input cells. We validated the platform by applying it to cells sampled from an ex vivo grown tree and analyzed its feasibility landscape by computer simulations. We conclude that the platform may serve as a generic tool for lineage analysis and thus pave the way toward large-scale human cell lineage discovery.
Central questions in human biology and medicine are in fact questions about the human cell lineage tree: its structure, dynamics, and variance in development, adulthood, and aging, during disease progression, and in response to therapy. Evolution of cancer tumor and metastases, developmental biology, the landscape of immune system maturation, and stem cells dynamics are just a few examples of biological fields for which knowing cell lineage trees in high resolution will help understand their underlying dynamics. Moreover, unraveling the dynamics of diseased cells, which depend on the specific cellular microenvironment and stochastic events, through their cell lineage tree can help in selecting the appropriate treatment, thus facilitating the advancement of personalized medicine. Since the landmark mapping of the complete cell lineage tree of Caenorhabditis elegans, a 1000-cell nematode, methodologies which are based on cellular labeling by reporters (e.g., dyes, fluorescent genes [Kretzschmar and Watt 2012]), and DNA barcodes [Lu et al. 2011]) were developed to enable lineage tracing in higher model organisms including mammals. However, being invasive, they cannot be applied to human research.
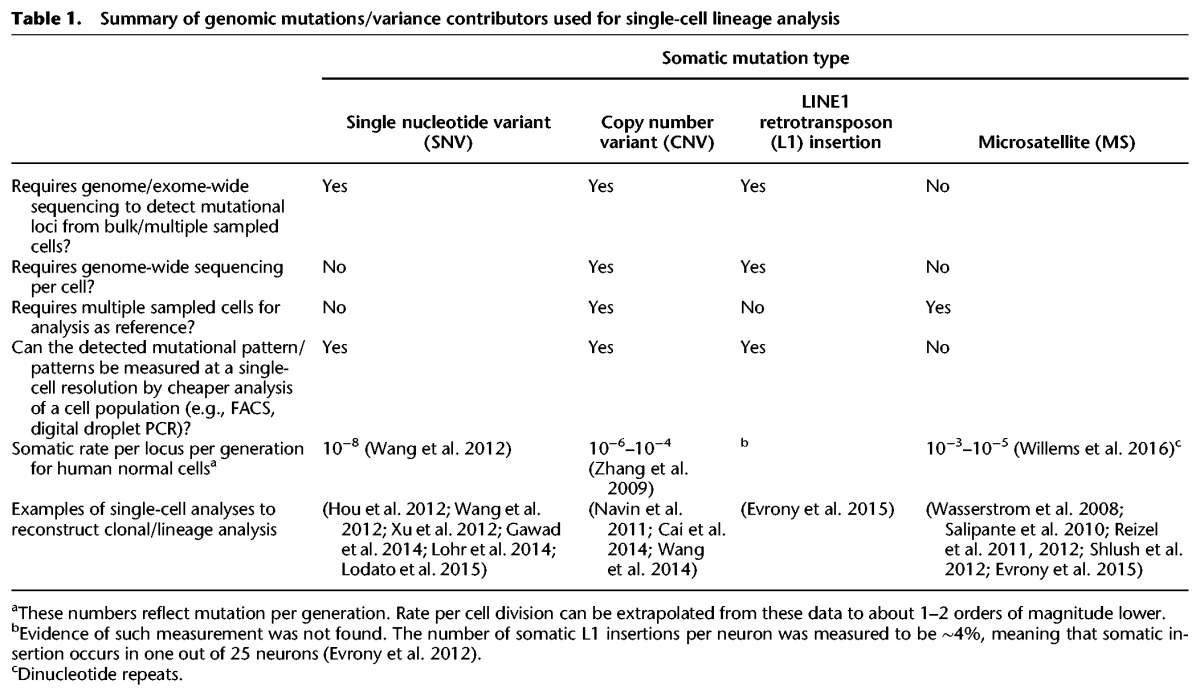
More than a decade ago we suggested that somatic mutations that occur during cell division endow each cell in our body with a genomic signature that is unique with very high probability (Frumkin et al. 2005) and that uncovering these genomic signatures can be used to reconstruct human cell lineage trees. Our laboratory has demonstrated (Frumkin et al. 2005, 2008; Wasserstrom et al. 2008; Reizel et al. 2011, 2012; Segev et al. 2011; Shlush et al. 2012) the feasibility of cell lineage analysis utilizing a low-resolution capillary electrophoresis (CE)-based system (∼100 loci per cell). We analyzed microsatellite (MS) loci, which have high mutation rates in vivo (Table 1) and are considered neutral (Ellegren 2004). Since then, related approaches that take advantage of next generation sequencing (NGS) were developed. Sequencing cell bulks for somatic mutations may supply a coarse estimation of the cell population distribution but cannot specify the deterministic position in the lineage tree of each cell and uncover population heterogeneity and sequencing of single cells (SCs) enabled tracking genomic variants between them (Shapiro et al. 2013). Mutations such as single nucleotide variants (SNV), copy number variants (CNV), retrotransposons, and MSs were utilized to determine genomic distance and variability between individual cells, thus enabling clonal inference and reconstruction of cell lineage trees (see examples in Table 1). However, existing cell lineage methods are not generic and are usually typed for a specific disease (e.g., cancer patients and their specific point mutations). In addition, in spite of the striking reduction in sequencing costs, sequencing whole genomes or even whole exomes from multiple cells is not a scalable approach for studying the lineage of hundreds of cells or more (Hou et al. 2012; Xu et al. 2012). Moreover, available commercial methods for targeted enrichment are not cost-efficient for large-scale projects (hundreds of cells or more) and therefore not applicable to standard SC experiments.
Table 1.
Summary of genomic mutations/variance contributors used for single-cell lineage analysis
Cell lineage analysis based on SC DNA sequencing poses many challenges, since the starting material consists of only one copy of each DNA molecule. Both DNA isolation and amplification introduce technical noise, and methods for measuring and reducing it, both biochemically and computationally, are still under extensive research (Shapiro et al. 2013). Targeting highly mutable regions such as MSs in SCs poses an even greater challenge, as regions that are highly mutable in vivo are often also mutable in vitro, when prepared for and during sequencing. Yet, we opted to develop our own method for efficient targeting of MSs in SCs in order to obtain sufficient SC mutational information without resorting to high-coverage whole-genome sequencing.
Based on this concept, here we describe a generic, retrospective, cost-effective, and scalable SC lineage analysis platform that consists of a molecular biology pipeline followed by a computational pipeline. The pipelines aim to accurately analyze thousands of MS loci per cell using a microfluidics-based PCR targeted enrichment protocol, followed by PCR-based library preparation and NGS. A computational module performs sequencing data analysis that compares MS somatic mutations between cells and reconstructs the cell lineage tree. The platform enables sequencing and analysis of hundreds of cells per run in a two-day preparation process (starting from a whole genome amplification [WGA] product as template). It also enables custom targeting of specific loci, in addition to the standard MS panel, resulting in a more informative cell lineage tree that integrates information derived from various somatic mutations/genomic regions of interest, e.g., specific genes/loci/SNVs.
Results
A generic cell lineage analysis platform
To enable a cost-effective system, we have designed a simple molecular biology pipeline that uses two-step multiplexed PCR for target enrichment and low reaction volumes to increase performance and accuracy (Fig. 1; Supplemental Fig. S1). Our protocol generates dual indexed Illumina libraries cheaply and is more scalable compared to the standard Illumina library preparation protocol (see Methods section; Supplemental Fig. S2). The first multiplexed PCR enriches for specific MS genomic loci (known or suspected SNV loci can also be targeted) and attaches a partial Illumina library universal sequence on the flanking regions of the amplicon. Following pooling of all amplicons, the second PCR step relies on the flanking universal sequence to attach a sample-specific barcode and to form a full-length Illumina library.
Figure 1.

A schematic pipeline of the single-cell lineage analysis platform. (A) Tumor and metastases are given as an example for the utilization of the platform to study cancer dynamics (red, yellow, and blue cell populations). (Top left box) Single cells are extracted from an individual, and DNA is extracted and amplified using whole-genome amplification (WGA). (Bottom box) The amplified DNA from the cells to be analyzed as well as PCR primer pairs in multiplex groups are fed to an Access Array microfluidic chip (Fluidigm). The first PCR targets thousands of specific loci (mainly MSs) from each single-cell DNA. All PCR products of the same cell are harvested into a single well. The second PCR adds a universal sequence at both sides of the first PCR products, where each sample is barcoded with a unique set of primer pairs, resulting in a sequencing-ready library. Pooling the libraries and sequencing them (top right box) enables the analysis and reconstruction of the cell lineage tree. An elaboration of the process is described in the Methods section and Supplemental Figures S1 and S2. (B) Schematic representation of the normalization intended for equalization of reads distribution between samples in a multiplexed NGS run. (A) An equal volume of samples at equal concentrations is pooled and sequenced in a low-coverage sequencing run (Miseq, Illumina). (B) Volume normalization according to user-defined parameters is performed, and (C) another cherry picking is carried out according to normalized volumes (see Supplemental Fig. S6).
In order to validate the two-step PCR scheme, we processed SC DNA samples that originated from mismatch repair-deficient mice (Mlh1−/−) colon crypts, which were previously analyzed using the capillary-based system (Reizel et al. 2011) and demonstrated the successful reconstruction of the expected crypt dynamics, with only ∼180 MS loci panel (Supplemental Note S1; Supplemental Fig. S3; Supplemental Table S1). We then sought to improve the cost-effectiveness and robustness of the platform by modifying molecular biology protocols and integrating the platform with computer support and high-throughput and low-volume devices (see Methods section): (1) In order to enable a cost-effective, highly multiplex PCR, the first PCR amplification was performed in a microfluidic Access Array chip (AA, Fluidigm), which also automatically pools all PCR products of a sample to a single tube (see Fig. 1). Our current set of ∼2000 primers is distributed to multiplex groups that mainly consist of ≤43× primer pairs per reaction well. Most of the MS panel is designed for (A) MSs of type AC on the X Chromosome to allow for monoallelic MS calling (Frumkin et al. 2008; Wasserstrom et al. 2008; Reizel et al. 2011; Segev et al. 2011; Shlush et al. 2012) and for (B) the longest MS loci possible, which exhibit a higher mutation rate in vivo (Ellegren 2004; Supplemental Table S2). Notably, primers were designed such that the entire MS will be covered within a 150-bp read (see Methods). (2) We modified the second PCR to apply a sample barcode by utilizing combinations of forward and reverse PCR primer combinations, resulting in a dual indexed NGS library (Supplemental Fig. S4; Supplemental Table S3). (3) A database that collects information regarding DNA samples and primers was designed. This database contains data on reagent stocks and usage during the pipeline. In addition, it allows the coupling of sequencing data to DNA samples, allowing efficient bioinformatics analysis. (4) Robotic scripts were automatically generated for laborious/high-throughput tasks: primer pair mixing into multiplex groups, random sample picking into AA PCR reactions to eliminate sample bias according to plate or chip location (Supplemental Fig. S5). Magnetic beads PCR purifications and equalization of sample concentration were performed automatically (Evoware, Tecan) (See Supplemental Note S2 for elaboration on robotic reactions and example scripts). (5) Sample pooling was performed in a novel iterated manner using the noncontact nanoliter liquid handler (Echo550, Labcyte) (Fig. 1B): Following sample pooling at an equal volume (assuming an equimolar concentration per sample) and low coverage sequencing (Miseq, Illumina), sample success was evaluated (allele dropout, successfully aligned amplicon count). Later, another iteration of cherry picking was performed on selected samples with normalized volumes to reduce variance between sample read counts in a subsequent high-throughput sequencing (NextSeq 500, Illumina) (Supplemental Fig. S6).
We have developed a computational analysis pipeline that starts with the raw sequencing data and ends with a reconstructed cell lineage tree along with statistical significance analysis that is based on various annotations of the different samples. The cell lineage tree can be easily integrated with functional analysis derived either from SNVs that were targeted as part of the AA panel or from other sources, such as expression data derived from protocols that extract both DNA and RNA of the same SC (Dey et al. 2015; Macaulay et al. 2015). A detailed description of the computational analysis pipelines is provided in Supplemental Note S3, Supplemental Figures S7–S12, and Supplemental Table S4.
Cell lineage tree of ex vivo grown cancer cells
Current estimations of MS mutation rates range between 10−3 and 10−5 mutations per locus per cell division, depending on various factors such as the MS length, repeat type, and the specific cell genotype (Ellegren 2004). Using computer simulations, we concluded that the current panel size of ∼2000 MS loci does not allow performing lineage reconstruction using a normal cell population with a limited number of cell divisions (Fig. 5, see below). We thus opted to evaluate the platform on cancerous cells, which harbor microsatellite instability (MSI), as cancer is the major application of clonal analysis and cell lineage reconstruction (Ding et al. 2012; Gawad et al. 2014; Lohr et al. 2014; Wang et al. 2014). We designed a novel controlled ex vivo experiment utilizing DU145, a human male prostatic carcinoma cell line, via an automated cell picking device (CellCelector, ALS) (Fig. 2; Supplemental Fig. S13): SCs were seeded in separate microwells and underwent clonal expansion. Then, repeatedly, SCs were picked from microwells containing SC clones, seeded separately in new microwells, and expanded. The process generated an ex vivo cell lineage tree with a known topology in which each SC clone is represented by a node in the tree (Fig. 2A). Collaterally, we picked SCs from multiple SC clones and fed them as input into our cell lineage analysis platform (Fig. 2B). Knowing the ex vivo lineage tree allows verifying the reconstruction power of the cell lineage analysis platform by comparing the known tree and the reconstructed tree (Frumkin et al. 2005). Two aspects of the reconstruction accuracy were examined: (1) comparing topologies of the reconstructed tree with the known tree; and (2) comparing the depth of cells (the number of cell divisions from the most common recent ancestor [MRCA]) as inferred from the reconstructed tree and the known tree. We picked 167 SCs from 45 SC clones corresponding to nine seeding time points (see tree topology in Supplemental Fig. S14) and subjected them to our platform using a panel of 1759 primer pairs, the targets of which include 2087 MSs (Supplemental Table S2). Average reads for each sample was 1.6M, and using 1759 targets the average reads per target is about 1000. We analyzed only targets that resulted in >10 reads in at least two samples, which excluded 108 targets (5%). An average of 68% of the reads were successfully mapped to the targets shown in Supplemental Table S2 (63% were mapped to MS and 5% to non-MS targets). Out of the remaining reads about half were the result of either dimerization or mispriming, and the rest had low alignment scores and thus were excluded from the analysis. MS sizes were called by an in-house calling algorithm (Supplemental Note S3; Supplemental Figs. S15, S16).
Figure 5.

Reconstruction accuracy as a function of the number of MS loci of the simulated ex vivo tree (a random reconstructed tree achieves an accuracy of 33%). (A) Reconstruction accuracy as a function of the number of MS loci using current signal quality as calibrated from the ex vivo experiments. Green and red areas represent performance accuracy of normal cells (medium and lower mutation rates), whereas the blue area represents accuracy of MSI cells (higher mutation rate). Note that the signal quality of MSI cells is lower than that of the normal cells due to chromosomal aberrations. The red circle indicates performance of the current ∼2000 loci panel as applied to the cancer ex vivo experiment. (B) Same as A but using improved signal parameters (less noise and less dropout) expected in the future. Inner lines represent average results over 10 simulations and shaded areas represent the standard deviation.
Figure 2.

Cell lineage analysis of a controlled ex vivo tree. Schematic representation of the ex vivo SC clone tree experiment. (A) Single cells are picked from a plate to form colonies. After a limited number of cell divisions, cells are picked from each clone to form SC subclones. Repeating this step generates a SC clone tree with a known structure. (B) Collaterally, in each passage in which single cells are selected for SC subcloning, single cells are picked to a PCR plate for WGA and subsequent cell lineage analysis.
The DU145 cell line carries various chromosomal aberrations including CNVs, although aberrations on the DU145 X Chromosome were not clearly observed by karyotyping (Supplemental Fig. S17). Nevertheless, we noted that a substantial number of loci from the X Chromosome exhibited a bimodal pattern (Supplemental Note S5), suggesting that DU145 has loci on the X Chromosome, which gained CNV. In order to validate these results we searched for such bimodality on the X Chromosome of the normal cell line H1, and indeed the results confirmed that the CNVs in DU145 are real. Out of 1577 loci with sufficient signal (signal exists in at least 10% of the samples) on the X Chromosome of cells from DU145, 340 loci (22%) exhibited multiallelic signal, whereas in the H1 cell line, only three out of 1625 loci (0.2%, P-value < 10−85, χ2 test of proportions) exhibited a biallelic signal (which is probably due to amplification noise or mispriming). CNVs may cause an ambiguity in the mutational calling score, as they may hamper the calling of MSs that originate from more than one allele. However, in the case of the ex vivo DU145 tree, the negative effect on the cell lineage reconstruction is attenuated due to the higher MS mutation rate of these cancer cells compared to normal cells (Boyer et al. 1995). Remarkably, the reconstructed ex vivo cell lineage tree was highly accurate in spite of these obstructions (Fig. 3).
Figure 3.

Reconstruction of the cancer ex vivo SC clone tree using the parameters that were calibrated using the simulations. (A) A schematic representation of the known cancer ex vivo SC clone tree. The numbers within the boxes indicate the number of single cells sampled from the specific subclone (total of 167 samples). (B,C) Close-up view of the indicated reconstructed subtrees. Edge colors in the reconstructed tree indicate statistically significant clustering as described in Shlush et al. (2012) and match the box colors of the subclones in A. Trees are drawn as ultrametric (all leaves are equidistant from the root) for clarity. The full, reconstructed tree can be found in Supplemental Figure S14. (D) Percentage of correct triples as a function of the length between the two MRCAs of the triple (see Supplemental Figs. S18, S19). The overall average score is 89%. (E) Correlation between the reconstructed cell depth, corresponding to the number of cell divisions from the root, and the subclone level.
In order to quantify the reconstruction accuracy, we employed a triples distance (Critchlow et al. 1996) approach (see Supplemental Fig. S18) and calculated the percentage of triples in the reconstructed tree that match the topology of the real tree. Since the tree consists of 167 leaves, there are possible triples. However, since we do not know the topology within SC clones, we considered only triples where each of the three leaves stem from different SC clones, of which there are 596,341 triples. Out of these triples, 89% had the correct structure, compared to 33% for a random reconstructed tree (the chance that a random triple will be correct). Furthermore, in order to observe a finer resolution, we divided the triples into groups according to the distance between the root and the branch of the triple. This distance corresponds to the common cell divisions of the pair of leaves emanating from the branch (Supplemental Fig. S19). It also correlates with the number of common unique mutations of that pair, which affects reconstruction accuracy of the triple. Figure 3D shows the percentage of correctly reconstructed triples as a function of this distance. Interestingly, when this distance is four SC clones or larger, the score is perfect, meaning that 100% of the triples are correctly reconstructed. It can also be seen that a distance of one clone achieves >80% accuracy and the distance of two clones is already higher than 90% (Fig. 3D). We note that there are few cell samples that contribute to failed triplets more than others; however, we could not find objective technical parameters that would allow us to identify and remove those cells.
The second aspect of the reconstruction accuracy is the estimated depth of the cells, corresponding to the number of cell divisions from the founding cell. Figure 3E shows the distribution of the reconstructed depth as a function of the SC clone depth in the generated tree.
Unbiased analysis of human cancerous and normal cells derived from a melanoma patient
In order to validate the reconstruction ability from in vivo samples taken from human patients, we first performed a multi-individual experiment in which SCs were taken from several individuals and were subjected to analysis in our platform (Fig. 4A). Reconstruction of the cell lineage tree generated the expected result of accurately separating the different individuals (Fig. 4B). We sought to test the platform utilizing a controlled known two-cell population structure. Cell samples were collected from both a metastasis and normal peripheral blood lymphocytes (PBL) of a single melanoma patient. Cells were then processed using our platform and were analyzed for their cell lineage tree (Fig. 4C,D). The reconstructed tree demonstrates an effective in vivo separation for two subpopulations, as expected.
Figure 4.

In vivo cell lineage tree reconstruction of human cells. To validate the reconstruction of human in vivo samples, we first selected single-cell samples from seven human individuals and distributed them among different AA chips. (A) Representation of different cell samples in 48-well batches (circles) in 14 AA chips, with colors indicating different source individuals. (B) As expected, cell lineage reconstruction of samples from A demonstrates accurate reconstruction of human samples in accordance with individual donors. The width of the colored branches represents the significance of the clustering, which was calculated using a hypergeometric test (wider = lower P-value) (see Supplemental Note S3). Branches are colored in accordance with the colors in A. The two bottom left samples of each AA chip correspond to a positive control (dark green) and negative control (pink). (C,D) Cell lineage reconstruction of melanoma and normal lymphocytes from the same patient (YUCLAT) (Krauthammer et al. 2015). (C) Same representation as in A: Metastatic melanoma (red) and normal PBL (blue) were randomly distributed over six AA chips. (D) Cell lineage reconstruction of samples from C demonstrates a perfect separation between the two cell populations. Arrows indicate a SC sample duplicate.
Validation and prediction of the cell lineage platform using computer simulations
In order to evaluate the future potential of the platform and predict how different parameters affect reconstruction accuracy, we performed computer simulations using eSTG (environmental-dependent Stochastic Tree Grammars) (Spiro et al. 2014), a dedicated formal programming/simulation language developed in our laboratory (see Supplemental Note S5 for the eSTG program definition). The eSTG program for generating the in silico cell lineage trees has three parameters:
The MS mutation rate r. As noted, the mutation rate ranges between 10−3–10−5 mutations per MS locus per cell division depending on various factors. We thus chose to simulate three mutation rate scales, namely: 10−3, 10−4, 10−5. The low mutation rate might correspond to short MSs of normal cells, whereas the fast mutation rate might correspond to cells harboring MSI. The middle mutation rate might correspond either to highly mutable long MSs of normal cells or to short MSs of MSI cells.
The signal modeling. Samples can vary in quality based on their source and the DNA extraction protocols. Loci can also vary in quality due to genomic location and amplification protocols. In order to capture the variability in signal quality both between the different loci and between the different samples, we employed a probabilistic model that assigns each individual locus L a probability pL of obtaining a signal from that locus and each sample S a probability qS of obtaining a signal from that sample, such that the probability of having a signal in locus L of sample S is pL·qS. Using simulated annealing, we estimated these probabilities from the ex vivo experiment and used them in the simulations (see Supplemental Note S4).
Noisy alleles, defined as the probability pnoise for each locus call to randomly shift by one repeat unit compared to the true value. The MS calling values can be incorrect due to random mutations inserted during the different DNA amplification stages. However, the number of alleles can also lead to erroneous calling. When using loci from normal male X or Y Chromosomes, there is only one allele, but in other cases there can be an ambiguity in the allele calling, for example, if there are several MS alleles that differ by one repeat unit and if only one of the alleles is amplified, it can be mistaken for a mutation. We thus simulated two scenarios of noisy alleles, one for normal cells and the other for cancerous cells with DNA aberrations and CNVs on all chromosomes. The calibrations were done using ex vivo experiments of both cancerous and normal cells as described in Supplemental Note S4 and in the Methods section.
We used the stepwise mutation model (SMM) for modeling MS mutations (Ohta and Kimura 2007). Our aim was to investigate the reconstruction accuracy across the parameter space. We used the same phylogenetic reconstruction algorithm for the in silico trees as used for the ex vivo trees. Figure 5 shows the triples distance score of the reconstructed tree as a function of the number of MS loci for the current signal quality as calculated using the ex vivo experiments and the presumed future signal quality assuming future protocol enhancements affecting both the quantity and the quality of the signal. Each panel shows the reconstruction performance of the three mutation rates, where the parameters for the fastest mutation rate were calculated using the cancer ex vivo tree and the parameters for the medium and low mutation rates were calculated using the normal ex vivo tree (see Supplemental Note S4). The variability among repeated simulations is indicated as the shaded colored area. Results show that, as expected, a panel of ∼2000 loci on cells with MSI can achieve around 90% reconstruction accuracy (see red mark on Fig. 5A). It can also be seen that increasing the panel to 50,000 loci greatly increases the reconstruction accuracy in the normal cells scenario.
Discussion
We have demonstrated both experimentally and by computer simulations the power of a high-throughput cell lineage analysis platform, which is generic, cost-effective, and scalable. It is generic because it does not rely on disease-related/patient-specific SNVs but rather utilizes endogenous MSs, which are neutral but have high mutation rates that serve as molecular clocks (Frumkin et al. 2005), and therefore can theoretically be used to reconstruct the cell lineage tree of a whole organism. Improving the reconstruction accuracy of the system requires further development. On the biochemical side, it requires increasing the MS panel size, improving technical signal quality by improved WGA, and optimizing the multiplex groups and targeted enrichment protocols in order to increase the percentage of reads that successfully align to target loci (see Fig. 5). On the computational side, it requires the development of optimized cell lineage tree reconstruction algorithms that take into account missing and noisy data. Nevertheless, here we provided a high resolution proof-of-concept for an unbiased generic lineage reconstruction using MSs only, utilizing a controlled ex vivo lineage tree with a limited number of divisions and in vivo cancer and normal cells from a melanoma patient. The scalability of this platform is demonstrated by two properties: (1) Scaling up the panel size: The addition of new primer pairs to an experiment, or even to a specific AA chip, is simple and automatic, enabling the researcher to rely on deep sequencing data to capture additional genomic regions of interest (e.g., disease-related/patient-specific genes or SNVs). Development of algorithmic tools that integrate different mutation types in cell lineage tree reconstruction is essential and will improve understanding of the different mutational profiles in health and disease. We also demonstrated the successful multiplex amplification with 43× amplicons per PCR reaction well (Supplemental Fig. S20) and showed feasibility for a size of 219× loci per reaction (Supplemental Note S6; Supplemental Fig. S21), suggesting a feasible future analysis of ∼10,000 (220 × 48) loci using the same molecular biology pipeline. This of course needs to be further validated in a larger experiment; nevertheless, even under any panel size constraint, we can append another primer panel in an additional AA chip run. (2) Scaling up the number of cells: The current platform enables a streamlined pipeline, which starts with isolation of SCs and ends up with a cell lineage tree. It integrates both a computer-controlled management of samples, the use of high-throughput devices (e.g., AA chip) and robotic automation, making the addition of cells to an experiment a simple task. The cost-effectiveness of the protocol is realized in the reduction of costs throughout the pipeline down to an estimated ∼$40 per cell (Supplemental Table S5). Examples include: (1) The AA chip allows for a complex PCR mixing of ∼2500 PCR reactions at a nanoliter volume scale, reducing the reagents costs; (2) barcoding the samples (using the second PCR dual indexing protocol), which creates the full-size NGS library, reduces the need for the purchase of costly reagents for standard library preparation and enables a reduction of primer purchase to a square-root of a single index protocol; and (3) pooling of hundreds of libraries using a novel iterated approach (Fig. 1B) has led to more equal representation of samples in an NGS sequencing run (Supplemental Fig. S6). This approach presents an effective read distribution between samples, which is essential when performing a highly multiplexed NGS run.
The previous platform (Reizel et al. 2011, 2012; Shlush et al. 2012) was based on small multiplex groups (4×) using fluorophores and different MS lengths in CE, similarly to the protocol used for forensic analysis. The platform presented here demonstrates an immense advancement over our previous lineage analysis platform:
1. Improved molecular biology workflow: Utilizing NGS analysis allows for improved preparative molecular biology protocols that result in a simplified workflow. This workflow enables an overall reduction in labor and higher throughput. For example: (1) The pooling of all amplicons and samples together with the ability to correctly annotate the sequenced reads with their targets (according to the MS flanking sequences) and to cells (according to the NGS library indexes). (2) The number of analyzed loci in our previous system was ∼130 compared to ∼2000 in the NGS-based platform. This is mainly due to highly multiplexed amplification and improved biochemistry (two-step PCR), which enables automated pooling of all amplicons (not limited to 16 amplicons per CE reaction). As we demonstrate by computer simulations, the increased number of loci directly affects the reconstruction accuracy (Fig. 5). (3) Single use of template as starting material (1–2 µL of WGA product taken to the AA chip amplification of 2000) instead of 32 off-chip reactions (4×) enables a reduction of the starting material. The reduced starting material allows for future calibration of the WGA protocols in order to reduce amplification steps, thus reducing noisy signal. (4) Decreased sample processing period. The time from DNA to signal was reduced from 72 h for 24 samples to ∼14 workdays for 480 cells. For comparison, in this 14-d period, the previous system could produce signal only for ∼140 cells. (5) The current system design also enables a much easier and simpler scalability in the number of analyzed loci. Increasing the number of loci requires ordering additional primers according to an existing design, whereas the previous platform required calibration of different amplicon sizes and fluorophores.
2. Cost: Although our previous system was automated, it was limited by the biochemistry that required mass amounts of starting DNA as template for 32 multiplex (4×) reactions per cell, to be analyzed by CE. Hence, reagents (PCR reagents, fluorescent primers, Liz 500, and formamide) and consumables (PCR plates) were the main cost contributors in the previous platform, which cost ∼$100 per cell. The main costs in the current platform are AA chips and NGS, because the primers are not modified or purified (although large in size, ∼45-mer) and are purchased only once (due to the use of nanoliter PCR reaction volumes). More important, the cost per locus changed dramatically by 38-fold, from ∼$0.76 per amplicon in our previous platform to $0.02 per amplicon in the current platform.
3. Precision: Utilizing NGS instead of CE data enables a better understanding of the actual sequence of each and every analyzed molecule, making the mutation calling direct and not inferred by size.
4. Analysis: MS calling in the previous system was done manually by visually marking the highest peak of the MS stutter histogram, whereas the current system performs this task automatically using a calling algorithm (Supplemental Note S3).
Our platform presents a cost-effective solution for lineage reconstruction without the need for prior knowledge of the tissue/patient mutations or mutation distribution. This is achieved mainly by the utilization of high-throughput and microfluidics-based technologies and by utilization of MSs, which present a high mutation rate in vivo (Table 1 presents a comparison with other methods). Although cost reduction has been substantial in recent years, the cost for whole-genome sequencing (WGS) at 30× coverage is ∼$1200 (https://www.genome.gov/sequencingcostsdata/, accessed February 22, 2016). SC low-depth WGS might enable the analysis of CNVs; however, it is biased toward cancer lineage analysis (as CNVs are typically related to cancer), and even under 5× coverage ($200 per cell), it is not scalable for a large number of cells. We also note that, unlike targeted enrichment, current WGS protocols do not cope well with the analysis of MSs, because random shearing may split the MS and therefore a higher depth would be required. Due to the high cost and low efficiency of SC WGS, some also validate their findings using bulk analysis in order to detect the distribution of mutations in the population (Evrony et al. 2015). Another method for lineage analysis utilizes bulk whole-genome (or -exome) sequencing in order to detect patient-/tumor-specific putative genomic variants, followed by custom targeted enrichment (Gawad et al. 2014; Lohr et al. 2014). The mutations found in these methods are highly effective as targeting candidates as they provide a patient-specific signal, which differs between cells with a high precision. However, this makes them affordable per cell only if many cells are to be analyzed, and since they are not generic, they are not scalable for the analysis of many patients. As previously described, the flexibility of our automated multiplex group generation allows for easy incorporation of any genomic region of interest (e.g., SNVs, disease-related genes, mutations which were found in WGS), making the system a flexible genotyping platform limited only by read length (which can also be accommodated by increasing the number of amplicons per region).
The basic elements of the molecular biology pipeline are quite standard and require a two-step amplification that outputs NGS libraries (see Methods and Supplemental Figs. S1, S2). We have validated their success manually, off-chip (data not shown). However, in a large-scale experiment scope (namely many targets and samples), it becomes laborious, time-consuming, and costly. With the understanding that this platform requires expensive instrumentation and operating skills, we envision the cell lineage platform as part of a central service or a core facility to which cell samples from collaborators will be sent and analyzed. This will eliminate the need for specific instrumentations and manpower experience (both laboratory skills and bioinformatics skills) and will allow the collaborators to concentrate on the biological questions and sample collection.
Currently, our MS panel mainly targets loci on the X Chromosome to enable confident MS calling in male samples (see Methods). One of the major bioinformatics challenges is the bi- or multiallelic MSs generated from autosomal chromosomes, the X Chromosome in females, or from CNV regions. The first two can be overcome by either longer reads, which may detect allele-specific SNVs, or by detection of two distinct MS sizes, which can be annotated to a specific allele for each analyzed cell. CNVs pose a harder challenge, as they are in fact a duplication of the exact locus and therefore may have a closer MS signal and a similar flanking region. Utilization of unique molecular identifiers (UMIs) (Carlson et al. 2015) may reduce the generated noise; however, due to the need for SC WGA, a background noise will remain. Future plans focus on improving the MS calling algorithm to input non-X and CNV loci, thus increasing the platform accuracy for both normal cells and specifically for cancer cells which exhibit substantial CNVs (Navin et al. 2011). Interestingly, our results from the ex vivo tree validation suggest that cancer analysis presents a trade-off: Although CNVs may hamper the accuracy of the MS calling, the high mutation rate in these cells generates a distinct signal that enables tracking of the cell lineage accurately. Better understanding of CNV mutational processes would allow for improved analysis.
We acknowledge the fact that when scaling our platform to include tens of thousands of targets as discussed above (Fig. 5), primer costs become a significant cost factor. In addition, it would require much larger multiplex groups and/or utilization of additional AA chips, which also increases the cost per cell. Our future development is focused mainly on development and improving targeted enrichment one-pot multiplexed reactions, such as molecular inversion probes (MIP) or targeted capture (Leung et al. 2016), in which per-probe cost is significantly lower due to multiplexed synthesis in advanced microarray technologies. MIPs were previously validated for low-scale MS analysis (Carlson et al. 2015) and for a large number of targets (Li et al. 2009), proving the feasibility of such protocols for massive MS analysis from SC WGA products. MIPs also allow for a precise targeting, rather than random shearing, which can split the MS sequence, as previously discussed.
Notably, we and others have generated data from ex vivo grown cell cultures (Frumkin et al. 2005; Carlson et al. 2012; Reizel et al. 2012; Zong et al. 2012). Here we demonstrated the first large-scale SC ex vivo tree in the sense that tens of SC clones were used for generating the tree and hundreds of SCs were used for analysis. Analysis of DNA from both cancerous and normal ex vivo cell lineage trees may serve as a high-resolution tool for better understanding the mutational processes and profiles of multiple genomic regions at a resolution of few replications, in health and disease. Such understanding can help create better panels for targeted sequencing (including loci other than MS) (see Table 1) and drive algorithm development.
The number of cell divisions has a great impact on the cell lineage reconstruction accuracy since genome replication flaws (i.e., somatic mutations) during cell divisions are effectively the “tool” that generates the analyzed signal. In human, cells undergo ∼50 divisions after formation of the zygote; however, this number may vary greatly between different organs (Hayflick 1965). In cancer, the number of cell divisions from the founder cell is still an open question; however, estimates range from 32 divisions for a 1-cm3-sized tumor (size-based calculation) (Friberg and Mattson 1997) to 280 divisions in a colorectal tumor (Tsao et al. 2000). We believe that a size-based estimation gives only a lower bound to the maximum number of cell divisions since it implies that the cancer cell lineage tree is an unbiased binary tree. In our ex vivo tree experiment, we estimate that there are roughly 12–15 cell divisions from SC to final clone (before recloning iteration). The results of the ex vivo tree reconstruction implies that the cells have a similar microsatellite mutation rate as that of MSI cancers (10−3 mutations per locus per division, as validated using the simulation results) (see Fig. 5A); hence it presents an analog to certain in vivo cancer tumor developments. However, it should be noted that it is different than an in vivo tumor by many properties (e.g., initiated by a cell line and not by direct primary cells, grown in culture without the intratumor environment, etc.). To summarize, the estimated number of cell divisions from the MRCA of two cell populations should be taken into consideration when planning a cell lineage experiment since it may greatly affect the reconstruction efficiency (see Fig. 3D).
Further improvements in integrated SC sequencing-based technologies, such as genomics and transcriptomics (Dey et al. 2015; Macaulay et al. 2015) and genomics and epigenomics (Smallwood et al. 2014; Buenrostro et al. 2015) would add layers of information for each and every cell in the reconstructed cell lineage tree and would help with understanding the underlying dynamics of the biological process. In conclusion, our platform serves as a prototype which lays the biological, computational, and architectural foundations for an envisioned large-scale human cell lineage discovery project.
Methods
Cancer ex vivo tree generation experiment
The DU145 human prostate cancer cell line, derived from brain metastasis, was obtained from the National Cancer Institute (NCI). Cells were cultured in RPMI medium (Gibco) supplemented with 10% FBS (Biological Industries), and 2 mM L-Glutamine (Biological Industries). Prior to the SC picking, cells were detached and dissociated by using 0.25% Tripsin-EDTA (Biological Industries) followed by pull-down and resuspension in growth medium. The cells were then transferred to tissue culture (TC) plates and put aside for a few minutes in order to enable them to land on the plate bottom for further visualization and immediate picking. SCs were picked via the CellCelector (ALS) using a 50-µm-diameter capillary into either 96-well culture plates containing 50 μL growth medium per well for 2 wk clonal expansion or into 96-well PCR plates containing 5 μL PBS per well for subsequent WGA (Fig. 2A,B, respectively). WGA was performed immediately after cell deposition or after plate storage at −20°C. The estimated number of cell divisions after 2 wk is ∼12–15.
Normal ex vivo clone generation experiment
H1 human ES cells (WA01) were obtained from the WiCell Research Institute. Cells were first cultured on mitotically inactivated mouse embryonic fibroblasts (iMEFs) in hESC medium (DMEM/F-12[HAM] [Biological Industries], 20% KnockOut Serum Replacement [Gibco], 1% MEM nonessential amino acids [Biological Industries], 2 mM L-Glutamine [Biological Industries], 0.1 mM 2-mercaptoethanol [Gibco], 8 ng/mL bFGF [Peprotech]), and passaged using 1 mg/mL Collagenase IV (Worthington) every 3–4 d.
As a preparation for the picking procedure, cells were cultured on GFR Matrigel (BD) in iMEF conditioned hESC medium (CM) for 4 d. Prior to SC picking, cells were detached and dissociated by using 0.25% Tripsin-EDTA (Biological Industries) incubation for 3 min followed by pull-down and resuspension in CM. Transfer to TC plates and the SC picking procedure were as described above for DU145 cells with the exception of using a 96-well culture plate precoated with Matrigel and containing 100 μL CM per well.
During the two weeks, clonal expansion medium was changed after the initial 6 d and then every second day. We estimate the number of cell divisions after 2 wk was ∼15.
In order to insure cell survival, 10 µM ROCK Inhibitor (Axon Medchem) was added to the cells 1 h prior to trypsinization, during the SC picking and during clonal expansion.
Cell lineage reconstruction from a melanoma patient
YUCLAT (Krauthammer et al. 2015) metastatic melanoma (right axilla) and blood were sampled from a 64-yr-old male patient. The samples were collected by the Tissue Resource Core of the Yale SPORE in Skin Cancer with the participant's signed informed consent according to Health Insurance Portability and Accountability Act (HIPAA) regulations with a Human Investigative Committee protocol as described (Krauthammer et al. 2015). Peripheral blood lymphocytes (PBL) were isolated from blood obtained 2 mo after tumor excision. The metastatic melanoma cells were grown in OptiMEM (Invitrogen) supplemented with antibiotics and 5% fetal calf serum. Cells were kept frozen in fetal bovine serum (FBS) supplemented with 5% DMSO.
Isolation of metastatic SCs was done using the CellCelector as described above. Isolation of single lymphocytes from the peripheral blood was done manually as follows: Aliquots of 0.5 µL were spread on a flat-bottom 96-well plate (Costar 3596, Corning) and observed under the microscope. Drops that contained SCs were collected into 0.2 mL tubes. Cells from both populations were subjected to WGA.
Cell lineage platform processing
The main procedures in the platform are described here. The full pipeline is depicted in Supplemental Figure S1, and the robotic adaptation is elaborated in Supplemental Note S2.
Whole-genome amplification (WGA)
WGA was applied to SCs either immediately after cell deposition or after storage at −20°C. Spin down or centrifugation at 4500 rpm for 5 min was applied to test tubes or 96-well plates containing SCs, respectively. WGA was performed using REPLI-g Mini kit (Qiagen) with a modified protocol: 3.5 µL of buffer D2 was added, and cells were lysed on ice for 10 min. Following addition of 3.5 µL stop buffer and centrifugation at 4500 rpm for 5 min, 20 µL of mix containing Buffer REPLI-g and Polymerase REPLI-g (at the same proportions as recommended in the manual) was added, and the sample was incubated at 30°C for 16 h. A multiplex diagnostic PCR targeting four genomic regions of different lengths was used as a WGA success test. A single band in a 1.5% agarose gel was sufficient to flag the sample as positive for subsequent Access Array analysis.
Primers and multiplex PCR design
Target-specific primers were designed by Primer3 (Untergasser et al. 2012) and ordered from IDT. Since the MS mutation rate in vivo is dependent both on the repeat sequence (mono- and di-repeats are highly mutable) and the number of repeats (long stretches of repeats are more mutable) (Ellegren 2004), we designed primers that target the longest MSs of mainly AC type. Most of the primers target the X Chromosome in order to reduce the noise of biallelic MS calls in male genomes and to eliminate the need to haplotype autosomal MSs in cases of allele drop-out. Amplicons were designed to cover the entire MS plus at least 5 nucleotides (nt) from both reads, in a 2 × 150-bp sequencing run. Specifically, the sizes of the MS targets in our panel range from 8 to 98 bp, with a median size of 38 bp. To increase primer cost-effectiveness, ∼21% of our primers amplified more than one MS target (up to 8 MS targets per amplicon). Merging of these reads also allows for MS calling improvement. Other primers that target other genomic regions (SNVs) were also designed and were mainly used as a feasibility test for a large multiplex validation (Supplemental Fig. S21). Primers were assigned to 48 multiplex groups by an in-house algorithm, which assigns a specified set of primer pairs that target regions separated by at least 10 kbp. Each primer contains a prefix of a universal sequence that constitutes a part of the Illumina sequencing primers: Fwd primer 5′ tail: CTACACGA CGCTCTTCCGATCT; Rev primer 5′ tail: CAGACGTGTGCTCT TCCGATCT. MS targets, their corresponding primer sequences, and their multiplex groups are listed in Supplemental Table S2.
Microfluidic-based targeted enrichment
Targeted enrichment of genomic loci was performed using Access Array (AA, Fluidigm) in accordance with the AA guidelines with noted exceptions: Primer pooling to multiplex groups composed of up to 47× primer pairs was done using a liquid handling robot (Evoware, Tecan) (Supplemental Note S2), using a script generated according to the specified multiplex design algorithm. Final addition of 20× Access Array Loading Reagent (Fluidigm, PN 100-0883) was performed to retrieve a final primer concentration of 1 µM and 1× Access Array Loading Reagent. However, the >47× multiplex groups were manually composed by addition of equal volumes of primers with an initial 50 µM primer concentration and with the final addition of 20× Access Array Loading Reagent to the mixture to retrieve a final concentration of 1× Access Array Loading Reagent. In order to reduce overamplification, PCR amplification on the Access Array was performed using the initial 30 amplification steps of the recommended run protocol “AA 48×48 Standard v1.” To enable a control over each chip and to track potential contaminations, each Access Array chip carried two control slots for 50 ng/µL Jurkat genomic DNA (NEB) and water as positive and negative controls, respectively. WGA samples were randomly and automatically inserted into the PCR reaction mix without a prior purification step (Evoware, Tecan) (Supplemental Note S2).
PCR purification
Water was added prior to each purification reaction to reduce liquid handling errors during the purification step: 10 µL or 70 µL for manual and automatic purification, respectively. A 1× volume of Agencourt AMPure XP SPRI magnetic beads (Beckman Coulter) was used to purify the sample from residual enzyme, nucleotides, and primer dimers traces, according to the recommended protocol. This process was done either manually on a DynaMag-96 Side Skirted Magnet (Life Technologies) or automatically, using a robot (Evoware, Tecan) (Supplemental Note S2) and a Magnum FLX magnetic plate (Alpaqua).
Library preparation and sample-specific barcoding
Following dilution of the purified PCR from the first PCR (1:100), sample-specific barcoding was performed using standard PCR with forward and reverse primer combinations (Sigma). The indexes within the primer sequences and their dual combination annotated the original SC samples and produced a ready-to-run TruSeq HT NGS library using the standard Illumina sequences. Primer sequences are as follows: Fwd primer: AATGATACGGCGACCACC GAGATCTACAC[Fw_Index_D5XX]ACACTCTTTCCCTACACGAC GCTCTTCCG; Rev primer: CAAGCAGAAGACGGCATACGAGAT[Rev_Index_D7XX]GTGACTGGAGTTCAGACGTGTGCTCTTCCG; where square brackets indicate sequencing indexes (Supplemental Table S3; Supplemental Fig. S4). PCR was performed using Q5 High-Fidelity DNA Polymerase (M0491S, NEB) in a real-time PCR machine (LC480, Roche). PCR mix was according to the recommended protocol, with the addition of SYBR green I (Lonza) at a final reaction of 0.5× that was used to track amplification and to prevent overcycling. The reaction protocol was 95°C for 2 min, followed by five amplification steps of 95°C for 30 sec, 56°C for 30 sec, and 72°C for 30 sec; and 12 amplification steps of 95°C for 30 sec and 72°C for 1 min. Final elongation was performed at 72°C for 10 min. PCR reactions were purified using 0.8× vol of Agencourt AMPure XP beads according to the above-mentioned protocol.
Concentration measurement and preparation for sample pooling
Including the addition of Illumina adapters and indexes (136 bp), libraries range between 200 and 400 bp, with a mean of 303 bp (with a standard deviation of 37 bp). Library sizes are presumed equal for all analyzed cells, since the same PCR primers panel was used for every sample. Hence, sample concentration determines molarity, and can be used to predict the reads distribution in a NGS run. Therefore, all samples are measured for concentration and are equalized to the same concentration before sample pooling.
Concentration of each sample was measured using the Qubit dsDNA HS Assay Kit (Life Technologies) in a flat-bottom 96-well plate (655180, Greinier) using a plate reader (infinite 200, Tecan), using the following parameters: excitation wavelength: 486 nm, emission wavelength: 528 nm.
To prepare for sample pooling and multiplexing, libraries were automatically diluted and normalized to the same minimal equal concentration (Supplemental Note S2). Samples were automatically transferred to an Echo Qualified 384-well plate (LP-0200, Labcyte) using a robot (Bravo, Agilent).
Sample pooling and sequencing
Sample pooling was done using the cherry pick application of the Echo550 (Labcyte). Pooling was done using equal volume. Library pool purification and concentration was performed (Minelute, Qiagen). This process also removes all traces of SYBR green from the second PCR. Samples were processed by a size selection of sizes 200–500 bp (2% gel, BluePippin, Sage Science). The product was concentrated again (Minelute) and was sent for 2 × 220-bp low-coverage sequencing (Miseq, Illumina). Following analysis, another iteration of pooling was performed according to (1) selection of qualified DNA libraries and (2) normalization of volumes to achieve an expected number of a successful read distribution (see criteria above). Negative controls are pooled at the average volume of all samples. The library pool passed the same concentration and selection processes as before, and samples were sent for 2 × 150-bp high-throughput sequencing (NextSeq 500, Illumina) that generated sequencing data for data analysis and cell lineage reconstruction.
Data analysis and cell lineage analysis reconstruction
The computational data analysis (Supplemental Note S3) started with raw sequencing data processing using cutadapt (https://cutadapt.readthedocs.io/en/stable/), and paired-end reads were merged using PEAR (Zhang et al. 2014). Following the merging, reads were uniquely mapped to their target using read alignment of only the read's edges corresponding to the primer pairs. MS length was then determined by aligning the read to references containing a range of MS lengths and choosing the reference length with the highest alignment score. By combining all reads from a SC that are mapped to a specific target, we get a lengths histogram, which is a result of a well-known MS stutter artifact caused by DNA amplification. Following the MS calling (Supplemental Note S3), a mutation table, which consists of all samples and all loci, was generated and was expanded to enable multiple allele signals from any given cell. This mutation table was then used for the tree reconstruction using the neighbor-joining algorithm with the absolute distance function. In this work, most of the MSs that were used for the analysis are of type AC.
Data access
Mutation tables and sequencing data generated in this study have been submitted to ArrayExpress (www.ebi.ac.uk/arrayexpress) under accession number E-MTAB-4553.
Supplementary Material
Acknowledgments
We thank our collaborators Dr. V.A. Adalsteinsson from the MIT laboratory of Professor J.C. Love, Dr. L. Shlush from the Toronto University laboratory of Professor J.E. Dick, Professor C. Wu at the Broad Institute, and Professor C. Klein at Regensburg University for providing us with SC genomic DNA samples, thus supporting the individual's cell lineage tree experiment (Fig. 4). We thank Dr. D. Pilzer for performing Access Array runs, and T. Wiesel and A. Hendler for the prompt and excellent preparation and design of figures. This research was supported by the following foundations: the European Union FP7-ERC-AdG (European Research Council, 233047); The EU-H2020-ERC-AdG (European Research Council, 670535); the Deutsche Forschungsgemeinschaft (DFG, 611042); the Israeli Science Foundation (ISF, P14587); the Israeli Science Foundation-BROAD (ISF, P15439); the National Institutes of Health (VUMC 38347); and the Kenneth and Sally Leafman Appelbaum Discovery Fund. Ehud Shapiro is the incumbent of The Harry Weinrebe Professorial Chair of Computer Science and Biology.
Footnotes
[Supplemental material is available for this article.]
Article published online before print. Article, supplemental material, and publication date are at http://www.genome.org/cgi/doi/10.1101/gr.202903.115.
References
- Boyer JC, Umar A, Risinger JI, Lipford JR, Kane M, Yin S, Barrett JC, Kolodner RD, Kunkel TA. 1995. Microsatellite instability, mismatch repair deficiency, and genetic defects in human cancer cell lines. Cancer Res 55: 6063–6070. [PubMed] [Google Scholar]
- Buenrostro JD, Wu B, Litzenburger UM, Ruff D, Gonzales ML, Snyder MP, Chang HY, Greenleaf WJ. 2015. Single-cell chromatin accessibility reveals principles of regulatory variation. Nature 523: 486–490. [DOI] [PMC free article] [PubMed] [Google Scholar]
- Cai X, Evrony GD, Lehmann HS, Elhosary PC, Mehta BK, Poduri A, Walsh CA. 2014. Single-cell, genome-wide sequencing identifies clonal somatic copy-number variation in the human brain. Cell Rep 8: 1280–1289. [DOI] [PMC free article] [PubMed] [Google Scholar]
- Carlson C, Kas A, Kirkwood R, Hays L, Preston B, Salipante S, Horwitz M. 2012. Decoding cell lineage from acquired mutations using arbitrary deep sequencing. Nat Methods 9: 78–80. [DOI] [PMC free article] [PubMed] [Google Scholar]
- Carlson KD, Sudmant PH, Press MO, Eichler EE, Shendure J, Queitsch C. 2015. MIPSTR: a method for multiplex genotyping of germline and somatic STR variation across many individuals. Genome Res 25: 750–761. [DOI] [PMC free article] [PubMed] [Google Scholar]
- Critchlow DE, Pearl DK, Qian C. 1996. The triples distance for rooted bifurcating phylogenetic trees. Syst Biol 45: 323–334. [Google Scholar]
- Dey SS, Kester L, Spanjaard B, Bienko M, van Oudenaarden A. 2015. Integrated genome and transcriptome sequencing of the same cell. Nat Biotechnol 33: 285–289. [DOI] [PMC free article] [PubMed] [Google Scholar]
- Ding L, Ley T, Larson D, Miller C, Koboldt D, Welch J, Ritchey J, Young M, Lamprecht T, McLellan M, et al. 2012. Clonal evolution in relapsed acute myeloid leukaemia revealed by whole-genome sequencing. Nature 481: 506–510. [DOI] [PMC free article] [PubMed] [Google Scholar]
- Ellegren H. 2004. Microsatellites: simple sequences with complex evolution. Nat Rev Genet 5: 435–445. [DOI] [PubMed] [Google Scholar]
- Evrony GD, Cai X, Lee E, Hills LB, Elhosary PC, Lehmann HS, Parker JJ, Atabay KD, Gilmore EC, Poduri A, et al. 2012. Single-neuron sequencing analysis of L1 retrotransposition and somatic mutation in the human brain. Cell 151: 483–496. [DOI] [PMC free article] [PubMed] [Google Scholar]
- Evrony GD, Lee E, Mehta BK, Benjamini Y, Johnson RM, Cai X, Yang L, Haseley P, Lehmann HS, Park PJ, et al. 2015. Cell lineage analysis in human brain using endogenous retroelements. Neuron 85: 49–59. [DOI] [PMC free article] [PubMed] [Google Scholar]
- Friberg S, Mattson S. 1997. On the growth rates of human malignant tumors: implications for medical decision making. J Surg Oncol 65: 284–297. [DOI] [PubMed] [Google Scholar]
- Frumkin D, Wasserstrom A, Kaplan S, Feige U, Shapiro E. 2005. Genomic variability within an organism exposes its cell lineage tree. PLoS Comput Biol 1: 382–394. [DOI] [PMC free article] [PubMed] [Google Scholar]
- Frumkin D, Wasserstrom A, Itzkovitz S, Stern T, Harmelin A, Eilam R, Rechavi G, Shapiro E. 2008. Cell lineage analysis of a mouse tumor. Cancer Res 68: 5924–5931. [DOI] [PubMed] [Google Scholar]
- Gawad C, Koh W, Quake SR. 2014. Dissecting the clonal origins of childhood acute lymphoblastic leukemia by single-cell genomics. Proc Natl Acad Sci 111: 17947–17952. [DOI] [PMC free article] [PubMed] [Google Scholar]
- Hayflick L. 1965. The limited in vitro lifetime of human diploid cell strains. Exp Cell Res 37: 614–636. [DOI] [PubMed] [Google Scholar]
- Hou Y, Song L, Zhu P, Zhang B, Tao Y, Xu X, Li F, Wu K, Liang J, Shao D, et al. 2012. Single-cell exome sequencing and monoclonal evolution of a JAK2-negative myeloproliferative neoplasm. Cell 148: 873–885. [DOI] [PubMed] [Google Scholar]
- Krauthammer M, Kong Y, Bacchiocchi A, Evans P, Pornputtapong N, Wu C, McCusker JP, Ma S, Cheng E, Straub R, et al. 2015. Exome sequencing identifies recurrent mutations in NF1 and RASopathy genes in sun-exposed melanomas. Nat Genet 47: 996–1002. [DOI] [PMC free article] [PubMed] [Google Scholar]
- Kretzschmar K, Watt FM. 2012. Lineage tracing. Cell 148: 33–45. [DOI] [PubMed] [Google Scholar]
- Leung ML, Wang Y, Kim C, Gao R, Jiang J, Sei E, Navin NE. 2016. Highly multiplexed targeted DNA sequencing from single nuclei. Nat Protoc 11: 214–235. [DOI] [PMC free article] [PubMed] [Google Scholar]
- Li J, Gao Y, Aach J, Zhang K, Kryukov G, Xie B, Ahlford A, Yoon J, Rosenbaum A, Zaranek A, et al. 2009. Multiplex padlock targeted sequencing reveals human hypermutable CpG variations. Genome Res 19: 1606–1615. [DOI] [PMC free article] [PubMed] [Google Scholar]
- Lodato MA, Woodworth MB, Lee S, Evrony GD, Mehta BK, Karger A, Chittenden TW, D'Gama AM, Cai X, Luquette LJ, et al. 2015. Somatic mutation in single human neurons tracks developmental and transcriptional history. Science 350: 94–98. [DOI] [PMC free article] [PubMed] [Google Scholar]
- Lohr JG, Adalsteinsson VA, Cibulskis K, Choudhury AD, Rosenberg M, Cruz-Gordillo P, Francis JM, Zhang C-Z, Shalek AK, Satija R, et al. 2014. Whole-exome sequencing of circulating tumor cells provides a window into metastatic prostate cancer. Nat Biotechnol 32: 479–484. [DOI] [PMC free article] [PubMed] [Google Scholar]
- Lu R, Neff N, Quake S, Weissman I. 2011. Tracking single hematopoietic stem cells in vivo using high-throughput sequencing in conjunction with viral genetic barcoding. Nat Biotechnol 29: 928–933. [DOI] [PMC free article] [PubMed] [Google Scholar]
- Macaulay IC, Haerty W, Kumar P, Li YI, Hu TX, Teng MJ, Goolam M, Saurat N, Coupland P, Shirley LM, et al. 2015. G&T-seq: parallel sequencing of single-cell genomes and transcriptomes. Nat Methods 12: 519–522. [DOI] [PubMed] [Google Scholar]
- Navin N, Kendall J, Troge J, Andrews P, Rodgers L, McIndoo J, Cook K, Stepansky A, Levy D, Esposito D, et al. 2011. Tumour evolution inferred by single-cell sequencing. Nature 472: 90–94. [DOI] [PMC free article] [PubMed] [Google Scholar]
- Ohta T, Kimura M. 2007. A model of mutation appropriate to estimate the number of electrophoretically detectable alleles in a finite population*. Genet Res 89: 367–370. [DOI] [PubMed] [Google Scholar]
- Reizel Y, Chapal-Ilani N, Adar R, Itzkovitz S, Elbaz J, Maruvka Y, Segev E, Shlush L, Dekel N, Shapiro E. 2011. Colon stem cell and crypt dynamics exposed by cell lineage reconstruction. PLoS Genet 7: e1002192. [DOI] [PMC free article] [PubMed] [Google Scholar]
- Reizel Y, Itzkovitz S, Rivka A, Elbaz J, Jinich A, Chapal-Ilani N, Maruvka Y, Nevo N, Marx Z, Horovitz I, et al. 2012. Cell lineage analysis of the mammalian female germline. PLoS Genet 8: e1002477. [DOI] [PMC free article] [PubMed] [Google Scholar]
- Salipante SJ, Kas A, McMonagle E, Horwitz MS. 2010. Phylogenetic analysis of developmental and postnatal mouse cell lineages. Evol Dev 12: 84–94. [DOI] [PMC free article] [PubMed] [Google Scholar]
- Segev E, Shefer G, Adar R, Chapal-Ilani N, Itzkovitz S, Horovitz I, Reizel Y, Benayahu D, Shapiro E. 2011. Muscle-bound primordial stem cells give rise to myofiber-associated myogenic and non-myogenic progenitors. PLoS One 6: e25605. [DOI] [PMC free article] [PubMed] [Google Scholar]
- Shapiro E, Biezuner T, Linnarsson S. 2013. Single-cell sequencing-based technologies will revolutionize whole-organism science. Nat Rev Genet 14: 618–630. [DOI] [PubMed] [Google Scholar]
- Shlush LI, Chapal-Ilani N, Adar R, Pery N, Maruvka Y, Spiro A, Shouval R, Rowe JM, Tzukerman M, Bercovich D, et al. 2012. Cell lineage analysis of acute leukemia relapse uncovers the role of replication-rate heterogeneity and miscrosatellite instability. Blood 120: 603–612. [DOI] [PubMed] [Google Scholar]
- Smallwood SA, Lee HJ, Angermueller C, Krueger F, Saadeh H, Peat J, Andrews SR, Stegle O, Reik W, Kelsey G. 2014. Single-cell genome-wide bisulfite sequencing for assessing epigenetic heterogeneity. Nat Methods 11: 817–820. [DOI] [PMC free article] [PubMed] [Google Scholar]
- Spiro A, Cardelli L, Shapiro E. 2014. Lineage grammars: describing, simulating and analyzing population dynamics. BMC Bioinformatics 15: 249. [DOI] [PMC free article] [PubMed] [Google Scholar]
- Tsao JL, Yatabe Y, Salovaara R, Järvinen HJ, Mecklin JP, Aaltonen LA, Tavaré S, Shibata D. 2000. Genetic reconstruction of individual colorectal tumor histories. Proc Natl Acad Sci 97: 1236–1241. [DOI] [PMC free article] [PubMed] [Google Scholar]
- Untergasser A, Cutcutache I, Koressaar T, Ye J, Faircloth BC, Remm M, Rozen SG. 2012. Primer3—new capabilities and interfaces. Nucleic Acids Res 40: e115. [DOI] [PMC free article] [PubMed] [Google Scholar]
- Wang J, Fan HC, Behr B, Quake SR. 2012. Genome-wide single-cell analysis of recombination activity and de novo mutation rates in human sperm. Cell 150: 402–412. [DOI] [PMC free article] [PubMed] [Google Scholar]
- Wang Y, Waters J, Leung ML, Unruh A, Roh W, Shi X, Chen K, Scheet P, Vattathil S, Liang H, et al. 2014. Clonal evolution in breast cancer revealed by single nucleus genome sequencing. Nature 512: 155–160. [DOI] [PMC free article] [PubMed] [Google Scholar]
- Wasserstrom A, Adar R, Shefer G, Frumkin D, Itzkovitz S, Stern T, Shur I, Zangi L, Kaplan S, Harmelin A, et al. 2008. Reconstruction of cell lineage trees in mice. PLoS One 3: e1939. [DOI] [PMC free article] [PubMed] [Google Scholar]
- Willems T, Gymrek M, Poznik GD, Tyler-Smith C; The 1000 Genomes Project Chromosome Y Group, Erlich Y. 2016. Population-scale sequencing data enable precise estimates of Y-STR mutation rates. Am J Hum Genet 98: 919–933. [DOI] [PMC free article] [PubMed] [Google Scholar]
- Xu X, Hou Y, Yin X, Bao L, Tang A, Song L, Li F, Tsang S, Wu K, Wu H, et al. 2012. Single-cell exome sequencing reveals single-nucleotide mutation characteristics of a kidney tumor. Cell 148: 886–895. [DOI] [PMC free article] [PubMed] [Google Scholar]
- Zhang F, Gu W, Hurles ME, Lupski JR. 2009. Copy number variation in human health, disease, and evolution. Annu Rev Genomics Hum Genet 10: 451–481. [DOI] [PMC free article] [PubMed] [Google Scholar]
- Zhang J, Kobert K, Flouri T, Stamatakis A. 2014. PEAR: a fast and accurate Illumina Paired-End reAd mergeR. Bioinformatics 30: 614–620. [DOI] [PMC free article] [PubMed] [Google Scholar]
- Zong C, Lu S, Chapman AR, Xie XS. 2012. Genome-wide detection of single-nucleotide and copy-number variations of a single human cell. Science 338: 1622–1626. [DOI] [PMC free article] [PubMed] [Google Scholar]
Associated Data
This section collects any data citations, data availability statements, or supplementary materials included in this article.