Abstract
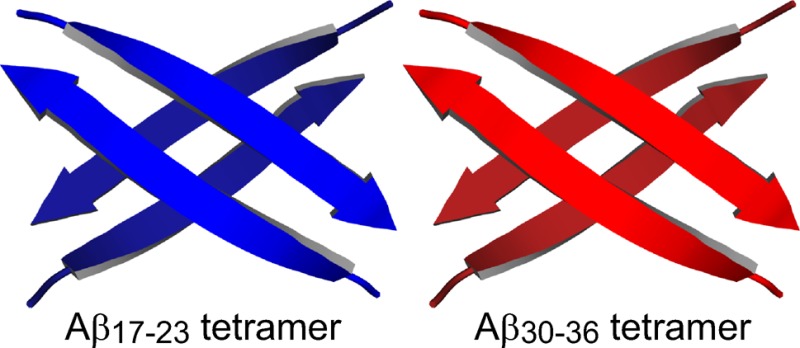
In Alzheimer’s disease, aggregation of the β-amyloid peptide (Aβ) results in the formation of oligomers and fibrils that are associated with neurodegeneration. Aggregation of Aβ occurs through interactions between different regions of the peptide. This paper and the accompanying paper constitute a two-part investigation of two key regions of Aβ: the central region and the C-terminal region. These two regions promote aggregation and adopt β-sheet structure in the fibrils, and may also do so in the oligomers. In this paper, we study the assembly of macrocyclic β-sheet peptides that contain residues 17–23 (LVFFAED) from the central region and residues 30–36 (AIIGLMV) from the C-terminal region. These peptides assemble to form tetramers. Each tetramer consists of two hydrogen-bonded dimers that pack through hydrophobic interactions in a sandwich-like fashion. Incorporation of a single 15N isotopic label into each peptide provides a spectroscopic probe with which to elucidate the β-sheet assembly and interaction: 1H,15N HSQC studies facilitate the identification of the monomers and tetramers; 15N-edited NOESY studies corroborate the pairing of the dimers within the tetramers. In the following paper, J. Am. Chem. Soc.2016, DOI: 10.1021/jacs.6b06001, we will extend these studies to elucidate the coassembly of the peptides to form heterotetramers.
Introduction
Interaction among β-sheets is the two-edged sword in protein structure, imparting folding and stability but also driving misfolding and aggregation. While folding is typically associated with normal biological function, aggregation is associated with the pathology of Alzheimer’s disease and other amyloid diseases, including Parkinson’s disease and type II diabetes.1 In Alzheimer’s disease, the β-amyloid peptide (Aβ) aggregates to form oligomers and fibrils that characterize the disease pathology.2
Elucidation of the oligomers and fibrils is critical to understanding how Aβ aggregates and counteracting the harmful effects. The fibrils mark the thermodynamic end point of Aβ aggregation and accumulate as the disease progresses.3 Several high-resolution structures have been reported of the Aβ fibrils, which typically adopt parallel β-sheet structure.4,5 The oligomers are thought to be primarily responsible for neurodegeneration, causing synaptic dysfunction in neurons.6 The oligomers are metastable and heterogeneous, and thus are difficult to study by high-resolution structural techniques.
Two key regions of Aβ favor β-sheet formation and promote aggregation: the central region and the C-terminal region.7 The central region contains Aβ17–21 (LVFFA). The two phenylalanine residues therein are especially important in nucleating and propagating the formation of Aβ aggregates.8 The C-terminal region comprises residues AIIGLMVGGVV (for Aβ1–40) or AIIGLMVGGVVIA (for Aβ1–42). These successive hydrophobic residues also promote aggregation.9
The central and C-terminal regions of Aβ are thought to assemble in a different fashion in the fibrils than in the oligomers. In fibrils formed by Aβ1–40, the two regions of the peptide can assemble to form layered parallel β-sheets connected by a U-shaped turn: one layer consists of the central region and the other consists of the C-terminal region.4,5Figure 1 illustrates a layered β-sheet structure formed by Aβ1–40.4b These layered fibril structures can further assemble in twos and threes to form fibrils that exhibit two-fold or three-fold symmetry. In the oligomers, the central and C-terminal regions are thought to coassemble in an antiparallel fashion to form β-hairpins, which assemble to form the oligomers.10 These regions may also promote the assembly of Aβ to form higher-order oligomers.
Figure 1.
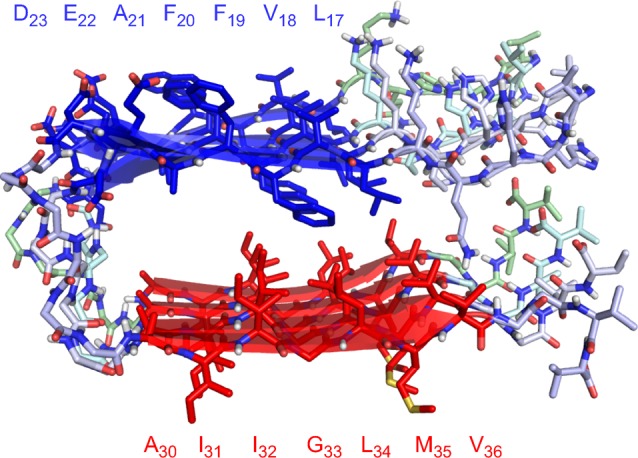
Layered β-sheet structure formed by Aβ1–40 within β-amyloid fibrils (PDB ID: 2LMQ).
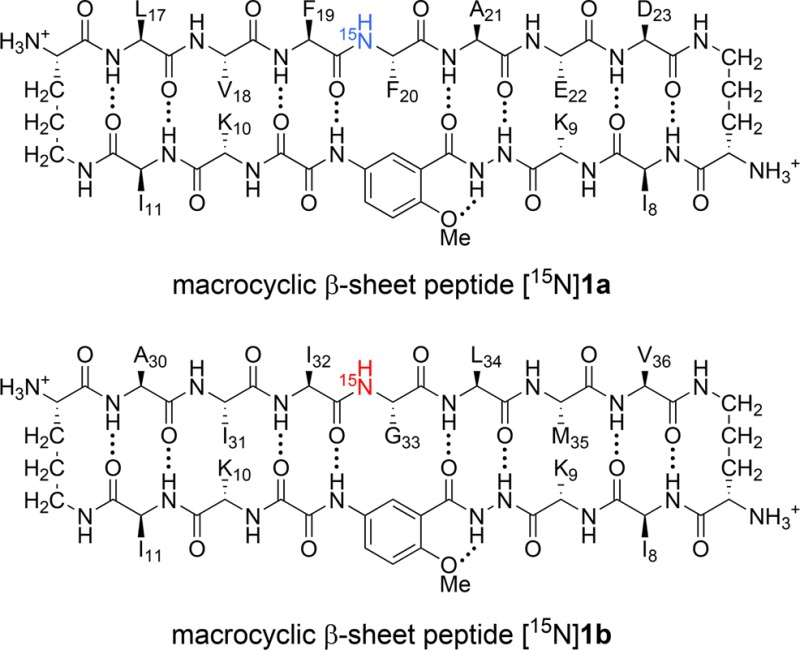
In 2012, our research group introduced macrocyclic β-sheet peptides 1 as a model system to investigate the assembly of amyloidogenic peptides and proteins (Figure 2).11 Peptides 1 consist of a heptapeptide strand (R1–7), a template strand, and two turn units. The heptapeptide strand displays amyloidogenic peptide sequences. The template strand contains the unnatural amino acid Hao and four additional residues (R8–11) that help promote β-sheet structure. Hao is a tripeptide mimic that templates β-sheet hydrogen bonding and blocks uncontrolled aggregation.12 The δ-linked ornithine (δOrn) turn units on each side connect the two strands and allow β-sheet folding.13 Our research group incorporated hydrophilic residues at positions R8 and/or R11 to minimize oligomerization.
Figure 2.
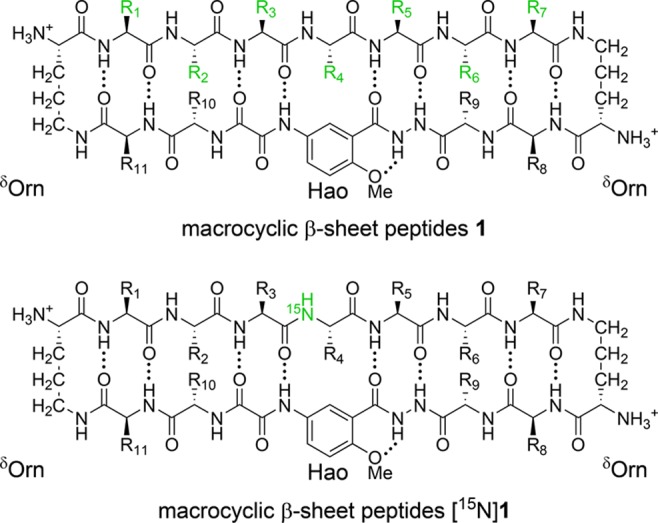
Macrocyclic β-sheet peptides 1, illustrating the heptapeptide strand (upper strand), the template strand (lower strand), and the two δOrn turn units. Macrocyclic β-sheet peptides [15N]1, illustrating the 15N isotopic label at the R4 position.
In this two-part investigation, we incorporated residues from the central and C-terminal regions of Aβ into peptides 1 to ask whether these regions prefer to coassemble or to segregate.14 To promote the formation of well-defined oligomers, we incorporated hydrophobic residues into positions R8 and R11. The first part—the current paper—determines how the two peptides assemble in aqueous solution. The second part—the accompanying paper—determines whether the two peptides exhibit a special preference to coassemble when mixed.15 This question is important because the two regions generally segregate in the fibrils but coassemble in the oligomers.
To facilitate these studies, we incorporated 15N isotopic labels into peptides 1. Peptides [15N]1 contain a single 15N isotopic label at the R4 position in the center of the heptapeptide strand (Figure 2). These peptides are readily prepared from commercially available 15N-labeled amino acids using solid-phase peptide synthesis. The 15N isotopic label provides a simple and effective spectroscopic probe to monitor assembly and coassembly by 1H,15N NMR spectroscopy.
Results and Discussion
Design of Peptides Derived from the Central and C-Terminal Regions of Aβ
We incorporated residues LVFFAED (Aβ17–23) and AIIGLMV (Aβ30–36)
into peptides 1, to give peptides 1a and 1b. We designed the peptides with a distinct hydrophobic surface
to promote assembly by incorporating isoleucine residues at positions
R8 and R11 of the template strand. We also designed
the peptides with a hydrophilic surface to promote solubility and
prevent uncontrolled aggregation by incorporating lysine residues
at positions R9 and R10 of the template strand.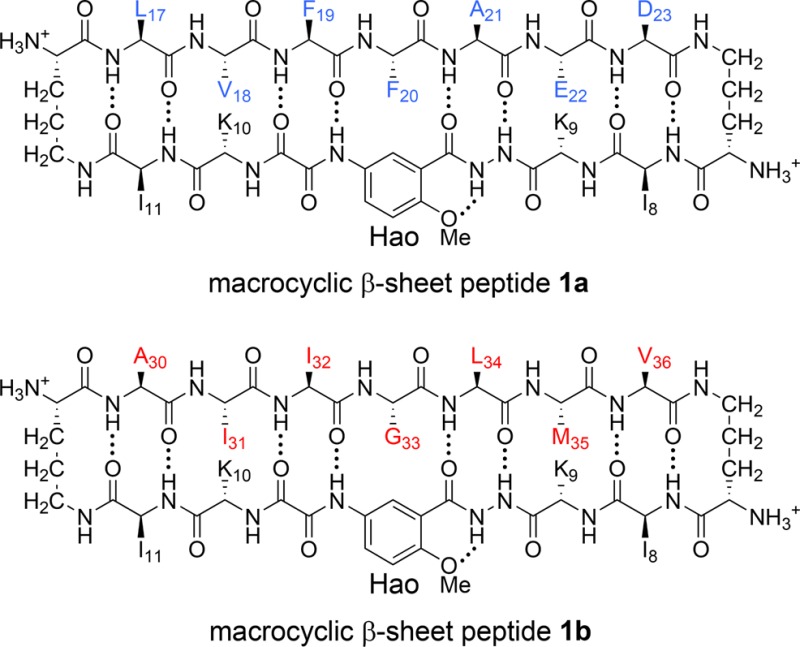
1H NMR studies show that peptides 1a and 1b assemble to form sandwich-like tetramers in aqueous solution.16 The tetramers consist of two β-sheet dimers that stack like slices of bread. The dimers are stabilized by hydrogen-bonding interactions between the amide backbones of the heptapeptide strands; the tetramers are stabilized by hydrophobic interactions between the hydrophobic surfaces of the dimers. The following subsections describe the elucidation of the tetramers by NMR spectroscopy.
DOSY Shows That Peptides 1a and 1b Form Tetramers
Our laboratory has previously used DOSY NMR studies and corroboratory analytical ultracentrifugation (AUC) experiments to establish that related macrocyclic β-sheet peptides form tetramers.17 DOSY NMR studies of peptides 1a and 1b show that these macrocyclic β-sheets also form tetramers (Table 1). The DOSY spectrum of peptide 1a at 0.15 mM shows two sets of resonances: one set from the monomer, with a diffusion coefficient of 20.4 × 10⁻¹¹ m2/s; the other set from the tetramer, with a diffusion coefficient of 12.6 × 10⁻¹¹ m2/s. At 8.0 mM, the spectrum shows only the latter set of resonances with a diffusion coefficient of 11.8 × 10⁻¹¹ m2/s. The DOSY spectrum of peptide 1b at 1.0 mM shows resonances from the monomer, with a diffusion coefficient 19.4 × 10⁻¹¹ m2/s, and the spectrum at 16.0 mM shows resonances from the tetramer, with a diffusion coefficient of 11.9 × 10⁻¹¹ m2/s.
Table 1. Diffusion Coefficients (D) of Peptides 1a and 1b in D2O at 298 K.

Molecular weight calculated for the neutral (uncharged) peptide.
The ratio of diffusion coefficients of a tetramer and monomer is typically 0.6.18 DOSY studies show that the oligomers of peptides 1a and 1b have diffusion coefficients of about 12 × 10–11 m2/s and the monomers have diffusion coefficients of about 20 × 10–11 m2/s. The ratio of the diffusion coefficients (0.6) is consistent with a tetramer.19
Elucidation of the Peptide 1a Tetramer
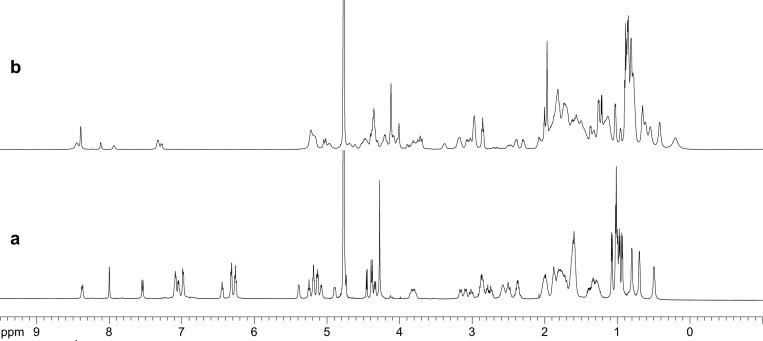
Peptide 1a forms a tetramer that consists of two β-sheet dimers. The 1H NMR spectrum of peptide 1a at 8 mM in D2O at 298 K shows one predominant set of resonances (Figure 3a).20 These resonances are associated with the tetramer. The resonances are disperse and exhibit distinct spectral features that reflect well-defined β-sheet structure: Seven of the 11 α-protons appear downfield of 5 ppm. The methyl proton resonance of A21 appears at 0.5 ppm. The aromatic proton resonances of F19 appear upfield of 7 ppm (6.3 to 6.5 ppm). The 1H NMR spectrum of peptide 1a at 0.15 mM in D2O at 298 K shows resonances associated with both the monomer and the tetramer (Figure S1). The resonances of the monomer lack the distinct spectral features of the tetramer.
Figure 3.
1H NMR spectra of (a) peptide 1a and (b) peptide 1b at 8.0 mM in D2O at 600 MHz and 298 K.
The magnetic anisotropy of the diastereotopic δ-proton resonances of the δOrn turn units reflects β-sheet folding in peptides 1 and related macrocyclic β-sheets.11a,13 In a well-folded macrocyclic β-sheet, the diasterotopic pro-S δ-protons appear about 0.6 ppm downfield of the pro-R δ-protons. In the tetramer of peptide 1a, the pro-S δ-protons appear 0.63 and 0.74 ppm downfield of the pro-R δ-protons. In the monomer, the pro-S δ-protons of peptide 1a appear 0.30 and 0.39 ppm downfield of the pro-R δ-protons. The magnetic anisotropies of these proton resonances indicate that the monomer is moderately folded, while the tetramer is well folded.
The NOESY spectrum of peptide 1a shows strong NOEs associated with the β-sheet folding and assembly of the tetramer. The spectrum shows a network of five strong NOEs associated with β-sheet folding: between the α-protons of V18 and K10, the α-protons of E22 and K9, the α-proton of F20 and the proton at the 6-position of the unnatural amino acid Hao (HaoH6), and the α- and δ-protons of the δOrn turn units (Figure S2). The spectrum shows two additional NOEs associated with β-sheet dimerization, between the α-protons of L17 and D23 and between the α-protons of F19 and A21 (Figure S2a). Figure 4 illustrates the dimer of peptide 1a consistent with these NOEs.
Figure 4.
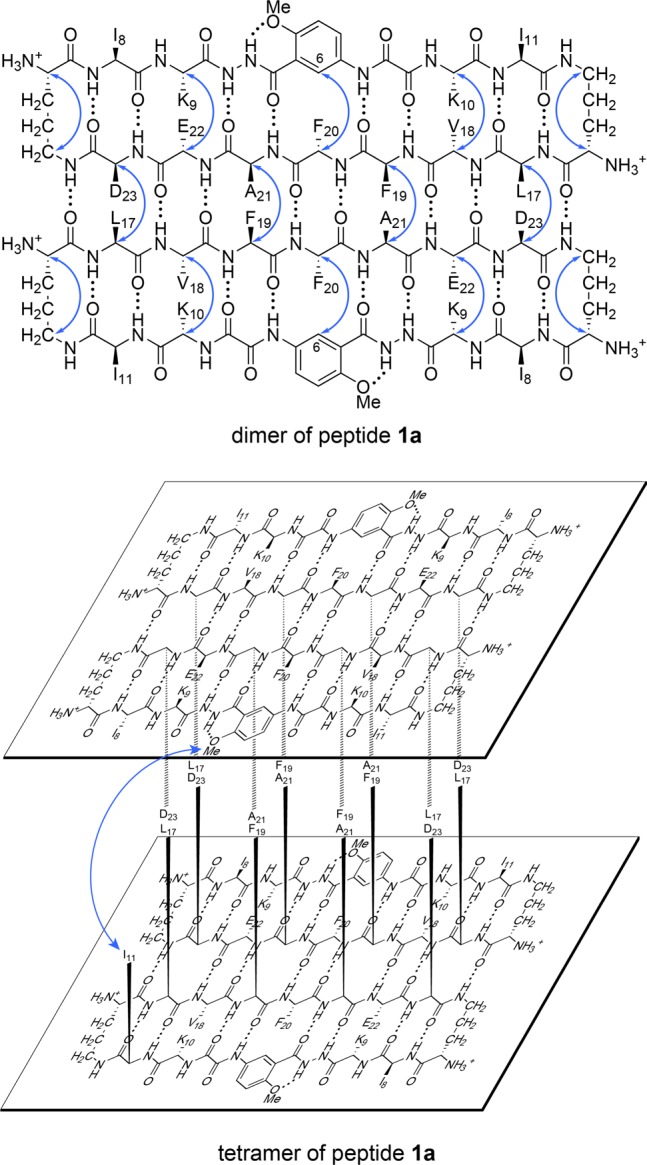
Dimer and tetramer of peptide 1a. Hydrogen-bonded dimer subunit (upper). Blue arrows illustrate intramolecular and intermolecular NOEs observed in the NOESY spectrum. Sandwich-like tetramer consisting of two hydrogen-bonded dimers (lower). The blue arrow illustrates the interlayer NOEs observed in the NOESY spectrum. The tetramer exhibits four-fold symmetry and four I11–HaoOMe interactions, even though only one arrow is shown.
The NOESY spectrum shows additional NOEs associated with the stacking of two dimers to form a sandwich-like tetramer. The spectrum shows a pattern of NOEs between the methoxy protons of Hao (HaoOMe) and the side-chain protons of I11, and additional NOEs between the protons at the 3- and 4-positions of Hao (HaoH3 and HaoH4) and the δ-methyl protons of I11 (Figure S3). Figure 4 illustrates the stacking of the two dimers of peptide 1a consistent with these interlayer NOEs.
Elucidation of the Peptide 1b Tetramer
Peptide 1b forms a similar tetramer, which also consists of two β-sheet dimers. The tetramer is less stable than that formed by peptide 1a and is in equilibrium with substantial amounts of monomer at millimolar concentrations (Figure S4). The 1H NMR spectrum of peptide 1b at 8.0 mM in D2O at 298 K shows two sets of resonances. These resonances appear in a 3:2 ratio of intensities, with the predominant set associated with the tetramer and the smaller set associated with the monomer (Figure 3b). The resonances are broadened, reflecting chemical exchange between the tetramer and the monomer on a ca. hundred-millisecond time scale. The resonances associated with the tetramer exhibit several distinct spectral features that reflect well-defined β-sheet structure: Five of the 11 α-proton resonances appear downfield of 5 ppm. The methyl proton resonances of L34 are shifted upfield of 0.5 ppm (0.38 and 0.12 ppm). The pro-S δ-proton resonances of the δOrn turn units appear 0.65 and 0.69 ppm downfield of the pro-R δ-proton resonances.
The monomer of peptide 1b lacks these distinct spectral features. The pro-S δ-proton resonances of the δOrn turn units appear 0.16 and 0.19 ppm downfield of the pro-R δ-proton resonances. The magnetic anisotropies of these proton resonances indicate that the monomer is poorly folded. In contrast to peptide 1a, the monomer of peptide 1b predominates at low millimolar concentrations. At concentrations below 1 mM, the spectrum shows almost exclusively the monomer and virtually no tetramer.
The NOESY spectrum of peptide 1b shows strong NOEs associated with β-sheet folding and weaker NOEs associated with β-sheet assembly. The spectrum shows a network of five strong NOEs associated with β-sheet folding: between the α-protons of I31 and K10, the α-protons of M35 and K9, the pro-R α-proton of G33 and the HaoH6 proton, and the α- and δ-protons of the δOrn turn units (Figure S5). The spectrum shows an additional NOE associated with β-sheet dimerization, between the α-protons of I32 and L34 (Figure S5a). The spectrum does not show a well-defined NOE crosspeak between the α-protons of A30 and V36. The absence of a well-defined crosspeak may reflect broadening of the resonances through chemical exchange with the monomer and overlap with an exchange crosspeak, or it may reflect a lack of close contact between the two protons. Figure 5 illustrates the β-sheet folding and dimerization of peptide 1b consistent with these NOEs.
Figure 5.
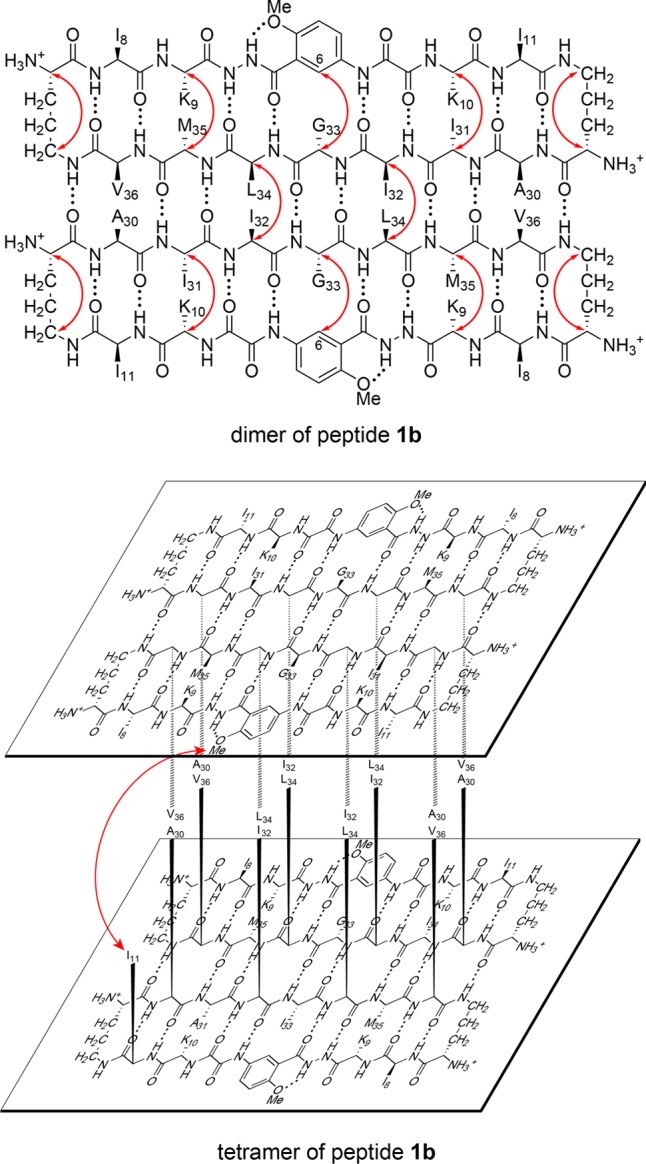
Dimer and tetramer of peptide 1b. Hydrogen-bonded dimer subunit (upper). Red arrows illustrate intramolecular and intermolecular NOEs observed in the NOESY spectrum. Sandwich-like tetramer consisting of two hydrogen-bonded dimers (lower). The red arrow illustrates the interlayer NOEs observed in the NOESY spectrum. The tetramer exhibits four-fold symmetry and four I11–HaoOMe interactions, even though only one arrow is shown.
The NOESY spectrum shows additional NOEs associated with the stacking of two dimers to form a sandwich-like tetramer. Like peptide 1a, peptide 1b exhibits a pattern of NOEs between the Hao protons and the I11 side-chain protons, and an additional NOE between HaoH3 and the δ-methyl protons of I11 (Figure S6). Figure 5 illustrates the stacking of the two dimers of peptide 1b consistent with these interlayer NOEs.
1H,15N HSQC Studies of the Tetramers Formed by Peptides [15N]1a and [15N]1b
We studied 15N-labeled homologues of peptides 1a and 1b by 1H,15N HSQC to identify and quantify the tetramers. 1H,15N HSQC is a mainstay in NMR spectroscopy of proteins, but is also useful for peptides. 15N-Isotopic labeling and the dispersion provided by the f1 (15N) dimension resolves mixtures of peptides far better than is possible by homonuclear techniques.
We prepared peptides [15N]1a and [15N]1b, which each contain a single 15N-labeled amino acid in the center of the heptapeptide strand. Peptide [15N]1a contains an 15N-labeled phenylalanine; peptide [15N]1b contains an 15N-labeled glycine. The 15N isotopic label provides a spectroscopic probe for each species containing the 15N-labeled peptide.
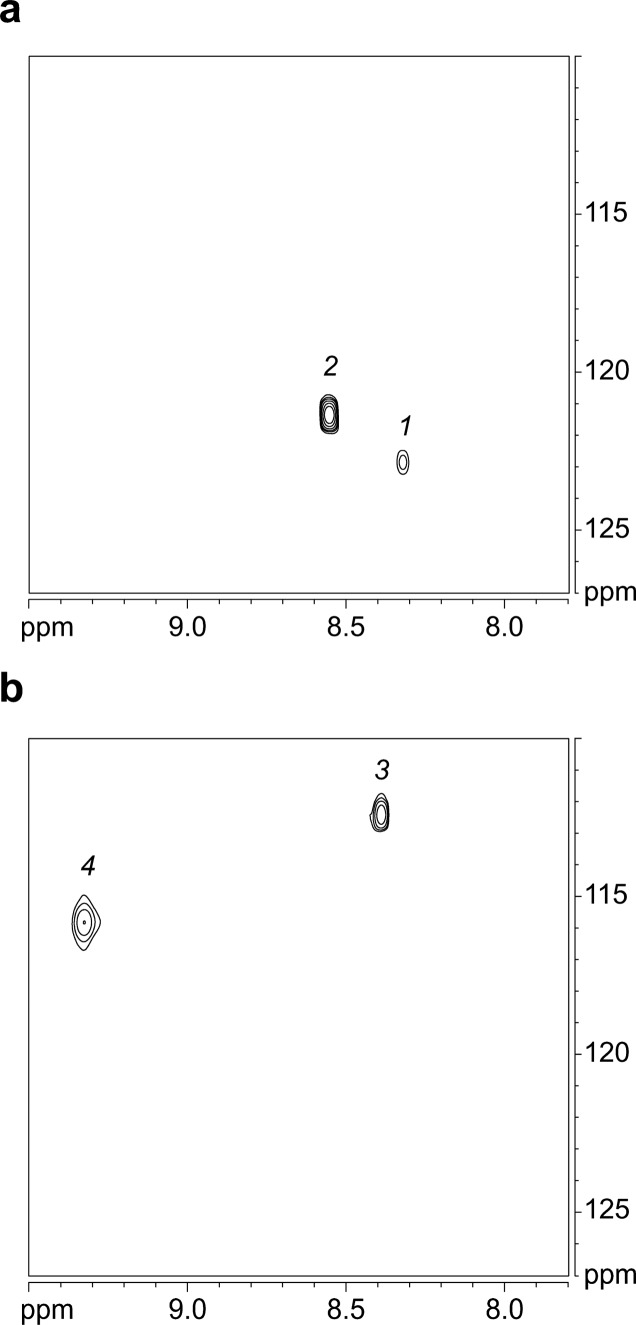
The 1H,15N HSQC spectrum of peptide [15N]1a in 9:1 H2O/D2O at 8.0 mM and 293 K shows two crosspeaks; the 1H,15N HSQC spectrum of peptide [15N]1b also shows two crosspeaks (Figure 6). The spectrum of peptide [15N]1a shows a weak crosspeak associated with the monomer and a strong crosspeak associated with the tetramer; these crosspeaks are designated 1 and 2, respectively. The spectrum of peptide [15N]1b shows crosspeaks of comparable intensities associated with the monomer and tetramer; these crosspeaks are designated 3 and 4, respectively. Table 2 summarizes the chemical shifts of these crosspeaks.
Figure 6.
1H,15N HSQC spectra of (a) peptide [15N]1a and (b) peptide [15N]1b at 8.0 mM in 9:1 H2O/D2O at 600 MHz and 293 K.
Table 2. Chemical Shifts of Peptides [15N]1a and [15N]1b.
| δ F20 |
δ G33 |
||||
|---|---|---|---|---|---|
| crosspeak | 1H | 15N | 1H | 15N | species |
| 1 | 8.32 | 122.3 | A monomer | ||
| 2 | 8.56 | 121.3 | A4 tetramer | ||
| 3 | 8.39 | 112.5 | B monomer | ||
| 4 | 9.33 | 115.8 | B4 tetramer | ||
1H,15N HSQC spectra were recorded at 8.0 mM in 9:1 H2O/D2O at 293 K.
In the accompanying paper, we combine 15N-labeling and 1H,15N NMR spectroscopy to identify and characterize the seven different species that form upon mixing peptides [15N]1a and [15N]1b.15
15N-Edited NOESY
We used peptides [15N]1a and [15N]1b to corroborate the pairing of the dimers within the tetramers. We recorded 1H,15N NOESY-HSQC spectra with typical NOESY parameters in both 1H dimensions (f1 and f3), but with only one increment in the 15N dimension (f2). The result is an 15N-edited NOESY spectrum that shows only NOEs involving the 15NH protons and requires no more time than a regular NOESY spectrum.
The NH protons of an antiparallel β-sheet typically give a pattern of four key NOEs associated with β-sheet folding and interstrand interaction. Two of the NOEs reflect β-sheet folding: a weaker intraresidue NOE to the α-proton and a stronger interresidue NOE to the α-proton of the adjacent residue. Figure 7 illustrates these close contacts and shows typical distances (3.0 and 2.2 Å, respectively). Two of the NOEs reflect interstrand interaction: an NOE to the α-proton diagonally across in the non-hydrogen-bonded pair, and another NOE to the NH proton diagonally across in the hydrogen-bonded pair. Figure 7 also illustrates these close contacts and shows typical distances (3.2 and 3.3 Å, respectively). The magnitude of the interresidue NOE should be much stronger than the magnitude of the interstrand NOEs, because the NOE intensities decrease with distance to the inverse sixth power.
Figure 7.
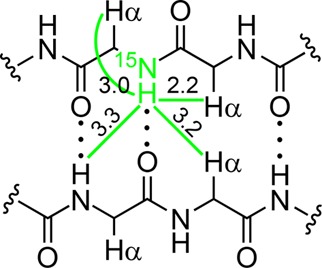
Four close contacts involving NH protons and Hα protons in antiparallel β-sheets. Typical distances are shown in angstroms.
The 15N-edited NOESY spectrum of peptide [15N]1a shows two sets of NOEs: one set is associated with the F20NH proton from the monomer; the other set is associated with the F20NH proton from the tetramer (Figure 8a). The monomer F20NH proton gives only an intraresidue NOE to the F20Hα proton. The tetramer F20NH proton gives two NOEs associated with β-sheet folding: a stronger interresidue NOE to the F19Hα proton and an intraresidue NOE to the F20Hα proton. The tetramer F20NH proton also gives an intermolecular NOE associated with interstrand interaction to the A21Hα proton diagonally across the peptide dimer. This NOE is significant, because it reflects the dimer within the tetramer (Figure 9a). The tetramer F20NH proton can not give an intermolecular NOE to the F20NH proton diagonally across the peptide dimer, because the tetramer is symmetrical (Figure S7). Figure 9 summarizes the observed NOEs involving the 15NH protons between the dimers within the tetramer of peptide [15N]1a.
Figure 8.
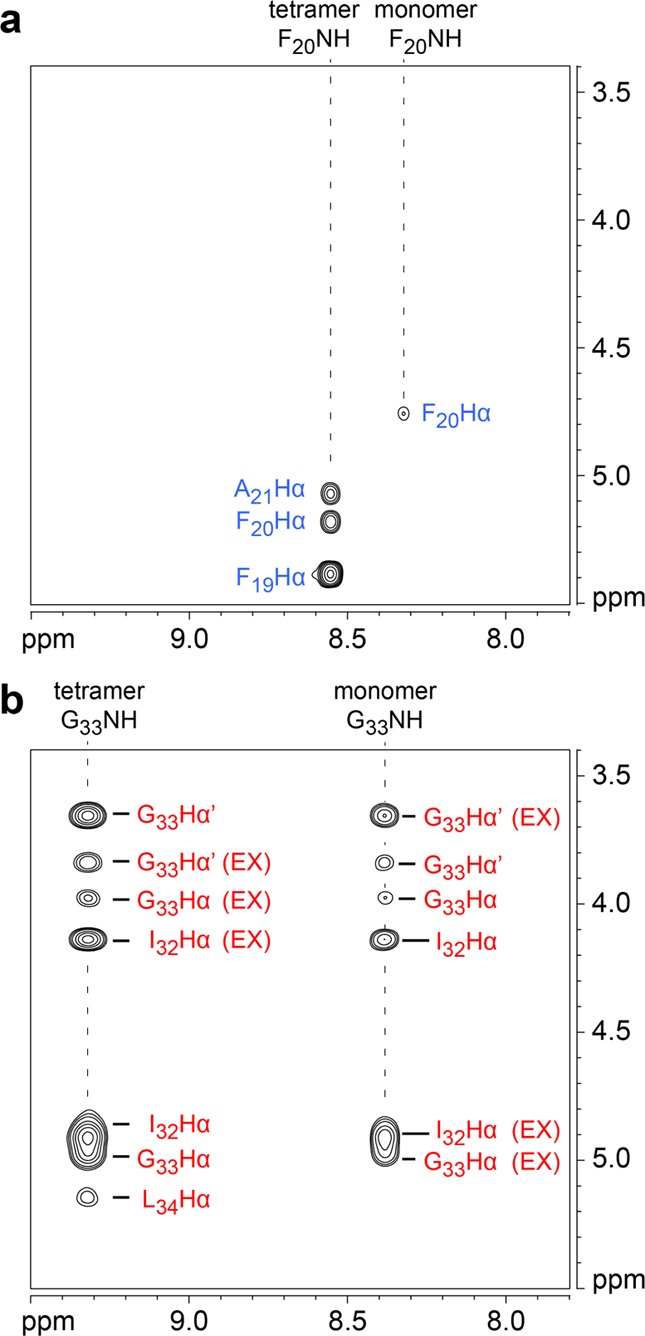
15N-Edited NOESY spectra of (a) peptide [15N]1a and (b) peptide [15N]1b at 8.0 mM in 9:1 H2O/D2O at 600 MHz and 293 K. The G33Hα corresponds to the pro-R α-proton and the G33Hα′ corresponds to the pro-S α-proton. Crosspeaks associated with chemical exchange between the monomer and tetramer are labeled EX.20
Figure 9.
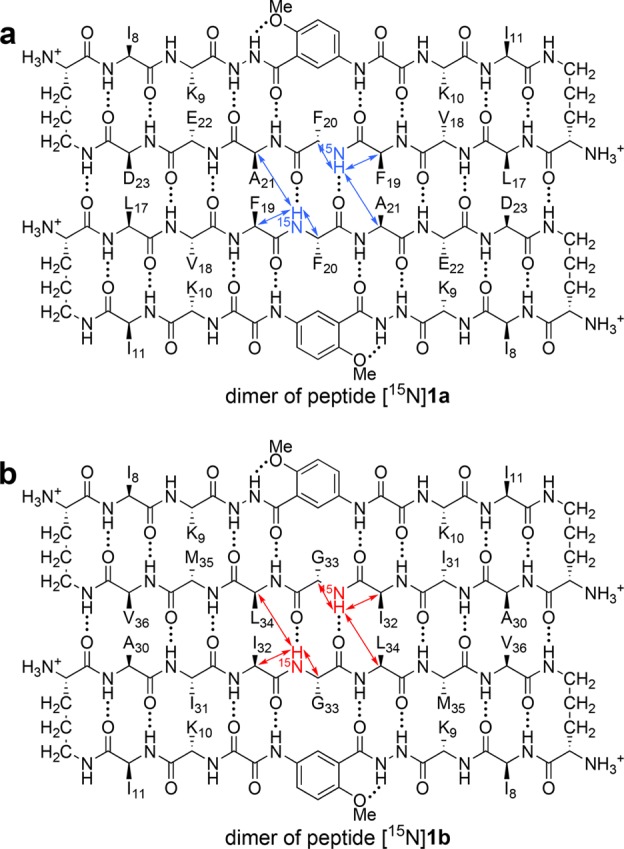
NOEs involving the 15NH protons between the dimers of peptides [15N]1a and [15N]1b within the respective tetramers. Blue and red arrows illustrate observed NOEs.
The 15N-edited NOESY spectrum of peptide [15N]1b also shows two sets of NOEs: one set is associated with the G33NH proton from the monomer; the other set is associated with the G33NH proton from the tetramer (Figure 8b). The monomer G33NH proton gives a pattern of NOEs associated with β-sheet folding: two intraresidue NOEs to the diastereotopic G33Hα and G33Hα′ protons and one interresidue NOE to the I32Hα proton. The tetramer G33NH proton also gives a pattern of NOEs associated with β-sheet folding: two intraresidue NOEs to the G33Hα and G33Hα′ protons and one interresidue NOE to the I32Hα proton. The tetramer G33NH proton also gives an intermolecular NOE associated with interstrand interaction to the L34Hα proton diagonally across the peptide dimer. This NOE is significant, because it reflects the dimer within the tetramer. The tetramer G33NH proton can not give an intermolecular NOE to the G33NH proton diagonally across the peptide dimer, because the tetramer is symmetrical (Figure S8). Figure 9 summarizes the observed NOEs involving the 15NH protons between the dimers within the tetramer of peptide [15N]1b.
Molecular Models of the Tetramers
We constructed energy-minimized models consistent with the observed NOEs to help understand the structures of the tetramers of peptides 1a and 1b. We began with the X-ray crystallographic coordinates of a tetramer formed by a homologous macrocyclic β-sheet peptide (PDB ID: 3T4G).11a We mutated the side chains to the residues of peptides 1a and 1b. We modified the alignment of the β-sheet dimers and oriented the dimers to reflect the observed NOEs. We then generated the minimum-energy models (local minima) of the tetramers. These models help illustrate the structures formed by the peptides derived from the central and C-terminal regions of Aβ. Figures 10 and 11 illustrate these models.
Figure 10.
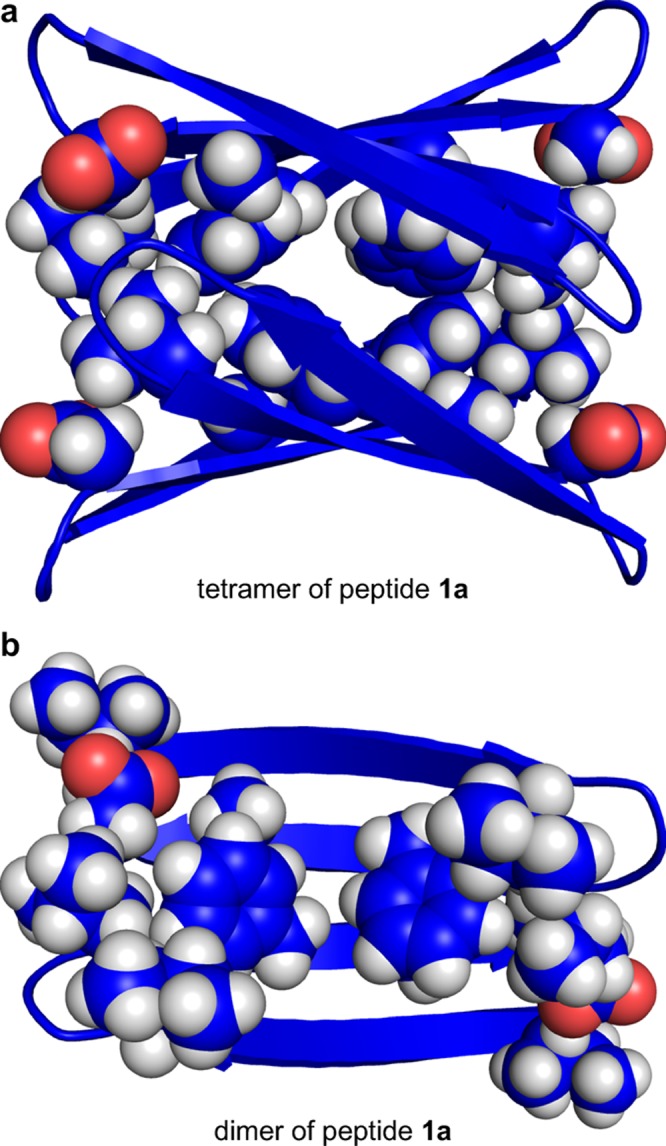
Molecular model of the tetramer formed by peptide 1a. (a) The tetramer with the side chains of L17, F19, A21, and D23 shown. (b) Dimer subunit of the tetramer with the side chains of L17, F19, A21, D23, I8, and I11 shown.
Figure 11.
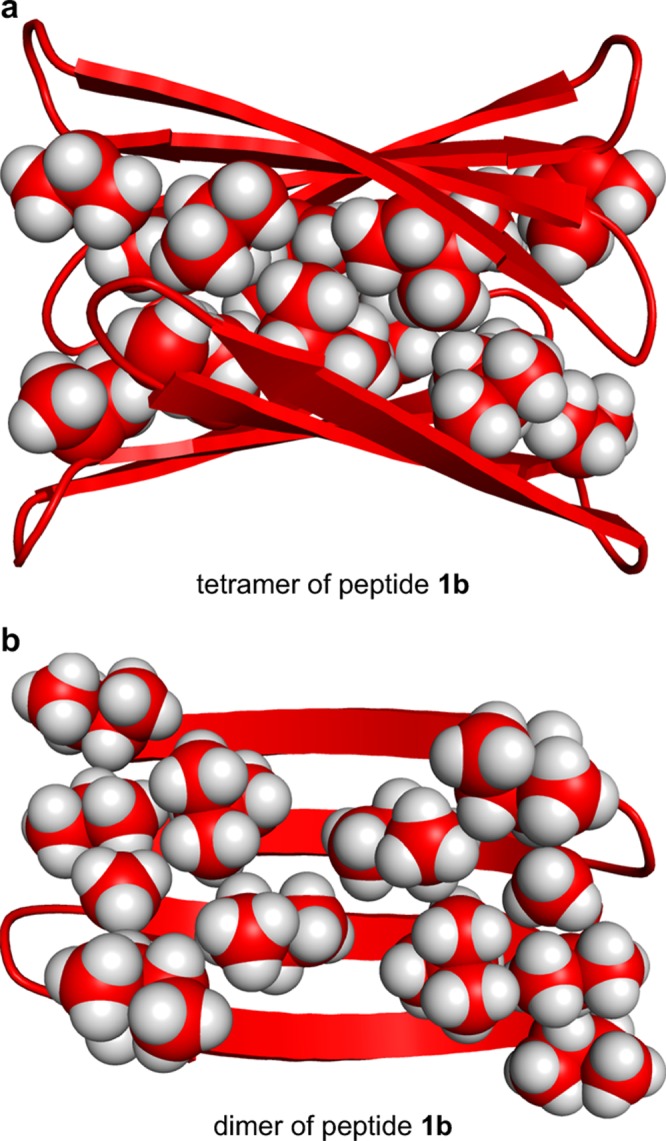
Molecular model of the tetramer formed by peptide 1b. (a) The tetramer with the side chains of A30, I32, L34, and V36 shown. (b) Dimer subunit of the tetramer with the side chains of A30, I32, L34, V36, I8, and I11 shown.
The energy-minimized model of the peptide 1a tetramer consists of a β-sandwich of two four-stranded β-sheets that laminate together and form a hydrophobic core (Figure 10). The β-sheets exhibit a distinct twist that imparts a saddle shape. The side chains of L17, F19, and A21 form a hydrophobic surface that packs in the hydrophobic core, while the side chains of E22 and D23 are exposed to solvent. The β-sheet dimers do not completely overlap, but rather are rotated roughly 30° about the normal axis. The rotation and twist of the β-sheets allow the corners to pack tightly against each other. The corners of the β-sheet layers are nearly in contact, which is consistent with the observed interlayer NOEs between the Hao protons and the I11 side-chain protons.
The energy-minimized model of the peptide 1b tetramer is similar to that of peptide 1a in that it also consists two four-stranded β-sheets that laminate together (Figure 11). The β-sheets are slightly less twisted, and the side chains of A30, I32, L34, and V36 form the hydrophobic surface that packs in the hydrophobic core. Like peptide 1a, the β-sheets are rotated roughly 30° about the normal axis, allowing the corners to pack tightly against each other.
Conclusion
Macrocyclic β-sheet peptides 1 provide a platform with which to study the self-assembly of amyloid-derived peptides. Essential to the design of these β-sheet-forming peptides is the use of an amphiphilic template strand containing the peptide sequence IKHaoKI to block uncontrolled aggregation. The unnatural amino acid Hao promotes β-sheet formation and blocks uncontrolled hydrogen-bonding interactions. The Ile residues in the template strand give a distinct hydrophobic surface that promotes peptide assembly, while the Lys residues give a distinct hydrophilic surface that disfavors aggregation.
Incorporation of the central and C-terminal regions of Aβ into peptides 1 allows the study of these regions. The peptides containing these regions assemble through hydrogen-bonding and hydrophobic interactions to form β-sheet dimers that further assemble to form tetramers. NOESY and other 1H NMR studies show that the tetramers comprise a β-sandwich of two hydrogen-bonded dimers. Molecular modeling further elucidates the structures of the tetramers. The tetramers that form reflect the propensities of the central and C-terminal regions to assemble and adopt β-sheet structure.
Incorporation of a single 15N isotopic label into peptides 1 provides a spectroscopic probe that simplifies the spectra of the monomers and tetramers. 1H,15N HSQC studies show that each peptide gives a single crosspeak associated with the monomer and a single crosspeak associated with the tetramer. 15N-Edited NOESY studies corroborate the pairing of the dimers within the tetramers. The hydrophobic amino acids Gly, Ala, Val, Leu, Ile, and Phe are widespread in amyloidogenic peptides and proteins and are readily available with an 15N isotopic label at reasonable cost. The incorporation of a single 15N-labeled amino acid as a spectroscopic probe promises to be broadly useful in studying the assembly and coassembly of peptides. In the accompanying paper, we apply this approach to study the coassembly of peptides derived from the central and C-terminal regions of Aβ.
Acknowledgments
We thank the National Institutes of Health for grant support (GM097562). N.L.T. thanks Prof. Melanie J. Cocco and Dr. Philip R. Dennison for assistance with the NMR experiments.
Supporting Information Available
The Supporting Information is available free of charge on the ACS Publications website at DOI: 10.1021/jacs.6b06000.
Figures S1–S8, showing 1H NMR and NOESY spectra and key NOEs; procedures for the synthesis of peptides 1 and also for the Fmoc-protection of 15N-labeled amino acids; HPLC and MS characterization data for peptides 1; and NMR spectroscopic data for peptides 1, [15N]1, Fmoc-[15N]Phe-OH, and Fmoc-[15N]Gly-OH (PDF)
The authors declare no competing financial interest.
Supplementary Material
References
- a Selkoe D. J. Nature 2003, 426, 900–904. 10.1038/nature02264. [DOI] [PubMed] [Google Scholar]; b Ross C. A.; Poirier M. A. Nat. Med. 2004, 10, S10–S17. 10.1038/nm1066. [DOI] [PubMed] [Google Scholar]; c Chiti F.; Dobson C. M. Annu. Rev. Biochem. 2006, 75, 333–366. 10.1146/annurev.biochem.75.101304.123901. [DOI] [PubMed] [Google Scholar]; d Knowles T. P.; Vendruscolo M.; Dobson C. M. Nat. Rev. Mol. Cell Biol. 2014, 15, 384–396. 10.1038/nrm3810. [DOI] [PubMed] [Google Scholar]
- a Näslund J.; Haroutunian V.; Mohs R.; Davis K. L.; Davies P.; Greengard P.; Buxbaum J. D. JAMA 2000, 283, 1571–1577. 10.1001/jama.283.12.1571. [DOI] [PubMed] [Google Scholar]; b Haass C.; Selkoe D. J. Nat. Rev. Mol. Cell Biol. 2007, 8, 101–112. 10.1038/nrm2101. [DOI] [PubMed] [Google Scholar]; c Querfurth H. W.; LaFerla F. M. N. Engl. J. Med. 2010, 362, 329–344. 10.1056/NEJMra0909142. [DOI] [PubMed] [Google Scholar]
- Kirkitadze M. D.; Bitan G.; Teplow D. B. J. Neurosci. Res. 2002, 69 (5), 567–77. 10.1002/jnr.10328. [DOI] [PubMed] [Google Scholar]
- a Petkova A. T.; Ishii Y.; Balbach J. J.; Antzutkin O. N.; Leapman R. D.; Delaglio F.; Tycko R. Proc. Natl. Acad. Sci. U. S. A. 2002, 99, 16742–16747. 10.1073/pnas.262663499. [DOI] [PMC free article] [PubMed] [Google Scholar]; b Paravastu A. K.; Leapman R. D.; Yau W.-M.; Tycko R. Proc. Natl. Acad. Sci. U. S. A. 2008, 105, 18349–18354. 10.1073/pnas.0806270105. [DOI] [PMC free article] [PubMed] [Google Scholar]; c Tycko R.; Wickner R. B. Acc. Chem. Res. 2013, 46, 1487–1496. 10.1021/ar300282r. [DOI] [PMC free article] [PubMed] [Google Scholar]; d Lu J.-X.; Qiang W.; Yau W.-M.; Schwieters C. D.; Meredith S. C.; Tycko R. Cell 2013, 154, 1257–1268. 10.1016/j.cell.2013.08.035. [DOI] [PMC free article] [PubMed] [Google Scholar]
- The fibrils formed by Aβ1–42 adopt a more compact structure:; a Xiao Y.; Ma B.; McElheny D.; Parthasarathy S.; Long F.; Hoshi M.; Nussinov R.; Ishii Y. Nat. Struct. Mol. Biol. 2015, 22, 499–505. 10.1038/nsmb.2991. [DOI] [PMC free article] [PubMed] [Google Scholar]; b Walti M. A.; Ravotti F.; Arai H.; Glabe C. G.; Wall J. S.; Bockmann A.; Guntert P.; Meier B. H.; Riek R. Proc. Natl. Acad. Sci. U. S. A. 2016, 113, E4976–E4984. 10.1073/pnas.1600749113. [DOI] [PMC free article] [PubMed] [Google Scholar]; c Colvin M. T.; Silvers R.; Ni Q. Z.; Can T. V.; Sergeyev I.; Rosay M.; Donovan K. J.; Michael B.; Wall J.; Linse S.; Griffin R. G. J. Am. Chem. Soc. 2016, 138, 9663–9674. 10.1021/jacs.6b05129. [DOI] [PMC free article] [PubMed] [Google Scholar]
- a Cleary J. P.; Walsh D. M.; Hofmeister J. J.; Shankar G. M.; Kuskowski M. A.; Selkoe D. J.; Ashe K. H. Nat. Neurosci. 2005, 8, 79–84. 10.1038/nn1372. [DOI] [PubMed] [Google Scholar]; b Benilova I.; Karran E.; De Strooper B. Nat. Neurosci. 2012, 15, 349–357. 10.1038/nn.3028. [DOI] [PubMed] [Google Scholar]; c Teplow D. B. Alzheimer's Res. Ther. 2013, 5, 39–51. 10.1186/alzrt203. [DOI] [PMC free article] [PubMed] [Google Scholar]; d Walsh D. M.; Selkoe D. J. J. Neurochem. 2007, 101, 1172–1184. 10.1111/j.1471-4159.2006.04426.x. [DOI] [PubMed] [Google Scholar]
- Liu R.; McAllister C.; Lyubchenko Y.; Sierks M. R. J. Neurosci. Res. 2004, 75, 162–171. 10.1002/jnr.10859. [DOI] [PubMed] [Google Scholar]
- a Esler W. P.; Stimson E. R.; Ghilardi J. R.; Lu Y. A.; Felix A. M.; Vinters H. V.; Mantyh P. W.; Lee J. P.; Maggio J. E. Biochemistry 1996, 35, 13914–13921. 10.1021/bi961302+. [DOI] [PubMed] [Google Scholar]; b Cukalevski R.; Boland B.; Frohm B.; Thulin E.; Walsh D.; Linse S. ACS Chem. Neurosci. 2012, 3, 1008–1016. 10.1021/cn300073s. [DOI] [PMC free article] [PubMed] [Google Scholar]; c Tjernberg L. O.; Callaway D. J. E.; Tjernberg A.; Hahne S.; Lilliehook C.; Terenius L.; Thyberg J.; Nordstedt C. J. Biol. Chem. 1999, 274, 12619–12625. 10.1074/jbc.274.18.12619. [DOI] [PubMed] [Google Scholar]
- a Larini L.; Shea J. E. Biophys. J. 2012, 103, 576–586. 10.1016/j.bpj.2012.06.027. [DOI] [PMC free article] [PubMed] [Google Scholar]; b Ball K. A.; Phillips A. H.; Wemmer D. E.; Head-Gordon T. Biophys. J. 2013, 104, 2714–2724. 10.1016/j.bpj.2013.04.056. [DOI] [PMC free article] [PubMed] [Google Scholar]; c Do T. D.; LaPointe N. E.; Nelson R.; Krotee P.; Hayden E. Y.; Ulrich B.; Quan S.; Feinstein S. C.; Teplow D. B.; Eisenberg D.; Shea J. E.; Bowers M. T. J. Am. Chem. Soc. 2016, 138, 549–557. 10.1021/jacs.5b09536. [DOI] [PMC free article] [PubMed] [Google Scholar]
- a Hoyer W.; Gronwall C.; Jonsson A.; Stahl S.; Hard T. Proc. Natl. Acad. Sci. U. S. A. 2008, 105, 5099–5104. 10.1073/pnas.0711731105. [DOI] [PMC free article] [PubMed] [Google Scholar]; b Cerf E.; Sarroukh R.; Tamamizu-Kato S.; Breydo L.; Derclaye S.; Dufrene Y. F.; Narayanaswami V.; Goormaghtigh E.; Ruysschaert J. M.; Raussens V. Biochem. J. 2009, 421, 415–423. 10.1042/BJ20090379. [DOI] [PubMed] [Google Scholar]; c Yu L.; Edalji R.; Harlan J. E.; Holzman T. F.; Lopez A. P.; Labkovsky B.; Hillen H.; Barghorn S.; Ebert U.; Richardson P. L.; Miesbauer L.; Solomon L.; Bartley D.; Walter K.; Johnson R. W.; Hajduk P. J.; Olejniczak E. T. Biochemistry 2009, 48, 1870–1877. 10.1021/bi802046n. [DOI] [PubMed] [Google Scholar]; d Sandberg A.; Luheshi L. M.; Söllvander S.; Pereira de Barros T.; Macao B.; Knowles T. P. J.; Biverstål H.; Lendel C.; Ekholm-Petterson F.; Dubnovitsky A.; Lannfelt L.; Dobson C. M.; Härd T. Proc. Natl. Acad. Sci. U. S. A. 2010, 107, 15595–15600. 10.1073/pnas.1001740107. [DOI] [PMC free article] [PubMed] [Google Scholar]; e Lendel C.; Bjerring M.; Dubnovitsky A.; Kelly R. T.; Filippov A.; Antzutkin O. N.; Nielsen N. C.; Hard T. Angew. Chem., Int. Ed. 2014, 53, 12756–12760. 10.1002/anie.201406357. [DOI] [PubMed] [Google Scholar]; f Spencer R. K.; Li H.; Nowick J. S. J. Am. Chem. Soc. 2014, 136, 5595–5598. 10.1021/ja5017409. [DOI] [PMC free article] [PubMed] [Google Scholar]; g Kreutzer A. G.; Hamza I. L.; Spencer R. K.; Nowick J. S. J. Am. Chem. Soc. 2016, 138, 4634–4642. 10.1021/jacs.6b01332. [DOI] [PMC free article] [PubMed] [Google Scholar]
- a Cheng P. N.; Liu C.; Zhao M.; Eisenberg D.; Nowick J. S. Nat. Chem. 2012, 4, 927–933. 10.1038/nchem.1433. [DOI] [PMC free article] [PubMed] [Google Scholar]; b Liu C.; Zhao M.; Jiang L.; Cheng P. N.; Park J.; Sawaya M. R.; Pensalfini A.; Gou D.; Berk A. J.; Glabe C. G.; Nowick J.; Eisenberg D. Proc. Natl. Acad. Sci. U. S. A. 2012, 109, 20913–20918. 10.1073/pnas.1218792109. [DOI] [PMC free article] [PubMed] [Google Scholar]; c Buchanan L. E.; Dunkelberger E. B.; Tran H. Q.; Cheng P. N.; Chiu C. C.; Cao P.; Raleigh D. P.; de Pablo J. J.; Nowick J. S.; Zanni M. T. Proc. Natl. Acad. Sci. U. S. A. 2013, 110, 19285–19290. 10.1073/pnas.1314481110. [DOI] [PMC free article] [PubMed] [Google Scholar]
- Nowick J. S.; Chung D. M.; Maitra K.; Maitra S.; Stigers K. D.; Sun Y. J. Am. Chem. Soc. 2000, 122, 7654–7661. 10.1021/ja001142w. [DOI] [Google Scholar]
- a Nowick J. S.; Brower J. O. J. Am. Chem. Soc. 2003, 125, 876–877. 10.1021/ja028938a. [DOI] [PubMed] [Google Scholar]; b Woods R. J.; Brower J. O.; Castellanos E.; Hashemzadeh M.; Khakshoor O.; Russu W. A.; Nowick J. S. J. Am. Chem. Soc. 2007, 129, 2548–2558. 10.1021/ja0667965. [DOI] [PMC free article] [PubMed] [Google Scholar]
- For some related studies of peptide and protein coassembly, see:; a Hammarstrom P.; Schneider F.; Kelly J. W. Science 2001, 293, 2459–2462. 10.1126/science.1062245. [DOI] [PubMed] [Google Scholar]; b Schnarr N. A.; Kennan A. J. J. Am. Chem. Soc. 2002, 124, 9779–9783. 10.1021/ja0174940. [DOI] [PubMed] [Google Scholar]; c Hadley E. B.; Testa O. D.; Woolfson D. N.; Gellman S. H. Proc. Natl. Acad. Sci. U. S. A. 2008, 105, 530–535. 10.1073/pnas.0709068105. [DOI] [PMC free article] [PubMed] [Google Scholar]; d Xu F.; Zahid S.; Silva T.; Nanda V. J. Am. Chem. Soc. 2011, 133, 15260–15263. 10.1021/ja205597g. [DOI] [PMC free article] [PubMed] [Google Scholar]; e Fallas J. A.; Hartgerink J. D. Nat. Commun. 2012, 3, 1087. 10.1038/ncomms2084. [DOI] [PubMed] [Google Scholar]; f Thomas F.; Boyle A. L.; Burton A. J.; Woolfson D. N. J. Am. Chem. Soc. 2013, 135, 5161–5166. 10.1021/ja312310g. [DOI] [PubMed] [Google Scholar]; g Negron C.; Keating A. E. J. Am. Chem. Soc. 2014, 136, 16544–16556. 10.1021/ja507847t. [DOI] [PMC free article] [PubMed] [Google Scholar]
- Truex N. L.; Nowick J. S. J. Am. Chem. Soc. 2016, 10.1021/jacs.6b06001. [DOI] [PMC free article] [PubMed] [Google Scholar]
- 1H NMR studies were performed without buffer at pH 2.5 ± 0.5 to keep peptides 1a and 1b in the fully protonated state.
- a Khakshoor O.; Demeler B.; Nowick J. S. J. Am. Chem. Soc. 2007, 129, 5558–5569. 10.1021/ja068511u. [DOI] [PMC free article] [PubMed] [Google Scholar]; b Pham J. D.; Demeler B.; Nowick J. S. J. Am. Chem. Soc. 2014, 136, 5432–5442. 10.1021/ja500996d. [DOI] [PMC free article] [PubMed] [Google Scholar]; c Pham J. D.; Spencer R. K.; Chen K. H.; Nowick J. S. J. Am. Chem. Soc. 2014, 136, 12682–12690. 10.1021/ja505713y. [DOI] [PMC free article] [PubMed] [Google Scholar]
- a Polson A. J. Phys. Colloid Chem. 1950, 54, 649–652. 10.1021/j150479a007. [DOI] [Google Scholar]; b Teller D. C.; Swanson E.; de Haën C. Methods Enzymol. 1979, 61, 104–124. 10.1016/0076-6879(79)61010-8. [DOI] [PubMed] [Google Scholar]; c Yao S.; Howlett G. J.; Norton R. S. J. Biomol. NMR 2000, 16, 109–119. 10.1023/A:1008382624724. [DOI] [PubMed] [Google Scholar]; d Cohen Y.; Avram L.; Frish L. Angew. Chem., Int. Ed. 2005, 44, 520–554. 10.1002/anie.200300637. [DOI] [PubMed] [Google Scholar]; e Cohen Y.; Avram L.; Evan-Salem T.; Slovak S.; Shemesh N.; Frish L. In Analytical Methods in Supramolecular Chemistry, 2nd ed.; Schalley C. A., Ed.; Wiley-VCH: Weinheim, 2012; pp 197–285. [Google Scholar]
- The ratio of diffusion coefficients of an oligomer and monomer reflects the oligomerization state as well as the shapes of the molecules. A tetramer will have a diffusion coefficient of about 0.59–0.63 times that of the monomer, while a dimer will have a diffusion coefficient of about 0.75–0.79 times that of the monomer. A tetramer could not easily be distinguished from a pentamer and could only marginally be distinguished from a trimer on the basis of diffusion coefficients measured by DOSY. The observation of well-defined dimer subunits by NOESY in conjunction with the observed ratios of diffusion coefficients by DOSY clearly establishes the tetrameric state of the oligomers.
- Chemical exchange between the monomer and tetramer of peptide 1a is slow on the hundred-millisecond time scale at 298 K, but exchange increases at higher temperatures. An EXSY experiment shows a set of EXSY crosspeaks that indicate chemical exchange on the hundred-millisecond time scale at 318 K (see the Supporting Information). In contrast, chemical exchange between the monomer and tetramer of peptide 1b occurs on the hundred-millisecond time scale even at 293 K.
Associated Data
This section collects any data citations, data availability statements, or supplementary materials included in this article.


