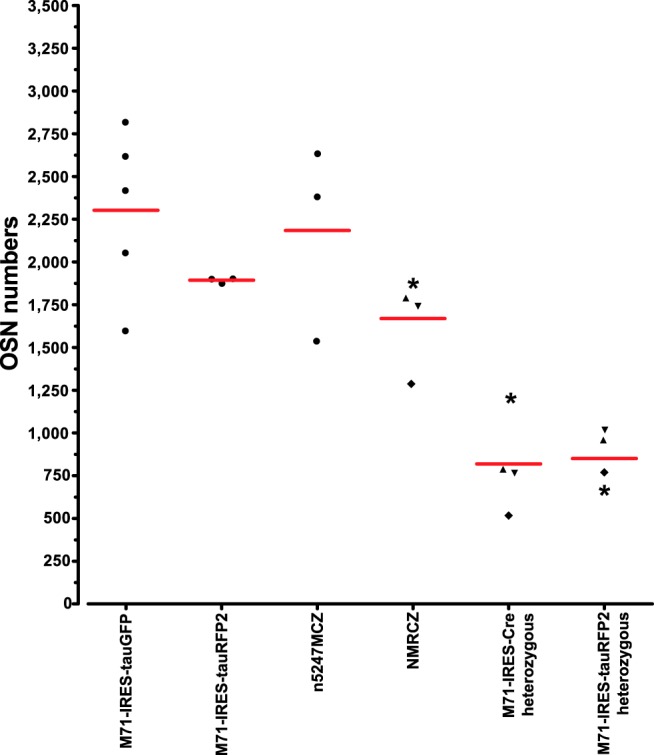
Figure 5.

Numbers of labeled cells per mouse in mice with gene-targeted mutations in the M71 locus at PD21. Numbers are given ± SD and are Abercrombie corrected, as described in Bressel et al. (2016). A symbol represents an individual mouse. The numbers for M71-IRES-tauGFP (n = 5 mice) and M71-IRES-tauRFP2 (n = 3 mice) are taken from Bressel et al. (2016) for comparison. “M71-IRES-Cre heterozygous” and “M71-IRES-tauRFP2 heterozygous” are the numbers of labeled cells representing the two different M71 alleles in NMRCZ (n = 4 mice), and the sum of these numbers is given in “NMRCZ.” The symbols (asterisk, upward triangle, downward triangle, diamond) used for NMRCZ represent individual mice. Analysis of cell counts using one-way ANOVA found all homozygous vs. heterozygous pairs significant (p < 0.05) according to Tukey’s multiple comparison test, which is consistent with monoallelic expression of OR genes. All other comparisons (–/– vs. –/– pairs and +/– vs. +/– pairs) are not significant.
