

Abstract
Objectives:
To determine the repeatability of knee joint impulsive loading measurements with skin-mounted accelerometers (SMAs) and lower limb surface electromyography (EMG) recordings during gait.
Methods:
Triaxial SMA and EMG from 4 muscles during level and stair walking in nine healthy and nine knee osteoarthritis (OA) subjects were used. The initial peak acceleration (IPA), root mean square (RMS), maximal acceleration transient rate (ATRmax) and mean EMG activity (EMGact) were calculated. The coefficient of variation (CV) and the intraclass correlation coefficient (ICC) were calculated to measure repeatability.
Results:
The CV and ICC of RMS accelerations ranged from 4.9% to 10.9% and from 0.69 to 0.96 in both study groups during level walking. The CV and ICC of IPA and ATRmax varied from 7.7% to 14.2% and from 0.85 to 0.99 during level and stairs up walking in healthy subjects. The CV and ICC of EMGact ranged from 8.3% to 31.7% and from 0.16 to 0.97 in both study groups.
Conclusions:
RMS accelerations exhibited good repeatability during walking in healthy and knee OA subjects. The repeatability of EMG measurements was acceptable in healthy subjects depending on the measured muscles.
Keywords: Acceleration, Electromyography, Gait, Reliability
Introduction
Gait analysis has clarified itself as an important tool in defining biomechanical factors that may affect the initiation and progression of pathological conditions, such as knee osteoarthritis (OA)[1-5]. In knee OA, gait analysis has mainly focused on investigations into the actual joint moments based on inverse dynamics (e.g. joint moments), showing an increased external adduction knee moment[6-8] and a reduction in the peak knee flexion moment[7] in knee OA compared to healthy subjects. However, these techniques of gait analysis do not permit the assessment of impulsive loadings, which reflects a sudden and cyclic impact to the joint comparing to progressive joint loading and have also been claimed to serve as co-factors in the initiation and progression of knee OA[9,10].
Skin-mounted accelerometers (SMAs) are used to evaluate gait-related movement patterns[11], and have been shown to be a valid method to evaluate tibial acceleration[12]. SMAs are practical for use in clinical gait analysis, because they provide estimates of acceleration that may be used to evaluate knee joint impulsive loading in a non-invasive manner[13,14]. SMAs have been used to investigate the possible differences between healthy and knee OA subjects[9,14-16]. Radin et al.[9] reported that so-called pre-OA patients with intermittent activity-related knee pain demonstrated higher axial tibial acceleration, i.e. higher impacts at heel strike, than their healthy controls. Similarly, Turcot et al.[15] observed that the anterior-posterior acceleration of the knee is higher in OA subjects than in healthy ones. In their study, 12 knee OA patients (62±7 years) and 8 healthy subjects (66±7 years) were evaluated during treadmill walking task at comfortable and high speeds using a three-dimensional gait analyses[15]. The measurements of tibial and femoral linear accelerations and angular velocities were obtained with two triaxial accelerometers and gyroscopes during double-support and swing phase periods[15]. However, Henriksen et al.[16] and Liikavainio et al.[14] detected no difference in peak acceleration at heel strike between knee OA subjects and their healthy controls. In their study, Henriksen et al.[16] investigated 9 knee OA patients with mean age of 68 years and 10 healthy subjects with mean age of 61 years using a three-dimensional gait analyses. The impulse GRF was measured using two force platforms together with peak accelerations at the tibial tuberosity and sacrum using triaxial accelerometers at the heel strike period at a speed of 1.1 m/s[16]. SMAs have also been used to examine the influence of body mass index (BMI) on joint impulsive loading parameters (e.g. initial peak acceleration (IPA) and peak-to-peak (PP) acceleration) in healthy and knee OA subjects[17] and following weight loss after bariatric surgery[18]. Overweight and obese subjects appear to load their lower extremity more than lean individuals on initial foot contact[17], and knee accelerations demonstrate lower impulsive loadings in both axial and horizontal directions after weight loss[18].
SMA measurements must be reproducible if the collected gait data are to be used as an aid in diagnostics, treatment or rehabilitation. However, the reproducibility of acceleration measurements from SMAs attached to the level of the knee joint has only been evaluated in two studies during walking[13,19]. Turcot et al.[19] demonstrated that the reliability (intraclass correlation coefficient (ICC)) of maximal, minimal and range values as well as the root mean square acceleration (RMS) were greater than or equal to 0.75 in knee OA patients during treadmill walking at self-selected and accelerated speeds. Liikavainio et al.[13] reported that IPA and PP acceleration in the resultant axial and horizontal directions achieved good repeatability (CV<15%) during walking at self-selected and constant gait speeds in young healthy subjects. Although moving at the stairs is one of the most common daily living activities, the kinetics of stair walking has been only slightly investigated. It is very difficult to compare the results, because the experimental arrangements often differ each other regarding the inclination of the stairs, steps and test subjects. The reproducibility of acceleration measurements from SMAs attached to the level of the knee joint during stair walking in healthy subjects or in knee OA subjects has never been investigated. It is very important to study the repeatability of gait measurements during stair walking, because stair walking is a much more demanding task and requires more muscle strength than needed for level walking[20]. In addition, the gait asymmetry increases in stair ambulation, especially in stair descent[21].
In addition to SMAs, electromyography (EMG) measurements have also been used to evaluate possible compensatory mechanisms provided by a neuromuscular system in knee OA[14,22]. Electromyography has been widely used over the past decades in investigating neuromuscular activation of the lower extremities during walking in healthy individuals[23-25] and in knee OA subjects[4,14,22,26-28]. The reliability of surface EMG during level walking is generally well established in healthy subjects. Murley et al. investigated the reliability of surface EMG of the tibialis anterior and medial gastrocnemius, which displayed good to excellent relative reliability in young adults[29]. The reliability of surface EMG recordings was reasonable, as also shown by Kadaba et al.[24]. Jacobson et al.[30] also reported reasonable reproducibility for surface EMG of the vastus medialis and biceps femoris muscles during walking, and Bogey et al.[31] obtained good reliability for surface EMG from the soleus muscle in healthy subjects during level walking. However, as far as we are aware, there have been no published studies on the repeatability of surface EMG in stair walking in healthy subjects, and we found only one study on a knee OA population[22]. Hubley-Kozey et al.[22] investigated the test-retest reliability of surface EMG recordings by using principal pattern scores (PP scores) and co-contraction indices (CCIs) as parameters during walking at a self-selected gait speed. They reported good to excellent ICC (ICC2,k) values between test and retest for all amplitude and temporal knee muscle EMG characteristics from the lateral and medial gastrocnemius, vastus lateralis and medialis, rectus femoris, medial and lateral hamstring muscles[22].
Therefore, the purpose in this study was to investigate the repeatability of SMAs on the level of the knee joint in level walking and specially in stair walking at a constant gait speed in combination with simultaneous lower limb EMG measurements among healthy subjects and knee OA patients. Firstly, it was hypothesized that SMAs would provide a repeatable method for investigating accelerations during the early stance during level walking in healthy subjects and knee OA patients. Secondly, it was hypothesized, that SMAs would provide a repeatable method for investigating accelerations during the early stance in healthy subjects and knee OA patients during stair walking. Thirdly, it was hypothesized that EMG would be a repeatable method for investigating muscle (i.e. vastus medialis (VM), biceps femoris (BF), tibialis anterior (TA) and gastrocnemius medialis (GM)) activation during the gait cycle.
Materials and methods
Participants
Nine male knee OA patients (mean age 62.7±5.1 years; height 175.0±5.8 cm; body mass 82.4±9.9 kg; body mass index (BMI) 27.0±4.2 kg/m2) and nine young healthy subjects, both male (n=4) and female (n=5) (mean age 22.7±1.4 years; height 172.4±8.5 cm; body mass 65.7±11.0 kg; BMI 22.0±2.0 kg/m2), voluntarily participated in the study. The knee OA patients had experienced pain in the knee region within the previous month and radiographic OA changes had been indicated according to the clinical and radiographic criteria of the American College of Rheumatology[32]. The exclusion criteria for the knee OA patients and the healthy subjects are presented in [Table 1].
Table 1.
Exclusion criteria for the knee OA patients and healthy subjects.
| • A history of previous hip or knee fracture |
| • Surgery of the lower extremities (knee arthroscopy was allowed) |
| • Surgery to the vertebral column |
| • A history of other trauma to the hip joint or in the pelvic region |
| • Symptomatic hip OA |
| • A knee or hip joint infection |
| • Congenital or developmental disease of the lower limbs |
| • Paralysis of the lower extremities |
| • Any disease or medication that might have worsened physical function and interfered with the evaluation of knee pain, such as: |
| − cancer |
| − severe mental disorder |
| − rheumatoid arthritis or spondylarthritis |
| − symptomatic cerebrovascular disease |
| − endocrine disease |
| − epilepsy |
| − Parkinson’s disease |
| − polyneuropathia, neuromuscular disorder |
| − debilitating cardiovascular disease in spite of medication |
| − atherosclerosis of the lower extremities |
| − painful back |
| − corticosteroid medication |
| − symptomatic spinal stenosis |
| − acute sciatic syndrome |
The self-reported disease-specific joint pain was assessed using the Western Ontario and McMaster Universities (WOMAC) Osteoarthritis Index (0-100 mm)[33] before the first testing session. Knee OA subjects had relatively low WOMAC scores for pain (20.7±17.6 mm (mean±SD)).
In knee OA subjects, standard anteroposterior weight-bearing radiographs were taken from both knees. The radiographs were evaluated by a blinded experienced radiologist using the Kellgren and Lawrence grading[34], in which 0 denotes no OA and 4 refers to severe OA. For each patient, the knee with the highest radiographic OA score, or with clinical symptoms if scores were the same, was used for the analysis. According to the radiographic score and pain symptoms of the subjects, four of them had mild knee OA (KL 2), four had moderate knee OA (KL 3) and one subject had severe knee OA (KL 4).
Written consent after receiving detailed information on the study design for participation was obtained from each subject. The Ethics Committee of Kuopio University Hospital approved the study design.
Experimental arrangement
One calibrated triaxial piezoresistive SMA (Meac-x, Mega Electronics Ltd; Kuopio, Finland) was attached tightly to the skin on the medial surface of the proximal tibia at 20% of the distance between the medial malleolus and the medial knee joint space by using a 10-cm-wide adhesive bandage (Fixomull stretch) and straps[13,14,18]. The positive z-axis az was aligned parallel to the straight limb and ax and ay axes were parallel to the horizontal directions. Two trained researchers attached the accelerometer tightly to the skin. At least one study has indicated that the same person does not need to conduct all testing sessions to obtain reliable results[11].
The EMG was recorded according to SENIAM recommendations with bipolar surface Ag-AgCl electrodes (M-00-S, Medicotest A/S, Olstykke, Denmark) from the vastus medialis (VM), biceps femoris (BF), tibialis anterior (TA) and gastrocnemius medialis (GM)[35,36]. The inter-electrode distance (IED) between the recording electrodes was 20 mm. Cross-talk between the muscles was presumed to have only minimal effects on EMG signals because of the relatively small IED[37]. Before the measurements, the skin area was well shaved and alcohol washed to ensure low inter-electrode impedance (<5 kΩ). All the electrode cables were placed under a bandage to avoid interference with the movement of the leg. The SMA and EMG data were collected using a 16-channel portable device (Biomonitor ME6000® T16, Mega Electronics Ltd; Kuopio, Finland), which was fixed with a belt onto each subject’s back. The sampling frequency was 1000 Hz for both SMA and EMG. EMG signals were band-pass filtered with cut-off frequencies of 7 Hz and 500 Hz and amplified by the ME6000 system.
During the experiments, each subject wore tight-fitting spandex trousers and a shirt to facilitate the equipment installation and testing. The same and identical plain shoes without any dampers of the sole, but different size were used for all participants to avoid variations in the shoe absorption effect.
Gait analysis
All subjects walked both along a 15-m walkway and up and down a stairway. The subjects were given about five minutes for warm-up before the measurements to become familiar with the experimental protocol. The same test leader instructed the subjects and carefully carried out the testing procedure. The self-selected walking speed was measured with a pair of photocells in both sessions during level walking and walking up and down stairs. Subsequently, the subjects walked at constant gait speeds of 1.2 m/s and 0.5 m/s along the walkway and the main axis of the stairway (12 steps in total, 30° inclination and 26 cm step depth, 1.85 m stair width), respectively. These are reasonable estimates of the normal gait speed of this study group during both level and stair walking[21,38]. The walkway trials were repeated until six successful measurements were obtained at 1.2 m/s speed. The stairway trials were repeated until three successful measurements were obtained at 0.5 m/s speed. A trial was succeed accepted if the speed was within ±5% of the target speed. The subjects were instructed to walk naturally at a steady speed and to adjust their speed if the target speed was not achieved. Stair-walking measurements for one healthy subject did not succeed because of technical problems resulting from the cable of the sensor malfunction during the measurement. This subject was omitted from the data analysis concerning stair walking. The walking speed was measured using a pair of photocells, which permitted the measurement of 3 gait cycles with 6 consecutive steps on the walkway and five consecutive gait cycles on the stairway for each subject. The trial order was randomized. The same test protocol was repeated after 2 weeks in order to assess the repeatability of the SMA and EMG measurements.
Data reduction and parameters
All data were further analysed with software based on MATLAB R2010a (Mathworks Inc.; MA, USA) developed by the Department of Applied Physics, University of Eastern Finland[13,14,18]. The analysed SMA parameters were the initial peak acceleration (IPA), the maximal acceleration transient rate (ATRmax)[13] and the root mean square acceleration (RMS)[19] (Figure 1). IPA is defined as the peak acceleration following the initial foot contact, and ATRmax is the steepest acceleration slope preceding the IPA. The RMS acceleration characterizes the effective mean acceleration over a certain time frame. In this study, the time frame was around the time point of IPA from -50 milliseconds to 300 milliseconds. It has been evaluated that from time point before the IPA until the midpoint of the stance phase of the gait cycle is the time period (from -50 milliseconds to 300 milliseconds) in which the variation of acceleration signal is the most plentiful. The aim was to capture the whole fluctuating acceleration signal around the time point of IPA to the one RMS parameter. The SMA parameters were determined for axial az, resultant ar, and horizontal resultant  (ML and AP directions) accelerations[13]. The gravitational acceleration g was subtracted from the axial and resultant accelerations.
Figure 1.
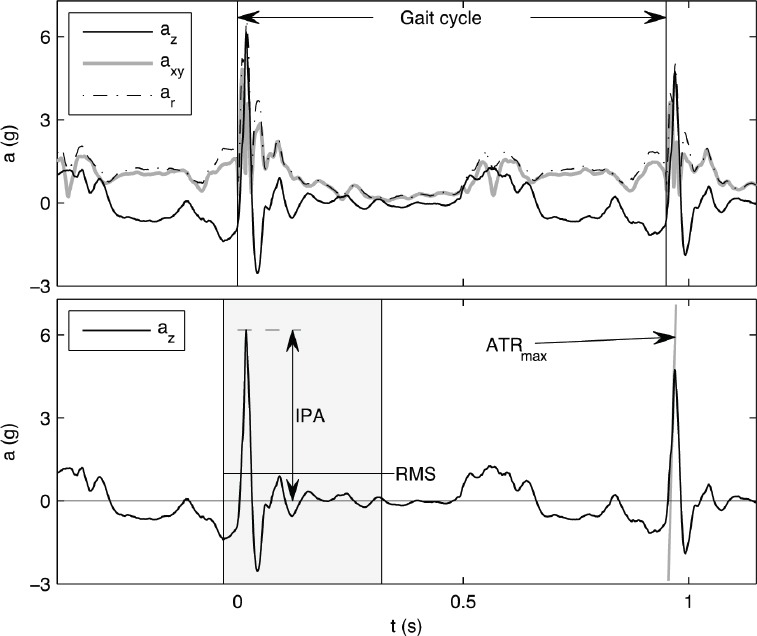
The tibial axial az, horizontal resultant axy and resultant ar accelerations over a normal gait cycle in the upper figure. Definitions of initial peak acceleration (IPA), the root mean square (RMS) and maximal acceleration transient rate (ATRmax) parameters in the axial acceleration (az) are provided in the lower figure.
The mean EMG activation (EMGact; % of maximal motor unit activity) was calculated from the normalized EMG data[35]. All measured EMG signals were then full-wave rectified and averaged as the mean activity over a gait cycle. The EMG activity was normalized to the activation estimate of the EMG signal obtained during walking up stairs at 0.5 m/s. First, a 100% level for each muscle was determined separately, corresponding to the maximum for each muscle activation in the task of walking up stairs. Activation was defined from the EMG signal ensemble average, so that an average activation curve was first obtained, and the maximum value was then determined from this curve.
Statistical analysis
The mean and standard deviation (SD) were calculated. Two-tailed paired t-tests for each parameter were performed to ensure that there was no systematic bias between test sessions 1 and 2[39]. The two-way random ICC model[19,40] ICC2,k was chosen to estimate the repeatability of acceleration and EMG measurements, because ICC2,k takes into account both the systematic and random errors and could be generalized to other estimators[40]. Fleiss’s suggestion of the criteria for clinical acceptability was that ICC< .40 demonstrates poor, .40 >ICC< .75 fair to good, and ICC> .75 an excellent reliability[41]. In this study, only ICC values greater than or equal to 0.75, which reflects the excellent reliability according to Fleiss, were accepted to indicate sufficient repeatability. In addition, the coefficient of variation (CV) was calculated, because it considers variation in the results among subjects in study population, using equation (1)[13] to measure repeatability. The repeatability was considered to be good if the CV was less than 15%[13,42]. In this study, the repeatability was acceptable when the both ICC and CV together fulfilled the above-mentioned terms. All statistical analyses were performed using MATLAB R2010a with Statistics Toolbox (Mathworks Inc.; MA, USA).
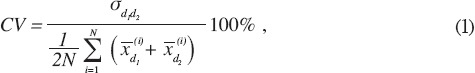
where N is number of subjects and the standard deviation  between measurement days 1 and 2, and
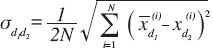
where  is the mean of parameter X from all trials of the ith subject on day dk.
Results
The self-selected gait speeds were 1.41±0.17 m/s, 0.65±0.07 m/s and 0.73±0.11 m/s, respectively, during level walking and walking up and down stairs in the healthy group in the first test session. In the knee OA group in the first test session, the respective self-selected gait speeds were 1.39±0.19 m/s, 0.62±0.08 m/s and 0.66±0.09 m/s during level walking and walking up and down stairs. In general, the self-selected gait speeds did not differ between baseline and follow up measurements, but in OA subjects, the self-selected walking speed was slightly but significantly lower in walking up stairs in the second test session (data not shown).
All knee OA and healthy subjects completed the level walking trials at a constant gait speed of 1.2 m/s ± 5%, and 9 knee OA and 8 healthy subjects completed walking up and down stairs at a gait speed of 0.5 m/s ± 5%. Acceleration parameters, IPA, RMS and ATRmax values in test and retest sessions, as well as CV and ICC values are presented in [Tables 2 and 3], respectively. The EMG parameter values from VM, BF, TA and GM muscles and CV and ICC values are presented in Table 4.
Table 2.
Knee acceleration parameters and the ICC2,k and CV between days during level walking at 1.2 m/s in healthy (n = 9) and knee OA subjects (n = 9).
| Parameters | Healthy | Knee OA | Healthy ICC2,k | Knee OA ICC2,k | Healthy CV (%) | Knee OA CV (%) | ||
|---|---|---|---|---|---|---|---|---|
| Acc test (g) | Acc retest (g) | Acc test (g) | Acc retest (g) | |||||
| IPAaz | 0.97±0.22# | 0.96±0.22 | 1.44±0.37 | 1.49±0.40 | 0.94 | 0.65 | 7.7 | 17.8 |
| IPAar | 1.24±0.23 | 1.32±0.36 | 1.65±0.45 | 1.73±0.49 | 0.69 | 0.53 | 15.9 | 21.7 |
| IPAaxy | 1.35±0.27 | 1.43±0.44 | 1.54±0.29 | 1.58±0.38 | -0.78 | 0.63 | 27.7 | 15.4 |
| RMSaz | 0.29±0.06 | 0.29±0.05 | 0.39±0.08 | 0.39±0.08 | 0.96 | 0.84 | 4.9 | 10.3 |
| RMSar | 0.37±0.05 | 0.38±0.06 | 0.46±0.08 | 0.47±0.09 | 0.71 | 0.79 | 9.9 | 10.9 |
| RMSaxy | 0.57±0.08 | 0.56±0.08 | 0.68±0.10 | 0.69±0.09 | 0.69 | 0.75 | 9.2 | 8.4 |
| ATRmax az | 74.6±19.8 | 70.5±17.5 | 100.7±36.9 | 105.0±43.6 | 0.85 | 0.63 | 13.2 | 27.9 |
| ATRmax ar | 85.4±20.6 | 94.0±31.6 | 122.1±50.3 | 130.6±63.2 | 0.67 | 0.58 | 20.7 | 33.9 |
Values are mean ± SD. Abbreviations: n, number of subjects; SD, standard deviation; Acc, acceleration; g, gravitational acceleration; az, axial; ar, resultant acceleration; axy, horizontal resultant acceleration (mediolateral (ML) and anteroposterior (AP) directions); IPA, initial peak acceleration; RMS, root mean square acceleration; ATRmax, maximal acceleration transient rate; ICC2.k, 2-way random ICC model; CV, coefficient of variation. The repeatability was good if the ICC2,k values were greater than or equal to 0.75 and CV values were less than 15%.
Table 3.
Knee acceleration parameters and the ICC2,k and CV between days during walking up and down stairs at 0.5 m/s gait speeds in healthy (n = 8) and knee OA subjects (n = 9).
| Parameters | Healthy | Knee OA | Healthy ICC2,k | Knee OA ICC2,k | Healthy CV (%) | Knee OA CV (%) | ||
|---|---|---|---|---|---|---|---|---|
| Acc test (g) | Acc retest (g) | Acc test (g) | Acc retest (g) | |||||
| Up stairs 0.5 m/s | ||||||||
| IPAaz | 0.85±0.72# | 0.86±0.55 | 1.77±1.21 | 1.84±1.22 | 0.98 | 0.93 | 14.2 | 24.3 |
| IPAar | 1.08±0.67 | 1.08±0.47 | 1.95±1.20 | 2.10±1.17 | 0.93 | 0.91 | 18.9 | 23.7 |
| IPAaxy | 1.26±0.27 | 1.24±0.21 | 1.49±0.36 | 1.73±0.37 | -0.91 | 0.49 | 20.2 | 20.1 |
| RMSaz | 0.27±0.13 | 0.27±0.10 | 0.44±0.21 | 0.47±0.19 | 0.95 | 0.88 | 13.8 | 20.5 |
| RMSar | 0.30±0.13 | 0.30±0.07 | 0.42±0.20 | 0.48±0.17 | 0.87 | 0.86 | 16.3 | 20.2 |
| RMSaxy | 0.65±0.07 | 0.64±0.04 | 0.71±0.09 | 0.73±0.10 | 0.73 | 0.74 | 5.7 | 8.3 |
| ATRmax az | 79.1±55.0 | 79.5±53.3 | 193.2±158.9 | 199.8±143.7 | 0.99 | 0.92 | 10.9 | 29.3 |
| ATRmax ar | 80.5±54.9 | 81.5±48.8 | 187.2±156.4 | 178.9±126.1 | 0.99 | 0.93 | 10.8 | 28.1 |
| Down stairs 0.5 m/s | ||||||||
| IPAaz | 1.07±0.41 | 1.14±0.42 | 2.29±0.94 | 2.03±0.90 | 0.86 | 0.89 | 18.4 | 19.4 |
| IPAar | 1.21±0.44 | 1.33±0.56 | 2.51±1.02 | 2.29±0.93 | 0.79 | 0.90 | 23.2 | 17.3 |
| IPAaxy | 1.15±0.35 | 1.19±0.46 | 1.68±0.36 | 1.63±0.41 | 0.87 | 0.76 | 16.9 | 14.1 |
| RMSaz | 0.35±0.10 | 0.38±0.07 | 0.54±0.12 | 0.48±0.13 | 0.65 | 0.69 | 16.4 | 17.3 |
| RMSar | 0.42±0.11 | 0.45±0.09 | 0.63±0.16 | 0.58±0.15 | 0.62 | 0.78 | 17.0 | 15.1 |
| RMSaxy | 0.54±0.07 | 0.56±0.13 | 0.73±0.12 | 0.70±0.13 | 0.77 | 0.79 | 11.1 | 10.1 |
| ATRmax az | 65.9±25.3 | 69.95±29.2 | 187.4±122.4 | 182.8±108.4 | 0.85 | 0.96 | 20.3 | 16.9 |
| ATRmax ar | 79.9±31.5 | 84.67±56.4 | 197.3±123.1 | 201.16±115.09 | 0.82 | 0.96 | 30.0 | 16.4 |
Values are mean ± SD. Abbreviations: n, number of subjects; SD, standard deviation; Acc, acceleration; g, gravitational acceleration; az, axial; ar, resultant acceleration; axy, horizontal resultant acceleration (mediolateral (ML) and anteroposterior (AP) directions); IPA, initial peak acceleration; RMS, root mean square acceleration; ATRmax, maximal acceleration transient rate; ICC2.k, 2-way random ICC model; CV, coefficient of variation. The repeatability was good if the ICC2,k values were greater than or equal to 0.75 and CV values were less than 15%.
Table 4.
Surface EMG activation values in separate muscles and the ICC2,k and CV between days during level walking at 1.2 m/s gait speed and walking up and down stairs at 0.5 m/s gait speed in healthy (n = 9) and knee OA subjects (n = 9).
| Parameters | Healthy | Knee OA | Healthy ICC2,k | Knee OA ICC2,k | Healthy CV (%) | Knee OA CV (%) | ||
|---|---|---|---|---|---|---|---|---|
| EMGact test (%) | EMGact retest (%) | EMGact test (%) | EMGact retest (%) | |||||
| Level 1.2 m/s | ||||||||
| VM | 22.44±4.26# | 22.19±6.21 | 19.31±5.11 | 19.45±4.65 | 0.77 | 0.64 | 14.2 | 17.8 |
| BF | 21.26±4.26 | 22.20±5.82 | 29.72±7.75 | 26.85±7.51 | 0.84 | 0.43 | 12.1 | 22.6 |
| TA | 36.62±13.85 | 36.26±12.86 | 33.13±6.70 | 36.52±8.99 | 0.86 | 0.69 | 17.9 | 16.0 |
| GM | 21.18±4.07 | 21.23±5.72 | 25.31±7.81 | 26.36±8.15 | 0.59 | 0.94 | 17.2 | 10.2 |
| Up stairs 0.5 m/s | ||||||||
| VM | 20.16±2.14 | 19.79±2.56 | 26.71±4.50 | 23.09±4.31 | 0.64 | 0.68 | 8.3 | 14.1 |
| BF | 29.69±9.15 | 30.86±12.87 | 42.17±9.89 | 39.98±8.26 | 0.92 | 0.58 | 14.1 | 16.7 |
| TA | 41.63±11.16 | 41.61±10.68 | 37.15±6.40 | 41.18±9.69 | 0.91 | 0.77 | 10.6 | 13.4 |
| GM | 22.84±7.28 | 22.04±8.04 | 25.15±5.74 | 22.50±7.53 | 0.97 | 0.83 | 8.8 | 15.5 |
| Down stairs 0.5 m/s | ||||||||
| VM | 27.68±3.75 | 24.42±5.42 | 34.51±5.77 | 31.35±6.15 | 0.16 | 0.69 | 18.2 | 13.0 |
| BF | 25.86±8.23 | 23.07±5.85 | 33.37±11.18 | 31.56±3.80 | -0.96 | 0.23 | 31.7 | 22.7 |
| TA | 26.65±10.76 | 22.98±10.19 | 25.17±5.12 | 29.17±5.12 | 0.91 | 0.44 | 17.7 | 17.7 |
| GM | 24.45±3.42 | 23.57±7.48 | 29.38±7.12 | 26.63±7.03 | 0.17 | 0.31 | 21.8 | 22.6 |
Values are mean ± SD. Abbreviations: n, number of subjects; EMGact, the mean EMG activation (% from maximal motor unit activity) were calculated from the normalized EMG data; VM, vastus medialis muscle; BF, biceps femoris muscle; TA, tibialis anterior muscle; GM, gastrocnemius medialis muscle; ICC2,k, 2-way random ICC model; CV, coefficient of variation. The repeatability was good if the ICC2,k values were greater than or equal to 0.75 and CV values were less than 15%.
Repeatability of SMAs
Healthy subjects
RMS in the az direction exhibited good test-retest repeatability according to both the CV (range, 4.9% to 13.8%) and ICC (range, 0.95 to 0.96) during level walking and walking up stairs. The ICC and CV of IPA in the az were 0.94 to 0.98 and 7.7% to 14.2%, respectively, during level walking and walking up stairs, showing acceptable repeatability. The ICC and CV of ATRmax in az during level walking and walking up stairs, and in ar during walking up stairs were 0.85 to 0.99 and 10.8% to 13.2%, showing good repeatability. The ICC and CV of ATRmax in ar during walking up stairs were good.
Knee OA subjects
RMS parameters in az and ar as well as axy exhibited good test-retest repeatability according to both the CV (range 8.4% to 10.9%) and ICC (range 0.75 to 0.84) during level walking. In addition, the ICC and CV of the RMS in axy were 0.74 to 0.79 and 8.3% to 10.1%, respectively, during stair walking. The repeatability of IPA in axy during walking down stairs was good according to the ICC (0.76) and CV (14.1%).
Repeatability of EMG
Healthy subjects
EMGact in VM and BF exhibited good repeatability according to both the CV (range 12.1% to 14.2%) and ICC (range 0.77 to 0.84) in level walking. EMGact in BF, TA and GM during walking up stairs achieved excellent repeatability according to both the CV (range 8.8% to 14.1%) and ICC (range 0.91 to 0.97). The repeatability of EMGact was poor during walking down stairs. Healthy group ensemble average waveforms for VM, BF, TA and GM muscles illustrate changes in EMG activity as an average over the entire gait cycle during level and stair walking at test and re-test sessions (Figure 2).
Figure 2.
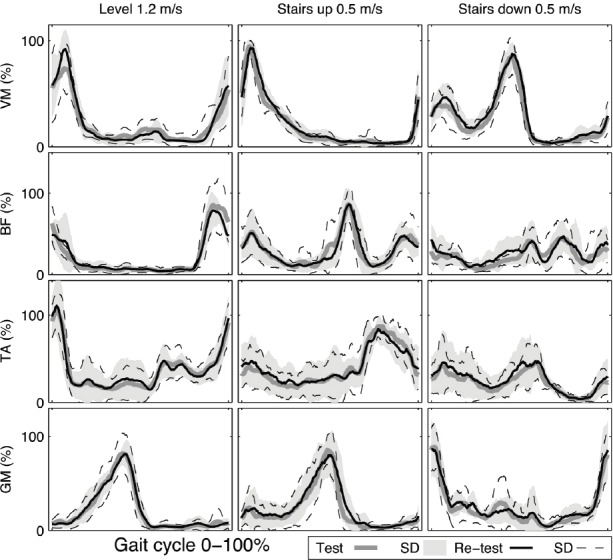
Healthy group ensemble average waveforms for vastus medialis (VM), biceps femoris (BF), tibialis anterior (TA) and gastrocnemius medialis (GM) muscles activation (%) as an average over the entire gait cycle during level and stair walking at test and re-test sessions.
Knee OA subjects
The ICC and CV of EMGact in GM were 0.94 and 10.2%, respectively, during level walking. The EMGact in TA exhibited good repeatability according to both the CV (13.4%) and ICC (0.77) in walking up stairs. Overall, the repeatability of EMGact during walking down stairs was not acceptable. Knee OA group ensemble average waveforms for VM, BF, TA and GM muscles illustrate changes in EMG activity as an average over the entire gait cycle during level and stair walking at test and re-test sessions (Figure 3).
Figure 3.
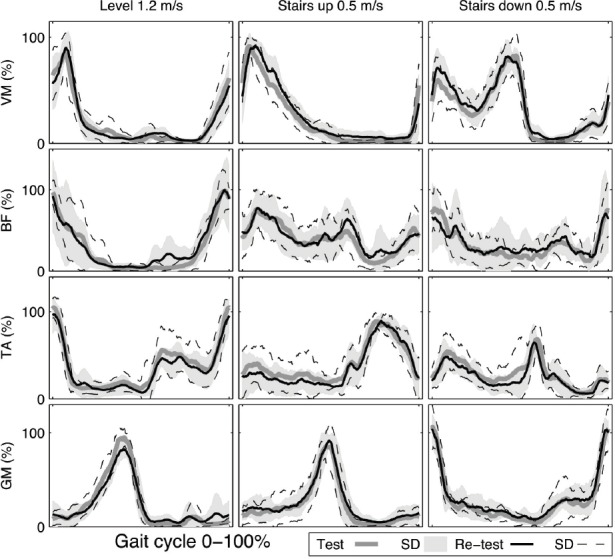
Knee osteoarthritis (OA) group ensemble average waveforms for vastus medialis (VM), biceps femoris (BF), tibialis anterior (TA) and gastrocnemius medialis (GM) muscles activation (%) as an average over the entire gait cycle during level and stair walking at test and re-test sessions.
Discussion
The purpose of this study was to investigate the repeatability of SMAs in measuring impulsive loading in level and stair walking at a constant gait speed in combination with simultaneous lower limb EMG measurements among healthy subjects and knee OA patients in clinical research. In healthy subjects, the test-retest repeatability of IPA, RMS and ATRmax accelerations was acceptable in the axial direction during level walking and walking up stairs. In knee OA subjects, only the RMS accelerations during level walking exhibited good repeatability. The repeatability of accelerations during stair walking was not acceptable in knee OA subjects. The repeatability of EMG measurements was acceptable, depending on the measured muscle, during level and stair walking in healthy subjects, but not in knee OA subjects.
The results of our study are partly consistent with the findings of Liikavainio et al.[13] and Turcot et al.[19], showing that the repeatability of the IPA and RMS is good, especially during level walking. Based on these above-mentioned studies and our study, it is apparent that RMS accelerations and IPA in different directions calculated from accelerometer data during level walking are reliable across testing sessions in healthy individuals, but only the RMS acceleration is reliable in knee OA subjects. Although the RMS value is relatively easy to use and it appears to be the most constant parameter, we have to take into account that it is not necessarily sensitive to large distinctive variations and might therefore underestimate the true impulsive loading rate. In addition, in knee OA patients, the RMS acceleration could overlook the effects of symptom variation between test and retest sessions, because the RMS is considered as a calculatory value. However, it seems that RMS parameter during level walking could best evaluate the possible group differences based on the higher absolute acceleration values of RMS parameter in knee OA subjects compared to healthy subjects and values of the reliability. In our view, peak accelerations, i.e. IPA, could have a greater potential to define the knee OA gait pattern, because they are more sensitive parameters, although they do not appear to be as stable as RMS acceleration. The peak accelerations are better able to observe the distinctive variations in acceleration, i.e. possible fluctuation in knee OA symptoms such as knee pain. This could be partly explained by a poor repeatability of peak accelerations in knee OA patients in our study. In addition, during stair walking, which is more demanding task compared to level walking, the fluctuation in knee OA symptoms could have affected even more a poor repeatability of accelerations. Liikavainio et al.[13] demonstrated that the reliability of ATRmax parameters was generally not acceptable. In contrast, the repeatability of ATRmax in az was good in healthy subjects in the present study. However, because of the differences in the study population and protocol, no direct comparison can be made with results of this study.
There is no clear consensus on the best attachment site for SMAs close to the knee joint. Turcot et al.[19] found no significant differences in the reliability of acceleration between tibial and femoral segments. Liikavainio et al.[13] reported that the reliability of loading measurements (i.e. IPA and PP) below the knee was better compared to the corresponding SMA located above the knee. They concluded that the soft tissue beneath the SMA above the knee is obviously thicker, which might cause vibration and other soft tissue artefacts in the SMA sensor, causing variation in reliability[13]. In the present study, the acceleration was only measured in one location, below the knee joint, where the soft tissue thickness is generally small despite a possible high BMI[18]. The poor repeatability of IPA and ATRmax in knee OA patients could partly be explained by the change in gait style provoked by knee pain, which might cause more vibration in the SMA sensor between testing sessions. Our results also showed that actual peak acceleration, i.e. IPA and ATRmax values in knee OA patients were higher than in healthy ones. The higher impact loading could contribute a little vibration to the sensor, resulting in lower reliability in the measurement of certain loading parameters[13].
The measurement of EMG in human walking is an important method in clinical gait analysis. The EMG activity of individual muscles is dependent not only on walking speed, age and body size, but also on a number of technical factors included in EMG collection. The reliability of EMG depends on these above-mentioned factors, but also on the measured muscle and study protocol. In our study, a reasonable repeatability of EMG was achieved in healthy subjects during level walking and walking up stairs. Murley et al.[29] reported moderate to excellent values for RMS parameters in the tibialis anterior and medial gastrocnemius muscles in healthy young adults during walking at two self-selected speeds. Our results appear to be quite similar to those of Murley et al.[29], but no direct comparison can be made because of the different study protocol.
The repeatability of EMG measurements in knee OA patients was not acceptable. Non-repeatable EMG data would be expected if kinetic variables were not consistent in the knee OA group. Our results differ from the study results of Hubley-Kocey et al.[22], who found good to excellent ICC2,k values for PP scores and CCI values in EMG recordings in the lateral and medial gastrocnemius, vastus lateralis and medialis, rectus femoris, medial and lateral hamstrings during walking at a self-selected gait speed. However, both the measured EMG parameters and also the study population were different. Only men were included in our study, while and Hubley-Kocey et al. investigated both men and women. In addition, some of the clinical characteristics of the subjects (e.g. BMI and WOMAC pain level) differed between these studies. Thus, no direct comparison can be made between the results of these studies. The fluctuation in knee OA pain symptoms could partly explain the poor reliability of peak accelerations in our study, although the knee pain was mild in knee OA subjects during the first testing session. In this study, the knee OA group included KL grades from 2-4, which means that the knee OA subjects might have been quite variable in relation to the structural progression of the disease. This could partly explain the non-acceptable repeatability of EMG measurements and also the poor repeatability of the IPA and ATRmax in knee OA patients. The severity of knee OA itself does not have a major effect on gait when keeping the gait speed constant[14]. Liikavainio et al.[14] reported that disease severity does not affect IPA and PP during walking at a constant gait speed. On the other hand, Astephen et al.[4] reported that gait and neuromuscular pattern differences did progress as a function of knee OA severity during walking at a self-selected speed. Rutherford et al.[28] reported that increasing level of knee OA severity have an effect on the specific amplitude and temporal knee joint muscle activation patterns in a systematic manner during walking at self-selected gait speed.
Repeatability indicates the consistency of measurements. The test-retest repeatability was calculated using two different statistical parameters, the ICC and CV. The repeatability is composed of the repeatability of the measurement procedure and the biological variation in the study groups. The selection of the statistical parameters is dependent on the study protocol and especially on the studied parameters. It has been suggested that ICC values have fair to excellent clinical acceptability if 0.40>ICC>0.75[41]. The CV values must be below 15% if the repeatability of measurements is good[42]. Although most of the ICC values were good in this study, using only the ICC allows an overestimation of the repeatability. In this study, the lower repeatability according to the CV compared to the higher repeatability according to the ICC can be explained by the fact that these two values of the repeatability do not measure the same feature. ICC is viewed as a type of correlation and describes how strongly the units of measure in the same group resemble each other[39]. ICC reflects the relative reliability, which is the degree to which two or more sets of measures are maintained over repeated measurements[43]. The relative nature of the ICC indicates that the magnitude of an ICC is dependent on the between-subject variability, meaning that if subjects are slightly different from each other, ICC values will be small, even if trial-to-trial variability is low[40]. On the other hand, if subjects greatly differ from each other, ICC values can be high, even if trial-to-trial variability is high[40]. Thus, the ICC for the measurements is content specific[40]. There are at least six ways to calculate ICC. In this study, the ICC2,k was chosen, because it is suitable for two-way random average measures. The CV describes the width of variability in relation to the mean of the population[39]. It reflects absolute reliability, which is the degree to which repeated measurements vary for individuals within a group[43], i.e. the less they vary, the higher the repeatability. The CV value can guarantee that measurement trials of each subject are close to each other. However, the CV does not take into account the direction of differences, and the difference between measurements could thus be inconsistent. Most studies have used either the CV or ICC to determine repeatability. We chose both the CV and ICC to reduce overestimation of the repeatability.
Study limitations
There were some limitations in this study. The study group was small, including nine knee OA and nine healthy subjects, so one or more participants could impact on the statistics. However, 6 trials, each consisting of 3 gait cycles on the walkway and 3 trials with 5 cycles in each on the stairs, were compiled to form a representative profile of gait. To obtain reliable results, it is suggested to collect at least two or more trials in gait studies[44]. The control subjects were young and healthy with normal gait, but the knee OA patients were relatively old, and thus the results of the two groups do not equate with each other and should not be generalized to other populations.
The SMAs were used to evaluate knee joint loading. Unfortunately, the knee joint moments, ground reaction forces and gait kinematics, which would have provided a more comprehensive description of walking and joint loading, were not assessed. Our purpose was to develop a simpler method in gait analysis to use in daily clinical practice for diagnostics and rehabilitation. Some confounding factors, such as possible fluctuation in symptoms and the severity of disease, could have had effects on the measured acceleration and EMG parameters in the knee OA subjects. Unfortunately, we did not measure joint pain in the second test session, so it was not possible to evaluate the possible role of joint pain fluctuation.
In this study, constant gait speeds of 1.2 m/s and 0.5 m/s were chosen for level and stair walking, respectively, which are reasonable estimates of the normal gait speed of the study groups[21,38]. Previous studies have demonstrated that walking speed has an influence on most of the biomechanical parameters of gait in healthy subjects, and also in patients with OA, and it is therefore important to control the gait speed[14,45-47]. Zeni et al.[48] reported that a non-controlled, self-selected gait speed caused differences in gait parameters in knee OA, but a controlled gait speed did not. Zeni et al.[49] also reported that walking speed can affect muscle activation in knee OA subjects, but the differences in muscle activation patterns can be also seen when analysing the results with respect to speed. They suggested that differences in muscle activation patterns in OA subjects are related to intrinsic differences[49]. In our study, the gait parameter changes were compared individually, so the use of a constant speed did permit a reasonable comparison between the test and re-test measurements, and thereby eliminated the potential effects arising from different gait speeds. In addition, the selected gait speeds for level and stair walking were achievable and suitable for all knee OA and healthy subjects. We consider it is important to use a standardized gait speed to reduce differences in gait and EMG activation patterns that might be related to a self-selected gait speed. If standardized gait speeds are not used, it is difficult to undertake intra- and inter-individual comparisons and define the true changes in gait affected by knee OA[14].
There is no consensus on the method for EMG normalization. Hubley-Kozey et al.[22] used maximal voluntary isometric activation to normalize EMG parameters. According to Burden et al.[50], EMG normalization to the maximal voluntary isometric activations is the best approach. In our study, EMG normalization was not made to the maximum isometric contraction, because among knee OA patients, knee pain could have interfered with the strength measurement and thus the maximum EMG. EMG was normalized to the activation estimate of the maximum EMG signal obtained during walking up stairs at 0.5 m/s, which would take the reflex function into account. Our EMG normalization method is supported by Benoit et al.[51], who reported that methods of normalizing EMG to the maximum isometric contraction or to the maximum EMG amplitude during gait were equivalent in patients with anterior cruciate ligament injuries.
Conclusions
A study protocol that used a standardized walking speed of 1.2 m/s demonstrated that axial IPA, RMS and ATRmax acceleration parameters were reliable in young healthy subjects. Using the same protocol, only the RMS acceleration was reliable in knee OA patients. During stair walking the repeatability of acceleration parameters were broadly poor in both knee OA patients and healthy subjects. Using EMG amplitudes normalized to the activation estimate of the maximum EMG signal obtained during walking up stairs at 0.5 m/s, selected measures of mean muscle activation had acceptable repeatability in healthy subjects, but not for knee OA subjects. Future studies on repeatability could concentrate more carefully on planning the optimal study design that would enable generalisation of the findings from different study populations. This could help in developing a reliable and efficient method for diagnostics and rehabilitation in different pathological conditions during walking.
Acknowledgements
This study has been supported by the strategic funding of the University of Eastern Finland.
Footnotes
Edited by: F. Rauch
References
- 1.Chang A, Hayes K, Dunlop D, et al. Thrust during ambulation and the progression of knee osteoarthritis. Arthritis Rheum. 2004;50:3897–3903. doi: 10.1002/art.20657. [DOI] [PubMed] [Google Scholar]
- 2.Miyazaki T, Wada M, Kawahara H, Sato M, Baba H, Shimada S. Dynamic load at baseline can predict radiographic disease progression in medial compartment knee osteoarthritis. Ann Rheum Dis. 2002;61:617–622. doi: 10.1136/ard.61.7.617. [DOI] [PMC free article] [PubMed] [Google Scholar]
- 3.Lynn SK, Reid SM, Costigan PA. The influence of gait pattern on signs of knee osteoarthritis in older adults over a 5-11 year follow-up period: A case study analysis. Knee. 2007;14:22–28. doi: 10.1016/j.knee.2006.09.002. [DOI] [PubMed] [Google Scholar]
- 4.Astephen JL, Deluzio KJ, Caldwell GE, Dunbar MJ, Hubley-Kozey CL. Gait and neuromuscular pattern changes are associated with differences in knee osteoarthritis severity levels. J Biomech. 2008;41:868–876. doi: 10.1016/j.jbiomech.2007.10.016. [DOI] [PubMed] [Google Scholar]
- 5.Kaufman KR, Hughes C, Morrey BF, Morrey M, An KN. Gait characteristics of patients with knee osteoarthritis. J Biomech. 2001;34:907–915. doi: 10.1016/s0021-9290(01)00036-7. [DOI] [PubMed] [Google Scholar]
- 6.Brostrom EW, Esbjornsson AC, von Heideken J, Iversen MD. Gait deviations in individuals with inflammatory joint diseases and osteoarthritis and the usage of three-dimensional gait analysis. Best Pract Res Clin Rheumatol. 2012;26:409–422. doi: 10.1016/j.berh.2012.05.007. [DOI] [PubMed] [Google Scholar]
- 7.Mills K, Hunt MA, Ferber R. Biomechanical deviations during level walking associated with knee osteoarthritis: A systematic review and meta-analysis. Arthritis Care Res (Hoboken) 2013;65:1643–65. doi: 10.1002/acr.22015. [DOI] [PubMed] [Google Scholar]
- 8.Landry SC, McKean KA, Hubley-Kozey CL, Stanish WD, Deluzio KJ. Knee biomechanics of moderate OA patients measured during gait at a self-selected and fast walking speed. J Biomech. 2007;40:1754–1761. doi: 10.1016/j.jbiomech.2006.08.010. [DOI] [PubMed] [Google Scholar]
- 9.Radin EL, Yang KH, Riegger C, Kish VL, O’Connor JJ. Relationship between lower limb dynamics and knee joint pain. J Orthop Res. 1991;9:398–405. doi: 10.1002/jor.1100090312. [DOI] [PubMed] [Google Scholar]
- 10.Brandt KD, Radin EL, Dieppe PA, van de Putte L. Yet more evidence that osteoarthritis is not a cartilage disease. Ann Rheum Dis. 2006;65:1261–1264. doi: 10.1136/ard.2006.058347. [DOI] [PMC free article] [PubMed] [Google Scholar]
- 11.Kavanagh JJ, Morrison S, James DA, Barrett R. Reliability of segmental accelerations measured using a new wireless gait analysis system. J Biomech. 2006;39:2863–2872. doi: 10.1016/j.jbiomech.2005.09.012. [DOI] [PubMed] [Google Scholar]
- 12.Nokes L, Fairclough JA, Mintowt-Czyz WJ, Mackie I, Williams J. Vibration analysis of human tibia: The effect of soft tissue on the output from skin-mounted accelerometers. J Biomed Eng. 1984;6:223–226. doi: 10.1016/0141-5425(84)90107-9. [DOI] [PubMed] [Google Scholar]
- 13.Liikavainio T, Bragge T, Hakkarainen M, Jurvelin JS, Karjalainen PA, Arokoski JP. Reproducibility of loading measurements with skin-mounted accelerometers during walking. Arch Phys Med Rehabil. 2007;88:907–915. doi: 10.1016/j.apmr.2007.03.031. [DOI] [PubMed] [Google Scholar]
- 14.Liikavainio T, Bragge T, Hakkarainen M, Karjalainen PA, Arokoski JP. Gait and muscle activation changes in men with knee osteoarthritis. Knee. 2010;17:69–76. doi: 10.1016/j.knee.2009.05.003. [DOI] [PubMed] [Google Scholar]
- 15.Turcot K, Aissaoui R, Boivin K, Pelletier M, Hagemeister N, de Guise JA. Three-dimensional pattern of knee linear accelerations during treadmill walking on an asymptomatic and osteoarthritis populations. Gait posture. 2006;24:144–146. [Google Scholar]
- 16.Henriksen M, Simonsen EB, Graven-Nielsen T, Lund H, Danneskiold-Samsoe B, Bliddal H. Impulse-forces during walking are not increased in patients with knee osteoarthritis. Acta Orthop. 2006;77:650–656. doi: 10.1080/17453670610012747. [DOI] [PubMed] [Google Scholar]
- 17.Lyytinen T, Bragge T, Liikavainio T, Vartiainen P, Karjalainen PA, Arokoski JP. The impact of obesity and weight loss on gait in adults. In: Gefen A, editor. Studies in mechanobiology, tissue engineering and biomaterials. Berlin Heidelberg: Springer-Verlag; 2014. pp. 125–147. [Google Scholar]
- 18.Bragge T, Lyytinen T, Hakkarainen M, et al. Lower impulsive loadings following intensive weight loss after bariatric surgery in level and stair walking: A preliminary study. Knee. 2014;21:534–540. doi: 10.1016/j.knee.2013.11.012. [DOI] [PubMed] [Google Scholar]
- 19.Turcot K, Aissaoui R, Boivin K, Hagemeister N, Pelletier M, de Guise JA. Test-retest reliability and minimal clinical change determination for 3-dimensional tibial and femoral accelerations during treadmill walking in knee osteoarthritis patients. Arch Phys Med Rehabil. 2008;89:732–737. doi: 10.1016/j.apmr.2007.09.033. [DOI] [PubMed] [Google Scholar]
- 20.Larsen AH, Sorensen H, Puggaard L, Aagaard P. Biomechanical determinants of maximal stair climbing capacity in healthy elderly women. Scand J Med Sci Sports. 2009;19:678–686. doi: 10.1111/j.1600-0838.2008.00845.x. [DOI] [PubMed] [Google Scholar]
- 21.Stacoff A, Diezi C, Luder G, Stussi E, Kramers-de Quervain IA. Ground reaction forces on stairs: Effects of stair inclination and age. Gait Posture. 2005;21:24–38. doi: 10.1016/j.gaitpost.2003.11.003. [DOI] [PubMed] [Google Scholar]
- 22.Hubley-Kozey CL, Robbins SM, Rutherford DJ, Stanish WD. Reliability of surface electromyographic recordings during walking in individuals with knee osteoarthritis. J Electromyogr Kinesiol. 2013;23:334–341. doi: 10.1016/j.jelekin.2012.12.002. [DOI] [PubMed] [Google Scholar]
- 23.Winter DA, Yack HJ. EMG profiles during normal human walking: Stride-to-stride and inter-subject variability. Electroencephalogr Clin Neurophysiol. 1987;67:402–411. doi: 10.1016/0013-4694(87)90003-4. [DOI] [PubMed] [Google Scholar]
- 24.Kadaba MP, Ramakrishnan HK, Wootten ME, Gainey J, Gorton G, Cochran GV. Repeatability of kinematic, kinetic, and electromyographic data in normal adult gait. J Orthop Res. 1989;7:849–860. doi: 10.1002/jor.1100070611. [DOI] [PubMed] [Google Scholar]
- 25.Burnett DR, Campbell-Kyureghyan NH, Cerrito PB, Quesada PM. Symmetry of ground reaction forces and muscle activity in asymptomatic subjects during walking, sit-to-stand, and stand-to-sit tasks. J Electromyogr Kinesiol. 2011;21:610–615. doi: 10.1016/j.jelekin.2011.03.006. [DOI] [PubMed] [Google Scholar]
- 26.Hubley-Kozey CL, Deluzio KJ, Landry SC, McNutt JS, Stanish WD. Neuromuscular alterations during walking in persons with moderate knee osteoarthritis. J Electromyogr Kinesiol. 2006;16:365–378. doi: 10.1016/j.jelekin.2005.07.014. [DOI] [PubMed] [Google Scholar]
- 27.Childs JD, Sparto PJ, Fitzgerald GK, Bizzini M, Irrgang JJ. Alterations in lower extremity movement and muscle activation patterns in individuals with knee osteoarthritis. Clin Biomech (Bristol, Avon) 2004;19:44–49. doi: 10.1016/j.clinbiomech.2003.08.007. [DOI] [PubMed] [Google Scholar]
- 28.Rutherford DJ, Hubley-Kozey CL, Stanish WD. Changes in knee joint muscle activation patterns during walking associated with increased structural severity in knee osteoarthritis. J Electromyogr Kinesiol. 2013;23:704–711. doi: 10.1016/j.jelekin.2013.01.003. [DOI] [PubMed] [Google Scholar]
- 29.Murley GS, Menz HB, Landorf KB, Bird AR. Reliability of lower limb electromyography during overground walking: A comparison of maximal- and sub-maximal normalisation techniques. J Biomech. 2010;43:749–756. doi: 10.1016/j.jbiomech.2009.10.014. [DOI] [PubMed] [Google Scholar]
- 30.Jacobson WC, Gabel RH, Brand RA. Surface vs. fine-wire electrode ensemble-averaged signals during gait. J Electromyogr Kinesiol. 1995;5:37–44. doi: 10.1016/s1050-6411(99)80004-2. [DOI] [PubMed] [Google Scholar]
- 31.Bogey R, Cerny K, Mohammed O. Repeatability of wire and surface electrodes in gait. Am J Phys Med Rehabil. 2003;82:338–344. doi: 10.1097/01.PHM.0000064717.90796.7A. [DOI] [PubMed] [Google Scholar]
- 32.Altman R, Asch E, Bloch D, et al. Development of criteria for the classification and reporting of osteoarthritis. Classification of osteoarthritis of the knee. Diagnostic and therapeutic criteria committee of the american rheumatism association. Arthritis Rheum. 1986;29:1039–1049. doi: 10.1002/art.1780290816. [DOI] [PubMed] [Google Scholar]
- 33.Bellamy N, Buchanan WW, Goldsmith CH, et al. Validation study of WOMAC: A health status instrument for measuring clinically important patient relevant outcomes to antirheumatic drug therapy in patients with osteoarthritis of the hip or knee. J Rheumatol. 1988;15:1833–1840. [PubMed] [Google Scholar]
- 34.Kellgren JH, Jeffrey MR, Ball J. The epidemiology of chronic rheumatism. Ann Rheum Dis. 1964;23:81–82. [Google Scholar]
- 35.Hermens HJ, Freriks B, Disselhorst-Klug C, Rau G. Development of recommendations for SEMG sensors and sensor placement procedures. J Electromyogr Kinesiol. 2000;10:361–374. doi: 10.1016/s1050-6411(00)00027-4. [DOI] [PubMed] [Google Scholar]
- 36.Lyytinen T, Liikavainio T, Bragge T, Hakkarainen M, Karjalainen PA, Arokoski JP. Postural control and thigh muscle activity in men with knee osteoarthritis. J Electromyogr Kinesiol. 2010;20:1066–1074. doi: 10.1016/j.jelekin.2010.05.005. [DOI] [PubMed] [Google Scholar]
- 37.Winter DA, Fuglevand AJ, Archer SE. Cross-talk in surface electromyography: Theoretical and practical estimates. J Electromyogr Kinesiol. 1994;4:15–26. doi: 10.1016/1050-6411(94)90023-X. [DOI] [PubMed] [Google Scholar]
- 38.Bohannon RW, Williams Andrews A. Normal walking speed: A descriptive meta-analysis. Physiotherapy. 2011;97:182–189. doi: 10.1016/j.physio.2010.12.004. [DOI] [PubMed] [Google Scholar]
- 39.Atkinson G, Nevill AM. Statistical methods for assessing measurement error (reliability) in variables relevant to sports medicine. Sports Med. 1998;26:217–238. doi: 10.2165/00007256-199826040-00002. [DOI] [PubMed] [Google Scholar]
- 40.Weir JP. Quantifying test-retest reliability using the intraclass correlation coefficient and the SEM. J Strength Cond Res. 2005;19:231–240. doi: 10.1519/15184.1. [DOI] [PubMed] [Google Scholar]
- 41.Fleiss JL. The design and analysis of clinical experiments. New York: Wiley; 1986. [Google Scholar]
- 42.Moe-Nilssen R. Test-retest reliability of trunk accelerometry during standing and walking. Arch Phys Med Rehabil. 1998;79:1377–1385. doi: 10.1016/s0003-9993(98)90231-3. [DOI] [PubMed] [Google Scholar]
- 43.Henriksen M, Lund H, Moe-Nilssen R, Bliddal H, Danneskiod-Samsoe B. Test-retest reliability of trunk accelerometric gait analysis. Gait Posture. 2004;19:288–297. doi: 10.1016/S0966-6362(03)00069-9. [DOI] [PubMed] [Google Scholar]
- 44.Monaghan K, Delahunt E, Caulfield B. Increasing the number of gait trial recordings maximises intra-rater reliability of the CODA motion analysis system. Gait Posture. 2007;25:303–315. doi: 10.1016/j.gaitpost.2006.04.011. [DOI] [PubMed] [Google Scholar]
- 45.Perttunen J. Foot loading in normal and pathological walking. University of Jyväskylä; 2002. [Google Scholar]
- 46.Mockel G, Perka C, Labs K, Duda G. The influence of walking speed on kinetic and kinematic parameters in patients with osteoarthritis of the hip using a force-instrumented treadmill and standardised gait speeds. Arch Orthop Trauma Surg. 2003;123:278–282. doi: 10.1007/s00402-003-0513-0. [DOI] [PubMed] [Google Scholar]
- 47.Bejek Z, Paroczai R, Illyes A, Kiss RM. The influence of walking speed on gait parameters in healthy people and in patients with osteoarthritis. Knee Surg Sports Traumatol Arthrosc. 2006;14:612–622. doi: 10.1007/s00167-005-0005-6. [DOI] [PubMed] [Google Scholar]
- 48.Zeni JA, Jr, Higginson JS. Differences in gait parameters between healthy subjects and persons with moderate and severe knee osteoarthritis: A result of altered walking speed? Clin Biomech (Bristol, Avon) 2009;24:372–378. doi: 10.1016/j.clinbiomech.2009.02.001. [DOI] [PMC free article] [PubMed] [Google Scholar]
- 49.Zeni JA, Rudolph K, Higginson JS. Alterations in quadriceps and hamstrings coordination in persons with medial compartment knee osteoarthritis. J Electromyogr Kinesiol. 2010;20:148–154. doi: 10.1016/j.jelekin.2008.12.003. [DOI] [PMC free article] [PubMed] [Google Scholar]
- 50.Burden A. How should we normalize electromyograms obtained from healthy participants? what we have learned from over 25 years of research. J Electromyogr Kinesiol. 2010;20:1023–1035. doi: 10.1016/j.jelekin.2010.07.004. [DOI] [PubMed] [Google Scholar]
- 51.Benoit DL, Lamontagne M, Cerulli G, Liti A. The clinical significance of electromyography normalisation techniques in subjects with anterior cruciate ligament injury during treadmill walking. Gait Posture. 2003;18:56–63. doi: 10.1016/s0966-6362(02)00194-7. [DOI] [PubMed] [Google Scholar]