Abstract
Objective:
To obtain simple models predicting disease evolution at 3 years for a given patient with cerebral autosomal dominant arteriopathy with subcortical infarcts and leukoencephalopathy (CADASIL).
Methods:
Based on data obtained in a prospective study of 236 patients, we built and validated models predicting, at the individual level, 3-year changes in Mini-Mental State Examination (MMSE), Mattis Dementia Rating Scale (MDRS), Trail Making Test version B (TMTB), and modified Rankin Scale (mRS). These models were based on different sets of predictors obtained at baseline, including either clinical data (epidemiologic data and cardiovascular risk factors) or clinical data and quantitative MRI markers (volume of lacunes [LLV], volume of white matter hyperintensities, normalized brain volume [BPF], number of microbleeds). The Bayesian information criterion (BIC) and the coefficient of determination (R2) were used to determine models with the highest predictive ability and the lowest numbers of predictors.
Results:
We obtained validated models with a demonstrated ability to predict, for a given patient, 3-year changes in MMSE, MDRS, TMTB, and mRS (R2 on independent samples: 0.22, 0.12, 0.09, and 0.17, respectively). In all cases, the best models according to R2 and BIC values included only the baseline values of the outcome, of BPF, and of LLV. Inclusion of other potential predictors always led to a loss of generalizability.
Conclusions:
The prediction of 3-year changes in MMSE, MDRS, TMTB, and mRS for a given patient with CADASIL can be obtained using simple models relying only on the initial values of the considered score, BPF, and LLV.
Cerebral autosomal dominant arteriopathy with subcortical infarcts and leukoencephalopathy (CADASIL) is the most frequent hereditary cerebral small vessel disease (SVD), caused by mutations of the NOTCH3 gene.1 In CADASIL, the clinical course appears highly variable. Some patients develop dementia and become heavily disabled around their 50s while others live independently during their 80s.2 Age, male sex, active smoking, brain atrophy, and volume of lacunes are associated with clinical severity and with further clinical worsening,3–5 while associations between other factors, such as blood pressure, number of microbleeds, or volume of white matter hyperintensities, and clinical severity have been inconsistently observed.6,7 Among all these factors, those that actually predict disease evolution for a given patient remain undetermined. Identifying such factors would be useful for patient care and for selection of homogeneous samples in clinical trials.
We hypothesized that in CADASIL, predictive models may help determine whether a given patient is at high risk to deteriorate or, by contrast, is likely to remain stable. For this purpose, we aimed to build, validate, and compare different models based on the smallest number of clinical variables and quantitative MRI markers to predict how cognitive and disability scores of a given patient will change over the next 3 years.
METHODS
Participants.
A total of 290 patients older than 18 years were recruited in a cohort study of patients with CADASIL at Lariboisière (Paris) or Ludwig-Maximilians-Universität (Munich) hospitals, the 2 main referral centers for CADASIL in France and Germany, between October 2003 and September 2010. All participants harbored a typical mutation of the NOTCH3 gene. Of these 290 patients, 236 patients had available data both at baseline and after 3 years of follow-up (14 died, 23 did not come back because of too severe disability or dementia, 9 refused to attend the 3-year evaluation, 3 were lost to follow-up, and 5 more were not evaluated for other reasons). As previously reported, clinical, biological, and MRI data were obtained every 18 months during follow-up.4,8 Global cognitive performances were assessed by the Mini-Mental State Examination (MMSE) and the Mattis Dementia Rating Scale (MDRS), which includes a brief evaluation of executive functions. Processing speed was assessed using part B of the Trail Making Test (TMTB) while global disability was evaluated by the modified Rankin Scale (mRS).4,9–11
Standard protocol approvals, registrations, and patient consents.
A local ethics committee validated the study in both centers. Written informed consent was obtained from the study participant or a close relative if the patient was too severely disabled.
MRI acquisition and image processing.
Details of the MRI protocol are provided as supplemental data at Neurology.org. Volume of lacunes (LLV) and that of white matter hyperintensities of presumed vascular origin (WMHV) as well as number of microbleeds (MBN) were measured in all participants from 3D T1, fluid-attenuated inversion recovery, and T2* sequences, respectively, using validated methods detailed previously and in agreement with the STRIVE criteria.12,13 Brain parenchymal fraction (BPF) was defined as the ratio of brain tissue volume to the intracranial cavity volume.12
Statistical analyses.
The aim of the present study was to answer the following question: “Given the data available today, can I predict using a simple algorithm how the clinical status of this patient will evolve over the next 3 years?” For this purpose, different linear regression models of increasing complexity and capable of predicting, at the individual level, changes in cognitive scores and disability scales (MMSE, MDRS, TMTB, and mRS) between baseline and follow-up were tested. The following variables all obtained at baseline were selected as potential predictors of clinical progression in agreement with previous reports on SVD or CADASIL3,5: clinical scales (MMSE, MDRS, TMTB, and mRS), epidemiologic data (age, sex, level of education), cardiovascular risk factors (smoking habits, systolic and diastolic blood pressure, alcohol consumption, levels of low-density lipoprotein cholesterol, homocysteine, HbA1C, and C-reactive protein), and quantitative MRI markers (BPF, LLV, WMHV, and MBN). A history of stroke was not included as an independent predictor as it was not associated with clinical severity in CADASIL in previous cross-sectional or longitudinal analyses.3,5
Because there is a risk of overfitting with linear regression, which increases with the number of predictors, the models in this study were built using Elastic Net, a penalized linear regression model algorithm, strongly limiting the risk of inclusion of a parameter not actually linked to the clinical progression.14 The hierarchy between the different sets of variables was determined according to their expected strength of association with disease severity in CADASIL.3,5 In model 1, only the baseline value of the considered score was included as a potential predictor (reference model; for instance, for MMSE, this model tested whether baseline MMSE was significantly predicting changes in MMSE during follow-up). In model 2, the 3 potential predictors were the baseline values of the considered score, BPF, and LLV, the 2 MRI markers most consistently related to clinical severity in CADASIL.4,15 In model 3, the 5 potential predictors were the baseline values of the considered score and of all quantitative MRI markers (BPF, LLV, as well as WMHV and MBN, these last 2 variables being inconsistently associated with clinical severity in previous literature in CADASIL4,10,16). In model 4, 15 potential predictors were included: baseline values of the 4 clinical scores, of epidemiologic data, and of cardiovascular risk factors. In model 5, 17 potential predictors were included: baseline values of all predictors of model 4 together with that of BPF and of LLV. In model 6, the 19 potential predictors were baseline values of all clinical scores, epidemiologic data, cardiovascular risk factors, and quantitative MRI markers (table 1).
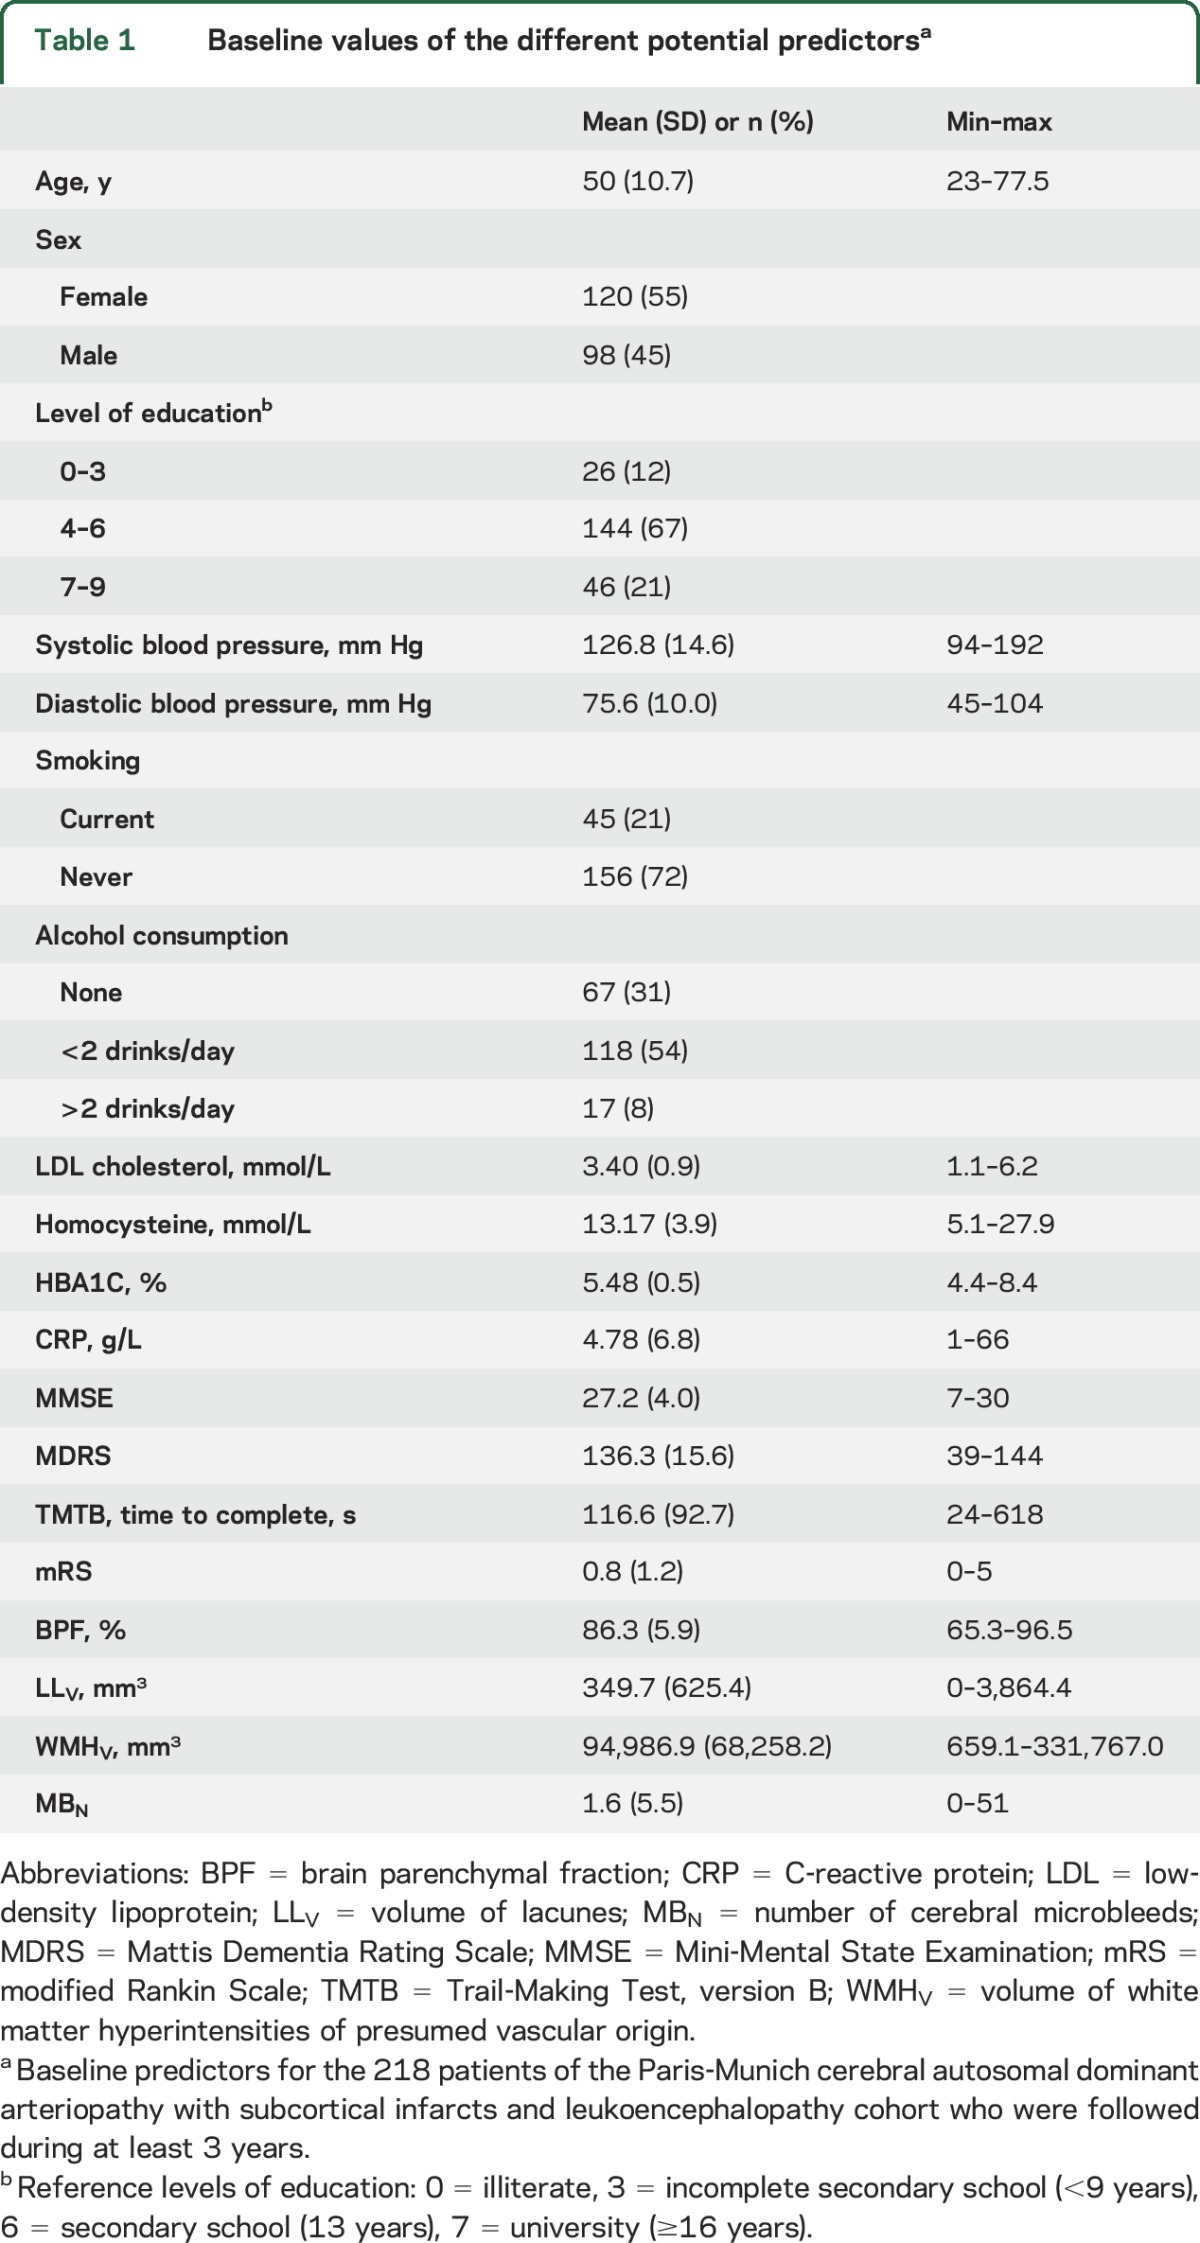
Table 1.
Baseline values of the different potential predictorsa
Because multivariate prediction rules must be evaluated on independent datasets to avoid overly optimistic evaluation of statistical models,17,18 we used a leave-one-out bootstrap resampling with 200 replications to estimate the accuracy of predictive models (see supplemental data for details). Two measures of prediction performances were calculated: the mean squared prediction error (MSPE) and the R2 (coefficient of determination or ratio of explained variance) providing a non-optimistically biased assessment of our model’s performances. Since R2 values were each time estimated on independent samples including only data of patients that were not used to build the predictive models, negative values could be observed. Such values would imply that the model has a lower predictive ability than the simplest model (i.e., the mean change of the score to predict at the cohort level).
Estimates of the 2 prediction measures (MSPE, R2) were obtained by averaging them across bootstrap replications. Standard errors and confidence intervals (CI) were obtained by calculating the SDs as well as the 2.5th and 97.5th percentiles of the bootstrapped distributions.19 The significance of R2 was derived from the CI obtained with bootstrapping: the null hypothesis corresponding to a mean R2 of 0 was rejected when the CI did not include zero. Similarly, the significance of the difference in performance between 2 models was derived from the bootstrapped CI of the difference of performance measures. Finally, Bayesian Information Criterion (BIC) was used to determine the simplest model (with the lowest BIC) among those with significant but similar R2 values.20
As results from linear regression models do not necessarily have a straightforward interpretation, we used recursive partitioning regression tree to determine prediction rules that can be used in daily clinical practice.21,22 We used such algorithms to partition patients into a maximum of 3 subgroups with homogeneous changes during follow-up (will improve, remain stable, or decline) based on the predictors' values. Briefly, this nonparametric multivariate method recursively splits the predictor space into a given number of regions containing observations with similar response values (i.e., clinical change). The algorithm determines the thresholds that identify the different groups through the maximization of an analysis of variance criterion. Additional pruning/merging was applied to the tree to obtain an intuitive rule of the clinical change.
All statistical analyses were performed with R software (https://www.r-project.org). Recursive-partitioning regression trees were built using the rpart R package.
RESULTS
Study population characteristics.
Among the 236 patients for whom a 3-year follow-up period could be achieved at the time of this study, 10 had no available quantitative MRI markers at baseline (5 did not undergo MRI, 5 had MRI of unsuitable quality for complete postprocessing) and 8 were excluded because of a large artery ischemic lesion detected on MRI at baseline, leaving 218 patients for analyses (table 1). Because of missing data in some patients, numbers of patients with full data available for analyses varied depending on the considered score (table e-1).
Predicting changes of clinical status based on linear regression models.
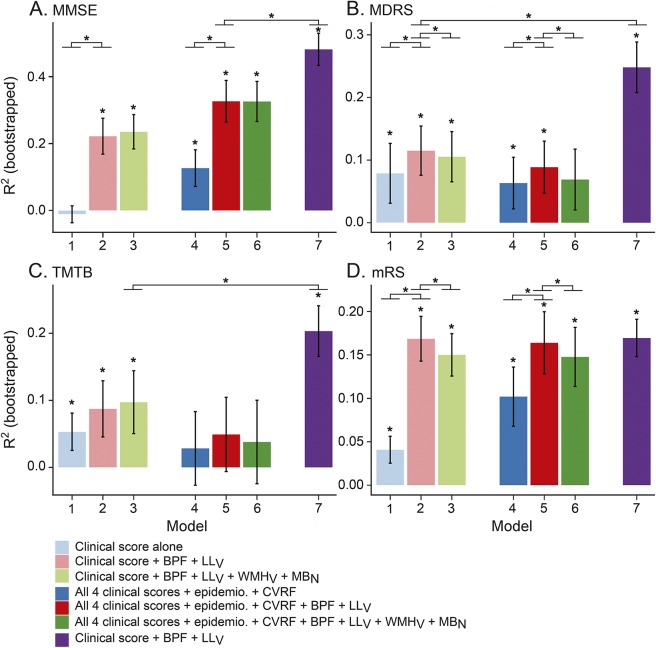
Linear models predicting further score changes with highly significant R2 were obtained for all outcomes (figure 1). For MDRS, TMTB, and mRS, the baseline value alone (model 1) was a significant predictor of further score changes during follow-up. By contrast, the baseline value of MMSE was not.
Figure 1. Ability of the different models to predict score changes over 3 years of follow-up.
(A) Mini-Mental State Examination (MMSE), (B) Mattis Dementia Rating Scale (MDRS), (C) Trail Making Test part B (TMTB), (D) modified Rankin Scale (mRS). Estimation of the coefficient of determination (R2) of the 7 different predictive models of score changes. Models 1 to 6 are linear models, model 7 is a recursive partitioning tree (RPT) model. *Significant R2 differences. We performed pairwise comparisons of all linear sequentially nested models (1 vs 2, 2 vs 3, 4 vs 5, 5 vs 6) and the comparison of the RPT model vs the best linear model. BPF = brain parenchymal fraction; CVRF = cardiovascular risk factors (smoking habits, systolic and diastolic blood pressure, alcohol consumption, levels of low-density lipoprotein cholesterol, homocysteine, HbA1C, and C-reactive protein); epidemio = epidemiologic data (age, sex, level of education); LLV = volume of lacunes; MBN = number of cerebral microbleeds; WMHV = volume of white matter hyperintensities of presumed vascular origin.
For MMSE, MDRS, and mRS, but not for TMTB, models including BPF and LLV (model 2 or 5) performed significantly better than those without (models 1 and 4).
With the exception of MMSE, models based on complex sets of predictors (models 4, 5, or 6) showed lower R2 than those based on few variables (models 2 or 3). For all 4 scores, models 2 and 3 performed very similarly, with few if any predictive value associated with the inclusion of WMHV and MBN.
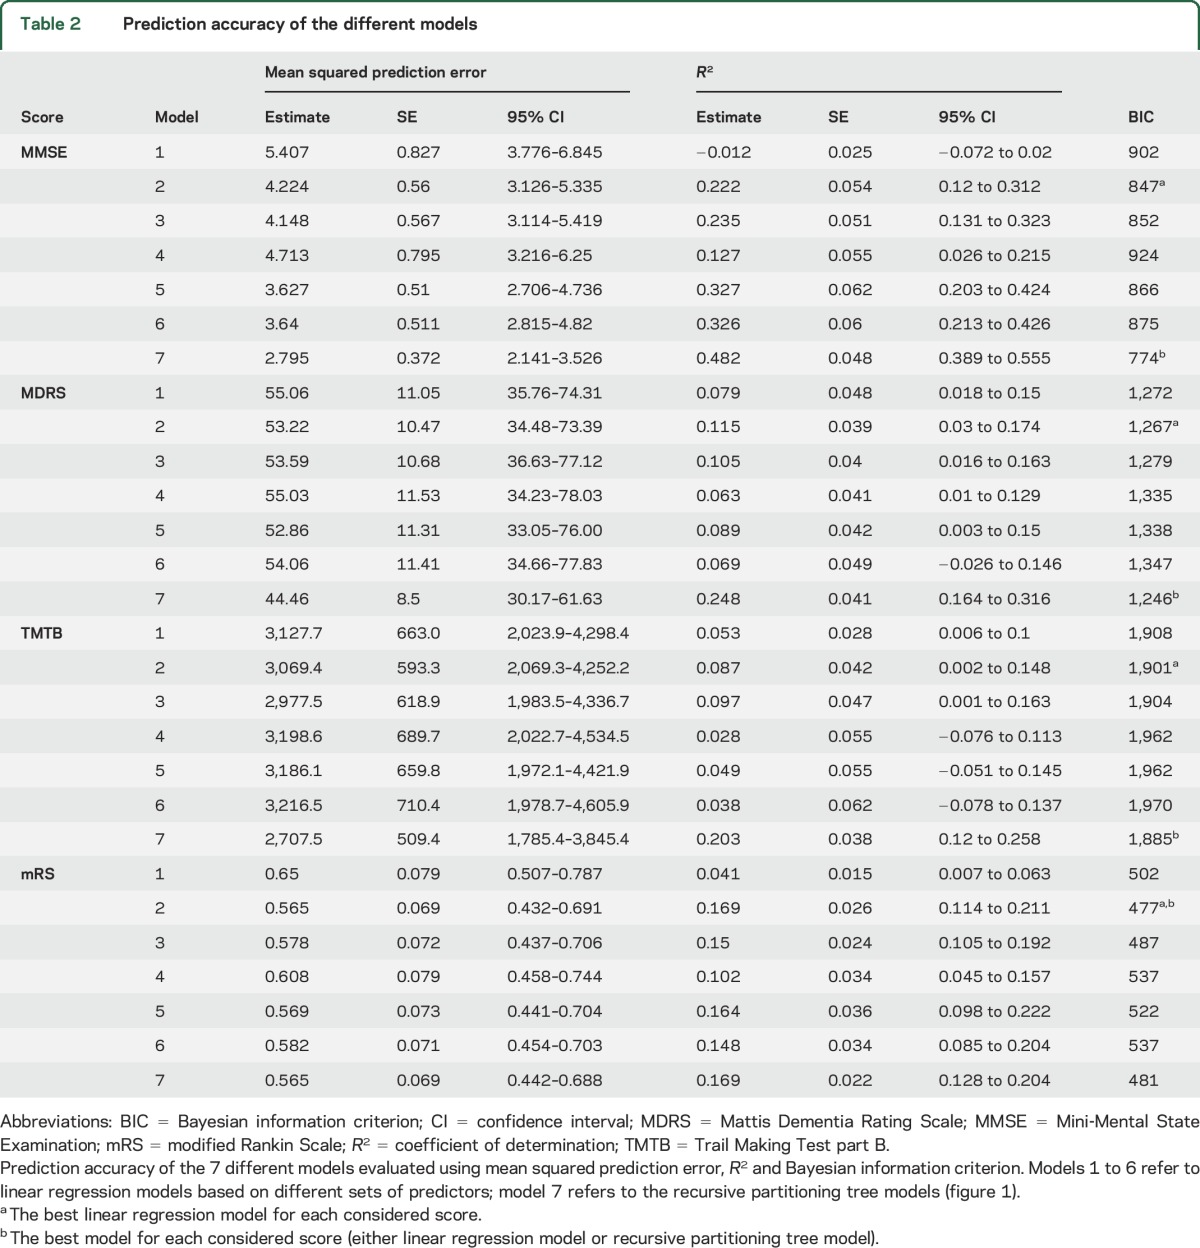
For all 4 scores, models based on the baseline score value, BPF, and LLV (model 2) were the models with the best tradeoff between prediction ability and number of predictors, as illustrated by their lowest BIC (table 2).
Table 2.
Prediction accuracy of the different models
Predicting changes in clinical status based on recursive partitioning.
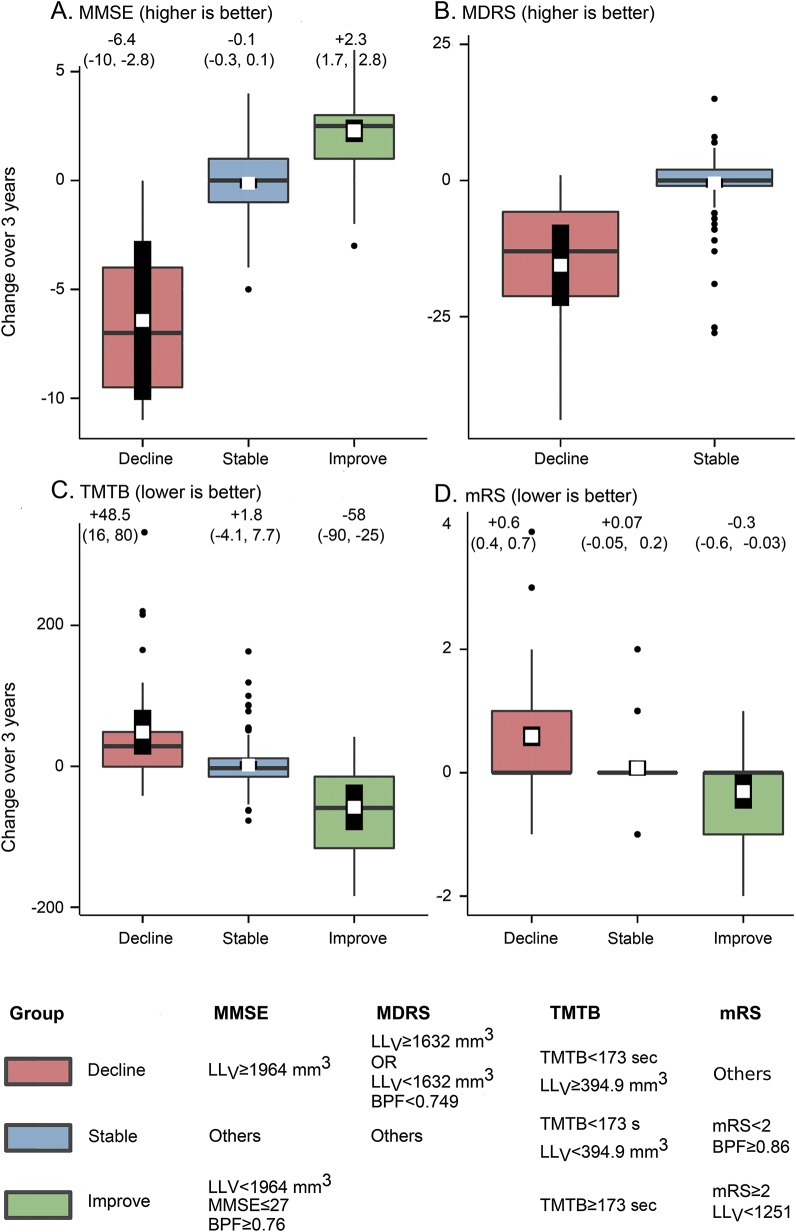
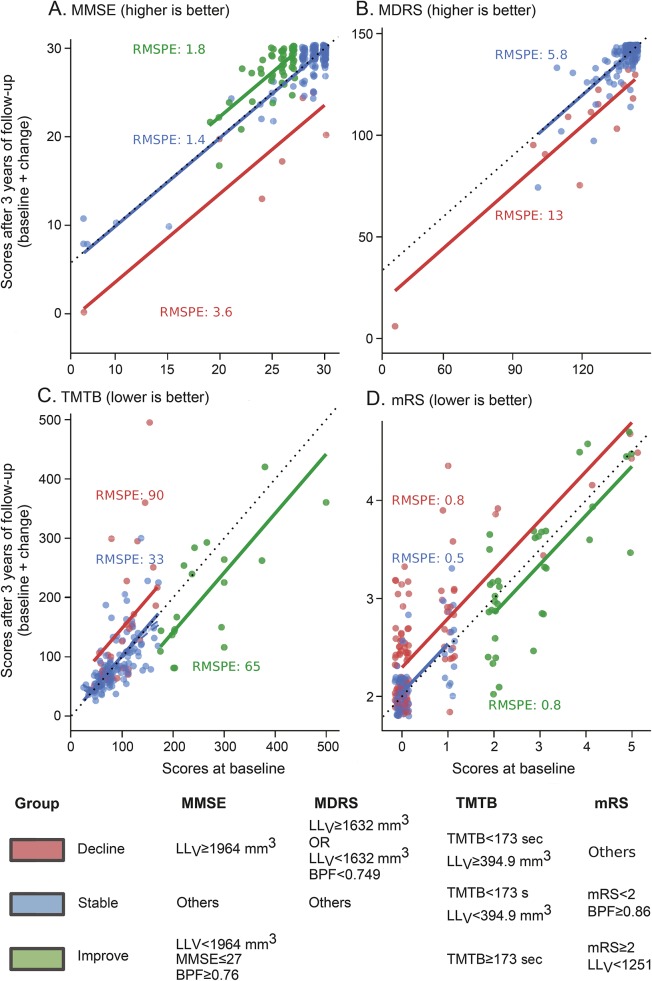
Given the consistency of results obtained with BPF and LLV and the fact that for all scores, model 2 obtained the lowest BIC, recursive-partitioning algorithms were built only with the baseline values of the considered score of BPF and of LLV as predictors. This allowed identifying, according to different threshold values of the predictors, 3 groups of patients (will decline, improve, or remain stable) for MMSE, TMTB, and mRS, while only 2 groups of patients were identified for MDRS (will decline or remain stable) (figure 2). The performances of these recursive partitioning tree rules were compared to that of linear regression models (figure 1 and table e-2). Estimates of the prediction errors of these models at the individual level are shown in figure 3.
Figure 2. Simple rules for predicting clinical changes.
(A) Mini-Mental State Examination (MMSE), (B) Mattis Dementia Rating Scale (MDRS), (C) Trail Making Test part B (TMTB), (D) modified Rankin Scale (mRS). Box plots of score changes between baseline and follow-up. The horizontal band inside the box is the median. The overlaid white square and the thick vertical line depict the prediction and its 95% confidence interval made by recursive partitioning tree (RPT) model at the group level. The RPT predictive model has partitioned patients into homogeneous subgroups according to the baseline values of brain parenchymal fraction (BPF), volume of lacunes (LLV), and the considered score at baseline. Clinical evolution as estimated by the model is color-coded (pink: decline; blue: stable; green: improve). Numbers indicate the average change within the considered group with 95% confidence intervals.
Figure 3. Follow-up scores as a function of baseline scores according to patient group.
(A) Mini-Mental State Examination (MMSE), (B) Mattis Dementia Rating Scale (MDRS), (C) Trail Making Test part B (TMTB), (D) modified Rankin Scale (mRS). Three-year follow-up scores as a function of the baseline value. Each single point corresponds to 1 patient, on the horizontal axis the initial value of the considered score and on the vertical axis the corresponding value after 3 years of follow-up (a small amount of jitter has been introduced to help read similar values, explaining why some points can appear to have decimal values). Solid color lines correspond to predictions obtained by recursive partitioning tree models. The predicted value of the considered score after 3 years is obtained by projecting onto the vertical axis the intersection between the baseline value on the horizontal axis and the solid line corresponding to the patient's group. The black dashed line stands for stability, where follow-up score equals baseline. For each group, we report the root mean squared prediction error (RMSPE), which is an estimate of the prediction error calculated from 200 bootstrapped replications. As illustrated by the dispersion of colored points around solid lines, the prediction error at the individual level is inversely related to the sample size. LLV = volume of lacunes.
DISCUSSION
We validated models predicting how the clinical status of a given patient with CADASIL will evolve over the next 3 years. One of our main findings is that quantitative MRI markers (i.e., BPF and LLV) appeared as stronger predictors of further clinical course at the individual level than any other variable including baseline clinical status, age, sex, and level of education.
The significantly lower R2 of models including additional measures known to be associated with disease severity at the group level may appear surprising (figure 1). We could not exclude that some variables have a predictive ability in specific subsamples of patients. For instance, WMHV may predict score changes in mildly affected patients, but not in severely affected patients. In such cases, WMHV may appear as a significant predictor if a randomly selected training sample includes more mildly affected participants. Then, when calculating the model R2 on the validation samples, it would be lower because of the reduced possibility to generalize to another sample including more severe disease. In line with this hypothesis, when building models on German patients, who had generally less severe disease, WMHV was more often retained as a significant predictor but the ability to generalize to French patients was lower (data not shown). In addition, variability and limited changes of clinical scores over a 3-year period may prevent the detection of small effects related to multiple factors. Alternatively, LLV and BPF may substitute for the combined and long-term consequences of age, sex, or cardiovascular risk factors on the cerebral tissue.3,5
Given the low amplitude of score changes during follow-up compared to score ranges, the variance explained by models predicting follow-up score values would have been artificially high. When facing 2 patients with an MMSE score of 26, demonstrating that their follow-up score will lie between 23 and 29 with a high probability is of limited interest. By contrast, determining that 1 patient is at high risk to lose 6 points (thus scoring 20) and the other to increase its score by 2 (thus scoring 28) appears of higher interest. Partitioning-tree algorithms both confirmed the results obtained with linear regression models and allowed groups of patients with similar prediction of further evolution to be identified. For instance, we found that a patient having an LLV above 1,964 mm3 will lose 6 points on MMSE, regardless of any other variable known to be associated with the disease severity. By contrast, a patient with an LLV inferior to 1,964 mm3, furthermore in the absence of cerebral atrophy, will either keep a score of 26 or even improve up to 2 points.
Our study has several limitations. Since the models were based on patients with both baseline and follow-up data, our algorithms may not be applicable to every CADASIL case but only to patients who were not at the most advanced stage of the disease and who came back to a distant clinical center for their follow-up evaluation. Among the 54 patients who could not achieve a 3-year follow-up period, 23 were severely disabled or had dementia, 14 died, but 17 of them did not attend for other reasons, including unwillingness to pursue the follow-up. Another limitation is that our models predict clinical scores rather than clinical status. Variations related to the scoring method itself such as learning or ceiling effects clearly appear in our results. A patient with an MMSE score of 28 that can increase by 2 points is compared to another patient whose score is 30 that cannot increase. Specific processes may also intervene differently for the various scores. For instance, for TMTB, the first order thresholds for identifying different groups in the recursive-partitioning approach was the baseline value of the score itself, with the best improvement in patients achieving the test in more than 173 seconds. These results are probably secondary to the test itself rather than to clinical evolution, as there is more space for these patients to improve their performances in case they did not perform well at the first visit. TMTB is probably the harder score to predict, as shown by its lower R2 compared to other scores. This is in line with the possible variations from one visit to another on TMTB, depending on many factors not necessarily linked to clinical severity, including fatigue and mood.23 We do not see any reason why TMTB would not be altered from learning effects, but it seems that the variability in patient performances on this test outweighs this effect.
In the next few years, one can imagine that after automated postprocessing, the obtained values of BPF and LLV would be fed to simple software providing in return a clinical prediction far more precise than that achieved by eye. Meanwhile, the algorithm could still be used through visual estimation of these values (figures e-1 and e-2 illustrate the values of BPF and of LLV corresponding to the thresholds obtained in the recursive-partitioning algorithm).
We did not include in the present models more elaborated methods to take into account the effect of white matter hyperintensities in specific locations,10 the occurrence of secondary degeneration, or the occurrence of cortical alterations.24–26 We made this choice to ensure the best generalizability of these models and keep the analyses reasonably simple and translatable in clinical practice. Another limitation is the different sizes of the samples available to predict the 4 scores, which may have influenced our results. Finally, we chose to constrain the behavior of the recursive partitioning tools to identify a maximum of 3 groups based on a maximum of 3 different baseline variables. It is important to keep in mind that, as in every nonlinear model, recursive partitioning trees are prone to overfitting, which risks translating into loss of generalizability. Here, we obtained strong arguments with our validation scheme to prove the validity of our approach.
This study has several strengths. The results were obtained using a large sample of patients with CADASIL who were followed in 2 different referral centers in 2 different countries. Thus, they are likely to be generalized to new populations of patients with CADASIL in similar countries. Our specific statistical approach obtained validated models that were compared using state-of-the-art methodology. The method we chose also prevented overfitting the data and provided a true demonstration of the ability of these models to generalize to new patients with CADASIL. Our specific strategy identified markers not only associated with the disease evolution at the group level, but true predictors of further disease evolution at the individual level. It also demonstrated that, in order to predict the disease evolution for a given patient, the interest of clinical variables appears limited and most information may be contained in quantitative MRI markers that integrate both aging and disease effects.
Supplementary Material
ACKNOWLEDGMENT
The authors thank the CERVCO team for their involvement in the follow-up of patients.
GLOSSARY
- BIC
Bayesian Information Criterion
- BPF
brain parenchymal fraction
- CADASIL
cerebral autosomal dominant arteriopathy with subcortical infarcts and leukoencephalopathy
- CI
confidence interval
- LLV
volume of lacunes
- MBN
number of microbleeds
- MDRS
Mattis Dementia Rating Scale
- MMSE
Mini-Mental State Examination
- mRS
modified Rankin Scale
- MSPE
mean squared prediction error
- SVD
small vessel disease
- TMTB
Trail Making Test part B
- WMHV
white matter hyperintensities of presumed vascular origin
Footnotes
Supplemental data at Neurology.org
AUTHOR CONTRIBUTIONS
Eric Jouvent: data acquisition, study design, statistical analyses, drafting manuscript. Edouard Duchesnay: study design, statistical analyses. Foued Hadj-Selem: statistical analyses. François De Guio: study design, data acquisition. Jean-François Mangin: study design. Dominique Hervé: data acquisition. Marco Duering: study design, data acquisition. Stefan Ropele: study design, manuscript correction. Reinhold Schmidt: study design, manuscript correction. Martin Dichgans: study design, data acquisition, data analysis. Hugues Chabriat: study design, data acquisition, data analysis, manuscript correction.
STUDY FUNDING
This work was supported by PHRC grant AOR 02-001 (DRC/APHP), a FP7 ERA-NET NEURON grant (01EW1207) a grant from the Fondation Leducq (Transatlantic Network of Excellence on the Pathogenesis of Small Vessel Disease of the Brain) (http://fondationleducq.org), and a grant from a European Union's Horizon 2020 research and innovation programme under grant agreement 666881, SVDs@target.
DISCLOSURE
The authors report no disclosures relevant to the manuscript. Go to Neurology.org for full disclosures.
REFERENCES
- 1.Joutel A, Corpechot C, Ducros A, et al. Notch3 mutations in CADASIL, a hereditary adult-onset condition causing stroke and dementia. Nature 1996;383:707–710. [DOI] [PubMed] [Google Scholar]
- 2.Zieren N, Duering M, Peters N, et al. Education modifies the relation of vascular pathology to cognitive function: cognitive reserve in cerebral autosomal dominant arteriopathy with subcortical infarcts and leukoencephalopathy. Neurobiol Aging 2013;34:400–407. [DOI] [PubMed] [Google Scholar]
- 3.Chabriat H, Joutel A, Dichgans M, Tournier-Lasserve E, Bousser MG. CADASIL. Lancet Neurol 2009;8:643–653. [DOI] [PubMed] [Google Scholar]
- 4.Viswanathan A, Godin O, Jouvent E, et al. Impact of MRI markers in subcortical vascular dementia: a multi-modal analysis in CADASIL. Neurobiol Aging 2010;31:1629–1636. [DOI] [PubMed] [Google Scholar]
- 5.Chabriat H, Herve D, Duering M, et al. Predictors of clinical worsening in cerebral autosomal dominant arteriopathy with subcortical infarcts and leukoencephalopathy: prospective cohort study. Stroke 2016;47:4–11. [DOI] [PubMed] [Google Scholar]
- 6.Viswanathan A, Gschwendtner A, Guichard JP, et al. Lacunar lesions are independently associated with disability and cognitive impairment in CADASIL. Neurology 2007;69:172–179. [DOI] [PubMed] [Google Scholar]
- 7.Benisty S, Reyes S, Godin O, et al. White-matter lesions without lacunar infarcts in CADASIL. J Alzheimers Dis 2012;29:903–911. [DOI] [PubMed] [Google Scholar]
- 8.Jouvent E, Reyes S, Mangin JF, et al. Apathy is related to cortex morphology in CADASIL A sulcal-based morphometry study. Neurology 2011;76:1472–1477. [DOI] [PubMed] [Google Scholar]
- 9.Dichgans M, Markus HS, Salloway S, et al. Donepezil in patients with subcortical vascular cognitive impairment: a randomised double-blind trial in CADASIL. Lancet Neurol 2008;7:310–318. [DOI] [PubMed] [Google Scholar]
- 10.Duering M, Gonik M, Malik R, et al. Identification of a strategic brain network underlying processing speed deficits in vascular cognitive impairment. Neuroimage 2013;66:177–183. [DOI] [PubMed] [Google Scholar]
- 11.Epelbaum S, Benisty S, Reyes S, et al. Verbal memory impairment in subcortical ischemic vascular disease: a descriptive analysis in CADASIL. Neurobiol Aging 2011;32:2172–2182. [DOI] [PubMed] [Google Scholar]
- 12.Jouvent E, Viswanathan A, Mangin JF, et al. Brain atrophy is related to lacunar lesions and tissue microstructural changes in CADASIL. Stroke 2007;38:1786–1790. [DOI] [PubMed] [Google Scholar]
- 13.Wardlaw JM, Smith EE, Biessels GJ, et al. Neuroimaging standards for research into small vessel disease and its contribution to ageing and neurodegeneration. Lancet Neurol 2013;12:822–838. [DOI] [PMC free article] [PubMed] [Google Scholar]
- 14.Zou H, Hastie T. Regularization and variable selection via the elastic net. J R Stat Soc Ser B Stat Methodol 2005;67:301–320. [Google Scholar]
- 15.Liem MK, van der Grond J, Haan J, et al. Lacunar infarcts are the main correlate with cognitive dysfunction in CADASIL. Stroke 2007;38:923–928. [DOI] [PubMed] [Google Scholar]
- 16.Liem MK, Lesnik Oberstein SAJ, Haan J, et al. MRI correlates of cognitive decline in CADASIL: a 7-year follow-up study. Neurology 2009;72:143–148. [DOI] [PubMed] [Google Scholar]
- 17.Vapnik V. The Nature of Statistical Learning Theory. Berlin: Springer; 2000. [Google Scholar]
- 18.Ambroise C, McLachlan GJ. Selection bias in gene extraction on the basis of microarray gene-expression data. Proc Nat Acad Sci 2002;99:6562–6566. [DOI] [PMC free article] [PubMed] [Google Scholar]
- 19.Efron B, Tibshirani R. Bootstrap methods for standard errors, confidence intervals, and other measures of statistical accuracy. Stat Sci 1986;1:54–75. [Google Scholar]
- 20.Schwarz G. Estimating the dimension of a model. Ann Stat 1978;6:461–464. [Google Scholar]
- 21.Breiman L, Friedman J, Stone CJ, Olshen RA. Classification and Regression Trees. Boca Raton, FL: CRC Press; 1984. [Google Scholar]
- 22.Fonarow GC, Adams KF Jr, Abraham WT, et al. Risk stratification for in-hospital mortality in acutely decompensated heart failure: classification and regression tree analysis. JAMA 2005;293:572–580. [DOI] [PubMed] [Google Scholar]
- 23.Jouvent E, Reyes S, De Guio F, Chabriat H. Reaction time is a marker of early cognitive and behavioral alterations in pure cerebral small vessel disease. J Alzheimers Dis 2015;47:413–419. [DOI] [PubMed] [Google Scholar]
- 24.Duering M, Righart R, Csanadi E, et al. Incident subcortical infarcts induce focal thinning in connected cortical regions. Neurology 2012;79:2025–2028. [DOI] [PubMed] [Google Scholar]
- 25.Jouvent E, Poupon C, Gray F, et al. Intracortical infarcts in small vessel disease a combined 7-T postmortem MRI and neuropathological case study in cerebral autosomal-dominant arteriopathy with subcortical infarcts and leukoencephalopathy. Stroke 2011;42:E27–E30. [DOI] [PubMed] [Google Scholar]
- 26.De Guio F, Reyes S, Vignaud A, et al. In vivo high-resolution 7 Tesla MRI shows early and diffuse cortical alterations in CADASIL. PLoS One 2014;9:e106311. [DOI] [PMC free article] [PubMed] [Google Scholar]
Associated Data
This section collects any data citations, data availability statements, or supplementary materials included in this article.


