

Abstract
Learning and memory processes are accompanied by rearrangements of synaptic protein networks. While various studies have demonstrated the regulation of individual synaptic proteins during these processes, much less is known about the complex regulation of synaptic proteomes. Recently, we reported that auditory discrimination learning in mice is associated with a relative down‐regulation of proteins involved in the structural organization of synapses in various brain regions. Aiming at the identification of biological processes and signaling pathways involved in auditory memory formation, here, a label‐free quantification approach was utilized to identify regulated synaptic junctional proteins and phosphoproteins in the auditory cortex, frontal cortex, hippocampus, and striatum of mice 24 h after the learning experiment. Twenty proteins, including postsynaptic scaffolds, actin‐remodeling proteins, and RNA‐binding proteins, were regulated in at least three brain regions pointing to common, cross‐regional mechanisms. Most of the detected synaptic proteome changes were, however, restricted to individual brain regions. For example, several members of the Septin family of cytoskeletal proteins were up‐regulated only in the hippocampus, while Septin‐9 was down‐regulated in the hippocampus, the frontal cortex, and the striatum. Meta analyses utilizing several databases were employed to identify underlying cellular functions and biological pathways. Data are available via ProteomeExchange with identifier PXD003089.
How does the protein composition of synapses change in different brain areas upon auditory learning? We unravel discrete proteome changes in mouse auditory cortex, frontal cortex, hippocampus, and striatum functionally implicated in the learning process. We identify not only common but also area‐specific biological pathways and cellular processes modulated 24 h after training, indicating individual contributions of the regions to memory processing.
Keywords: auditory learning, chemical synapse, label‐free quantification, learning and memory, phosphoproteomics, quantitative mass spectrometry
Abbreviations used
- AC
auditory cortex
- AV
avoidance learning group
- CS
conditioned stimulus
- FC
frontal cortex
- FM
frequency‐modulated
- FMTD
FM‐tone discrimination
- GO
gene ontology
- HIP
hippocampus
- IPA
ingenuity pathway analysis
- LTP
long‐term potentiation
- MRM
multiple reaction monitoring
- MS
mass spectrometry
- NV
naïve untreated group
- PSD
postsynaptic density
- SJ
synaptic junction
- STR
striatum
The formation and maintenance of memories are generally assumed to be associated with changes of the synaptic proteome in relevant brain regions. Molecular mechanisms underlying these alterations include post‐translational modifications, subcellular relocalization, and changes in the turnover of proteins (Lamprecht and LeDoux 2004; Bingol and Schuman 2005; Richter and Klann 2009; Rosenberg et al. 2014). Relocalization and shuttling of proteins between synaptic and non‐synaptic sites as well as differential anchoring at cytoskeletal or cytomatrix structures have been reported as molecular correlates of synaptic activity or learning (e.g. Trinidad et al. 2013; Rao‐Ruiz et al. 2015). Such rearrangement processes can be directly linked to activity‐induced protein modifications like phosphorylation (Tweedie‐Cullen et al. 2009). In a first systematic study on phosphoproteome dynamics, Li et al. (2014) reported changes in total phosphoproteome patterns after spatial memory formation in the hippocampus. Although not focused on synaptic protein fractions, this study revealed several synaptic phosphoproteins potentially regulated as long as 12 days after the initial learning.
Numerous studies have reported on the complexity of the synaptic proteome in general (Sheng and Hoogenraad 2007; Chua et al. 2010; Pielot et al. 2012; Wilhelm et al. 2014; Lassek et al. 2015). While several studies analyzed total proteome dynamics during processes of synaptic plasticity and learning (Henninger et al. 2007; Zheng et al. 2009; Monopoli et al. 2011; Meparishvili et al. 2015), to date, only few studies have addressed learning‐induced dynamics of the synaptic proteome (Jüch et al. 2009; Kähne et al. 2012; Rao‐Ruiz et al. 2015).
Formation of a memory trace occurs in multiple stages with differential dependencies on protein synthesis and/or modifications and involves a complex interplay of various brain regions (for review, see Matthies 1989; McGaugh 2000; Kandel et al. 2014). In mammals, cognitively demanding learning processes engage subregions of the cerebral cortex connected with subcortical areas. Auditory discrimination learning, for example, involves, among others, projections from the auditory cortex (AC) to the striatum (STR), the main reinforcement‐analyzing structure (Schultz 2010), and leads to potentiation of corticostriatal synapses (Xiong et al. 2015) ultimately entailing a task‐dependent increase in corticostriatal communication (Schulz et al. 2016). Furthermore, auditory learning is accompanied by increased spine formation within the AC with newly formed spines persisting at least for several days, thus, potentially forming a structural correlate for the memory trace (Moczulska et al. 2013). A well‐characterized example of auditory cortex‐dependent learning is the frequency‐modulated tone discrimination (FMTD) task, a go/no‐go shuttle box avoidance paradigm that involves the AC as crucial interpreter of task‐specific features of auditory information (Ohl et al. 1999, 2001; Rybalko et al. 2006; Scheich et al. 2011). In the AC and in the frontal cortex (FC), which is reciprocally connected with the AC, acquisition of the FMTD task elicits a rise in dopamine levels pointing to a role of cortical dopamine in synaptic remodeling (Stark and Scheich 1997; Stark et al. 2004; Ilango et al. 2012; Ohl 2015). Retention of the newly acquired FM discrimination is critically controlled by dopamine‐mediated protein synthesis in the AC (Schicknick et al. 2008; Reichenbach et al. 2015).
Previous studies with the inhibitors anisomycin and rapamycin injected into the AC identified two distinct protein synthesis‐dependent mechanisms required immediately after encoding for the initial maintenance and long‐term consolidation of FMTD memories (Kraus et al. 2002; Tischmeyer et al. 2003). In this study, we were interested in analyzing subsequent changes (24 h after training) in the synaptic proteomes and phosphoproteomes of brain regions involved in FMTD learning, i.e. the AC, FC, and STR. We also included the hippocampus (HIP) as central memory hub and key structure in the acquisition of active avoidance learning in the shuttle box (Myhrer 1976; Pavlova et al. 2010), which is potentially implicated in FMTD learning (Ilango et al. 2014). The AC is indirectly connected to the HIP via the entorhinal cortex (important functional connections of the rodent AC are sketched in Fig. 1; for details, see Budinger and Scheich 2009).
Figure 1.

Four brain regions implicated in FM‐tone discrimination learning were analyzed. The rodent auditory cortex (AC) was shown to be critical for FMTD learning (Ohl et al. 1999). The AC is connected with a number of cortical and subcortical structures (Budinger and Scheich 2009), including strong efferent fibers toward the striatum (STR) and the entorhinal cortex, which feeds directly to the hippocampus (HIP). The connection between AC and the frontal cortex (FC) is reciprocal. The projection from AC to the STR is differentially modulated by FMTD learning (Schulz et al. 2016). Strengths of connections are roughly indicated by the thickness of arrows.
Building on our previous study (Kähne et al. 2012), which showed that proteomic changes after differential conditioning of mice to FMs occur in the above mentioned four brain regions, we addressed here the following questions: (i) Are proteomic changes of global nature or rather brain region‐specific? (ii) Can changes in phosphorylation patterns be identified 24 h after training? (iii) What are the potential cellular processes and biological pathways represented by these changes? To this end, we performed quantitative analyses of changes in the composition of synaptic junction (SJ) preparations in mice 24 h after auditory discrimination conditioning. The study revealed distinct rather than common patterns of proteomic and phosphoproteomic synaptic changes in the analyzed brain regions. Moreover, it confirms earlier findings that among all regulated SJ proteins more are down‐ than up‐regulated in their relative abundance (Kähne et al. 2012).
Materials and methods
Animals and behavioral experiments
Male 10–16‐week‐old C57BL/6J mice were used for this study. They were housed and treated as described (Kähne et al. 2012). Animal experiments were performed in accordance with the regulations of the German Federal Law, the respective EU regulations, and NIH guidelines, and were approved by the Landesverwaltungsamt Halle/Saale for the State Saxony‐Anhalt.
FMTD training: mice were trained in a two‐way shuttle box go/no‐go task to discriminate between sequences of rising (4–8 kHz, CS+) and falling FM tones (8–4 kHz, CS−) to avoid mild foot‐shock (AV group) as previously described (Kähne et al. 2012). A training session consisted of 60 trials, i.e. 30 presentations of each CS+ and CS− in pseudorandomized order, and lasted ~ 25 min. Naïve littermates were used as controls (NV group).
Two separate sets of mice (1a and 2a) were used sequentially for protein analytical purposes. The mice of set 1a (AV: n = 6; NV: n = 6) were subjected to proteome analysis (see below); the mice of set 2a (AV: n = 11; NV: n = 11) were used to verify selected findings by multiple reaction monitoring (MRM) and/or immunoblotting (Supporting Information). Because FMTD memory is critically controlled by protein synthesis‐dependent changes induced during initial learning (see Introduction), the mice of sets 1a and 2a were killed 24 h after the first and only training session. To monitor learning and memory performance, two additional sets of mice, sets 1b (n = 4) and 2b (n = 6), were trained along with the mice of sets 1a and 2a, respectively. Here, the training was continued on subsequent days, when memory eventually becomes manifested in discrimination performance (Schicknick et al. 2012). Behavioral data are presented in Figure S1.
Brain dissection and tissue fractionation
Twenty‐four hours after completion of training, AV and NV mice of sets 1a and 2a were killed, the brain regions AC, FC, HIP, and STR (Fig. 1) were dissected as described (Kähne et al. 2012), frozen in liquid nitrogen, and stored at −80°C.
For preparation of protein samples enriched for synaptic junctional structures (SJ‐enriched samples, Smalla et al. 2000, 2012; Bonn et al. 2007), tissue was homogenized in 300 μL of 10 mM Tris/HCl, pH 8.1, 0.5% Triton X‐100 containing protease and phosphatase inhibitors. After incubation for 1 h at 4°C, samples were centrifuged at 100 000 g for 1 h. The resulting pellets were rehomogenized in the same buffer and centrifuged again. The final pellets were resuspended in 500 μL of deionised water and stored at −80°C. Aliquots were subjected to sodium dodecyl sulfate–polyacrylamide gel electrophoresis (SDS‐PAGE) to adjust protein amounts for proteome analysis. Samples of set 1a were processed as below for proteome analysis; samples of set 2a were used for immunoblotting and/or trypsin‐digested for MRM (Supporting Information).
The adjusted SJ‐enriched samples of set 1a were heated in SDS‐sample buffer, and 4 μl aliquots were separated by SDS‐PAGE (3% stacking gel, 12% separation gel) in a Mini PROTEAN ® System (Bio‐Rad Laboratories, Hercules, CA, USA). After Coomassie staining, gel pieces covering the molecular weight range of ~ 35–170 kDa were manually excised. In‐gel digestion was performed according to Shevchenko et al. (1996) with slight modifications: gel pieces were washed twice in 0.1 M NH4HCO3 followed by 100% acetonitrile (ACN). Afterwards, cysteine residues were carbamidomethylated by dithiothreitol and subsequent iodoacetamide treatment. Gel pieces were washed twice again, dried, rehydrated in freshly prepared digestion buffer, i.e. 50 mM NH4HCO3 containing 12.5 ng/μl of trypsin (Promega, Madison, WI, USA, Trypsin Gold), and incubated at 37°C overnight. Tryptic peptides were extracted with 25 mM NH4HCO3 followed by ACN under sonication and lyophilized.
Phosphopeptide‐enriched and phosphopeptide‐depleted fractions were prepared from the tryptic peptides of the SJ‐enriched samples by TiO2 chromatography (adapted from Thingholm et al. 2008). Briefly, tryptic peptides were dissolved in 80% ACN/2.5% trifluoroacetic acid (TFA) and mixed with ~ 2 mg Titansphere TiO2‐beads (GL Sciences, Tokyo, Japan). After incubation for 1 h ~20°C, the beads were spun down (16 000 g, 1 min) and the supernatants were collected. The beads were washed in 80% ACN/2.5% TFA, followed by 80% ACN/0.1% TFA and 0.1% TFA, and the combined supernatants were lyophilized. They represented the phosphopeptide‐depleted fraction and were redissolved prior to proteome analysis. The TiO2‐beads were finally washed with 400 mM NH4OH/30% ACN and the resulting eluates were concentrated in a vacuum centrifuge to a volume of ~ 6 μl for proteome analysis (phosphopeptide‐enriched fraction).
Proteome analysis
Phosphopeptide‐depleted and phosphopeptide‐enriched fractions from SJ‐enriched protein samples were analyzed by high‐resolution mass spectrometry (MS) to allow label‐free quantification and reliable discovery of post‐translational modifications. LC‐MS/MS was performed on a hybrid dual‐pressure linear ion trap/orbitrap mass spectrometer (LTQ Orbitrap Velos Pro, Thermo Scientific, San Jose, CA, USA) equipped with an EASY‐nLC Ultra HPLC (Thermo Scientific). For analysis, peptide samples were adjusted to 10 μl 2% ACN/0.1% TFA and fractionated on a 75 μm (inner diameter), 25 cm PepMap C18‐column, packed with 2 μm resin (Dionex, Thermo Scientific). Separation was achieved through applying a gradient from 2 to 35% ACN in 0.1% formic acid over 150 min at a flow rate of 300 nL/min.
An Orbitrap full MS scan was followed by up to 10 LTQ MS/MS runs using collision‐induced dissociation (CID) fragmentation of the most abundantly detected peptide ions. Essential MS settings were as follows: full MS (FTMS; resolution 60 000; m/z range 400–2000); MS/MS (Linear Trap; minimum signal threshold 500; isolation width 2 Da; dynamic exclusion time setting 30 s; singly charged ions were excluded from selection). Normalized collision energy was set to 35%, and activation time to 10 ms. Minimum information about the proteomics experiments (MIAPE‐MS and MSI) is provided in Tables S1a and S1b. MS proteomics data have been deposited to the ProteomeXchange Consortium (Vizcaino et al. 2014) via the PRIDE partner repository with the dataset identifier PXD003089 and 10.6019/PXD003089.
MRM and/or immunoblotting were employed to paradigmatically verify the training‐induced regulation of SJ‐enriched proteins selected from Table S3 using mice of set 2a (see above). Details and results are given in Tables S1c, S1d, and S5 (for MRM), and in Figure S3 and Tables S2 and S5 (for immunoblotting).
Data analysis
Raw data processing, protein identification, and phosphopeptide assignment of the high‐resolution Orbitrap data sets were performed using ProteomeDiscoverer 1.4 (Thermo Scientific). For a combined database search, Sequest and Mascot algorithms were used. False discovery rate was calculated by Percolator 2.04 algorithm and set to < 1%. Label‐free quantification was performed using PEAKS Studio V.7.0 label‐free algorithm (Bioinformatics Solutions, Waterloo, Canada). The resulting data were re‐evaluated using Progenesis LC‐MS software package (Nonlinear Dynamics/Waters, Newcastle, UK). Phospho‐site determination was performed by phosphoRS 3.0 (Taus et al. 2011) and the resulting data were evaluated using the Progenesis LC‐MS software package. Proteins with abundance ratios (AV/NV) of > 1.5 or < 1/1.5 at p < 0.05 were considered as significantly regulated. Note: because of losses during SJ preparation and/or nanoLC‐MS/MS, the numbers of individual animal data sets were diminished for AC to n = 4 per group and for FC to n = 5 in the AV group. MRM data were analyzed using Skyline (MacLean et al. 2010).
Functional annotation and network analysis of functional interactions of differentially regulated proteins were done using the web‐based tool GeneCodis (Tabas‐Madrid et al. 2012) and QIAGEN's Ingenuity® Pathway Analysis (IPA®, QIAGEN Redwood City, www.qiagen.com/ingenuity). Single enrichment analysis by GeneCodis utilized functional annotations of the Gene Ontology (GO) database, Kyoto Encyclopedia of Genes and Genomes, Protein ANalysis THrough Evolutionary Relationships (PANTHER) and InterPro (EMBL‐EBI, Hinxton, UK). As control, the whole mouse proteome was used, the cut‐off was at p < 0.05 (hypergeometric distribution) and p‐values were corrected by the false discovery rate method of Benjamini and Hochberg (1995). Detection of biological pathways was performed by IPA, which uses the Ingenuity Knowledge database for annotation. Significance was calculated by Fisher's exact test and the multiple testing corrected p‐values were obtained by the Benjamini–Hochberg method.
Results
We analyzed changes in the synaptic proteomes of four brain regions implicated in FMTD learning (i.e. AC, FC, HIP, STR; Fig. 1). Our previous study on the same learning paradigm utilizing high‐throughput low‐resolution MS of a gel‐free separated synaptic proteome revealed primarily high molecular weight cytoskeleton‐associated proteins as regulated (Kähne et al. 2012). This study has been based on SDS‐gel separation of SJ‐enriched protein fractions, high‐resolution Orbitrap MS, and label‐free quantification. This strategy allows the confident detection and quantification of medium molecular weight proteins and their comparative profiling in mice 24 h after FMTD training to avoid mild foot‐shock (AV group) and naïve control mice (NV group). For technical reasons, proteins smaller than 35 kD were not resolved by our gel system and accordingly not identified. The excluded protein fraction may also contain learning‐relevant proteins that will require separate attention. Both phosphopeptide‐depleted and phosphopeptide‐enriched fractions of SJ protein samples were analyzed. For protein quantification, data of both fractions were combined. Detailed information on proteins with significant changes in protein abundance and phosphopeptide occurrence in SJ‐enriched fractions is summarized in Tables S3 and S4, respectively.
Common and brain area‐specific dynamics of SJ‐enriched proteomes
Reliably quantifiable information was acquired for a total of 67 306 peptides, representing 6272 proteins from all four brain regions analyzed (Fig. 2). Altogether, 3033 different proteins were identified within the four SJ‐enriched preparations. About 55% and 50% of these proteins are listed in the SynProt database of synaptic proteins (www.synprot.de; Pielot et al. 2012) and the ‘Genes‐to‐cognition’ database (https://www.genes2cognition.org/), respectively. Volcano plots demonstrating the relative abundance profiles of all proteins deduced from quantifiable peptides revealed significant training‐induced proteome differences in each of the analyzed brain regions (Fig. 2). In total, the relative abundance of 7369 of the quantified peptides showed significant differences in the SJ‐enriched samples from AV mice when compared to the corresponding samples from NV controls. This corresponds to 4791 protein changes within all analyzed brain regions. Considering that some of these proteins were regulated in multiple regions (Table S3), the changes concern 359 different proteins. About 79% of these regulated proteins are listed in SynProt and 72% in ‘Genes to Cognition’, documenting the enrichment of synaptic and/or cognition‐relevant proteins in the analyzed samples.
Figure 2.
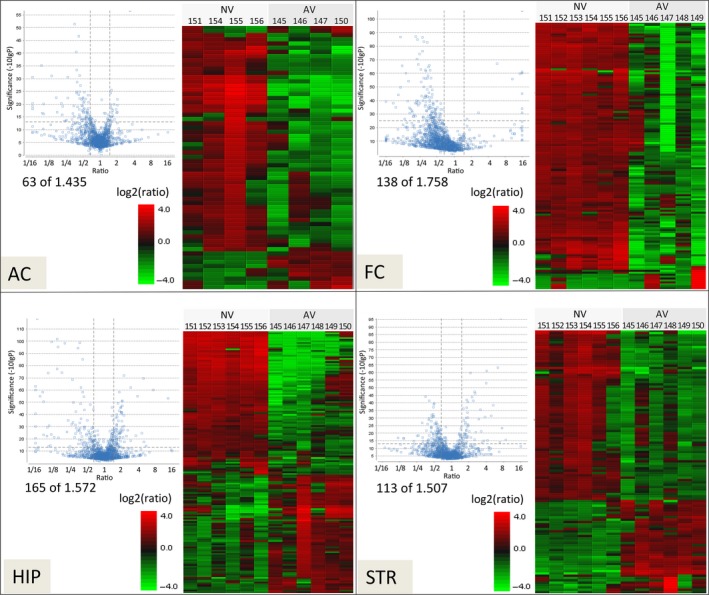
FMTD training‐induced synaptic proteome changes. Proteome analysis was performed on SJ‐enriched samples from the auditory cortex (AC), frontal cortex (FC), hippocampus (HIP), and striatum (STR) of mice of set 1a 24 h after FMTD training (AV) as compared to naïve controls (NV). Left part of each panel: Volcano plots showing the relative abundance ratios (AV/NV) of all identified and quantified proteins. Dashed horizontal and vertical lines indicate the statistical significance thresholds (−10logP ≥ 13) and the protein fold‐change thresholds (AV/NV ratios ≤ 1/1.5 or ≥ 1.5), respectively. AV/NV ratios meeting these criteria are represented by data points in the upper left and upper right subareas; the numbers of these data points and the total numbers of data points are given below the plots. Right part of each panel: Heat map clusters of significantly training‐regulated proteins are shown for NV and AV mice (numbers above the heat maps indicate individual experimental animals; note: because of losses during SJ preparation and/or nanoLC‐mass spectrometry MS/MS, the numbers of individual animal data sets were diminished for AC to n = 4 per group and for FC to n = 5 in the AV group). Hierarchical clustering is generated using the neighbor joining algorithm with an Euclidean distance similarity measurement of the log2 ratios of the abundance of each sample relative to the average abundance. High‐resolution heat maps including cluster analyses are available from synprot (http://www.synprot.de/high-resolution_synaptic_proteome/).
At the level of protein abundance, 7.6% of all quantified proteins showed significant training‐induced changes. To further examine this observation, cluster analyses of these significantly regulated proteins were performed (heat maps in Fig. 2). As detailed in Table S3, statistical analysis revealed eight up‐ and 51 down‐regulated proteins in the AC, four up‐ and 126 down‐regulated proteins in the FC, 76 up‐ and 86 down‐regulated proteins in the HIP, and 35 up‐ and 73 down‐regulated proteins in the STR. Thus, with the exception of the HIP, which showed a rather balanced regulation profile, i.e. comparable numbers of up‐ and down‐regulated proteins, a preference for down‐regulation among the regulated proteins was observed in the other brain regions.
To assess cross‐regional and brain region‐specific profiles of training‐induced synaptic proteome changes, a Venn analysis was performed (Fig. 3). It turned out that 78 (22%) of the 359 significantly regulated proteins showed changes across two or more of the analyzed brain regions. For two proteins, CYFIP2 (Cytoplasmic FMR1‐interacting protein 2, CYFP2_MOUSE; Abekhoukh and Bardoni 2014), and the myelin proteolipid protein (PLP, MYPR_MOUSE), significant abundance changes were detectable in all four brain areas. The general down‐regulation of PLP, a protein mainly produced by oligodendrocytes, is surprising. However, PLP is routinely found associated with synaptic protein fractions including the postsynaptic core complex (www.synprot.de; Fernandez et al. 2009) and its regulation was confirmed by MRM analysis (see Table S5).
Figure 3.
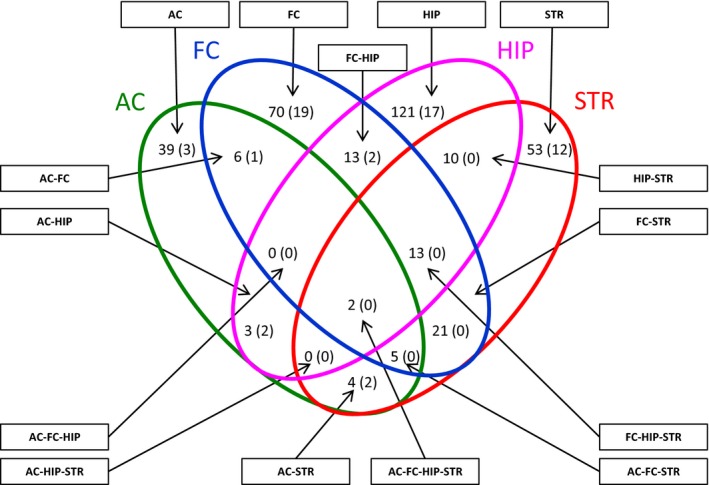
Cross‐regional and region‐specific proteome and phosphoproteome changes. The numbers of significantly regulated SJ‐enriched proteins of the analyzed brain regions after FMTD training are compared in a Venn diagram. Numbers refer to proteins with training‐induced abundance changes in SJ‐enriched protein fractions and numbers in parentheses to proteins with changed phosphorylation patterns upon FMTD training. Venn analysis was performed with the mathematical software package ‘DanteR’ (Pacific Northwest National Laboratory/http://omics.pnl.gov) using data from Tables S3 and S4. AC, auditory cortex; FC, frontal cortex; HIP, hippocampus; STR, striatum.
Eighteen proteins were regulated in the SJ‐enriched fractions of three of the investigated brain regions; 15 of them, including the actin modulator PHAR1/Phactr1 (Phosphatase and actin regulator 1, PHAR1_MOUSE; Allen et al. 2004), the guanosine triphosphate (GTP)‐binding cytoskeletal component Septin‐9 (SEPT9_MOUSE; Mostowy and Cossart 2012), the cell adhesion molecule IgSF8 (Immunoglobulin superfamily member 8, G3UYZ1_MOUSE; Ray and Treloar 2012) as well as a number of RNA‐binding and ‐modifying proteins (Table S3), showed regionally concordant changes. Altogether, 58 proteins are regulated in two of the four regions analyzed (Fig. 3), of which 54 proteins showed regionally concordant changes.
Changes of the vast majority (78%) of significantly regulated proteins after FMTD training were restricted to individual brain regions (Fig. 3) implying a rather autonomous, brain area‐specific regulation of SJ proteins. This notion is supported by the finding that several of the identified proteins are differentially regulated in different brain regions (Table S3). These include CYFIP2 (down‐regulated in AC, FC, and STR, up‐regulated in HIP), the scaffolding protein of the postsynaptic density (PSD) Shank3/ProSAP2 (SH3 and multiple ankyrin repeat domains protein 3, SHAN3_MOUSE; down in FC, up in HIP and STR), and AKAP5 (A‐kinase anchor protein 5, AKAP5_MOUSE; down in AC and FC, up in STR) (Sheng and Hoogenraad 2007), as well as the membrane fission promoting GTPase Dynamin‐1 (DYN1_MOUSE; up in AC, down in FC and STR) (Ferguson and De Camilli 2012). PHAR1/Phactr1 is down‐regulated in FC, HIP, and STR, but to different degrees (Figure S2a).
On the other hand, we find paralogous proteins regulated in a similar way in the same brain region. For instance, members 1 and 3 of the Homer family of postsynaptic scaffolding and adaptor proteins (HOME1_MOUSE, HOME3_MOUSE; Sheng and Hoogenraad 2007) are up‐regulated in HIP (Fig. S2b). Similarly, members of the Septin family of GTP‐binding cytoskeletal‐like proteins (Mostowy and Cossart 2012) are primarily regulated in HIP. Here, the isoforms 2, 5, 6, 8, 11 are up‐regulated. In contrast, Septin‐9 is down‐regulated in HIP as well as in FC and STR (Fig. S2b).
Glial proteins have also been detected in the SJ‐enriched samples as differentially regulated after auditory discrimination training. This includes regulation of the astroglial proteins ezrin (EZRI_MOUSE, down), glutamine synthetase (GLNA_MOUSE, up), and aquaporin‐4 (Q8BR89_MOUSE, down) specifically in the HIP (Table S3). In contrast, the aforementioned PLP (MYPR_MOUSE) was down‐regulated in all four brain regions.
Region‐specific regulation of phosphopeptides in SJ‐enriched protein fractions
Memory processes are associated with a variety of protein modifications, including changes in protein phosphorylation (e.g. Giese and Mizuno 2013; Rosenberg et al. 2014). We used TiO2‐based enrichment of phosphopeptides to study changes in the synaptic phosphoproteome after FMTD training. In total, 4208 phosphopeptides have been identified, originating from 1905 different proteins. The abundances of 58 phosphopeptides in the SJ‐enriched protein fraction exhibited significant differences between trained and naïve mice. Most of these modifications (88%) were detected in individual brain regions only (Fig. 3). A detailed list of significantly regulated phosphopeptides and the deduced proteins is given in Table S4. Interestingly, 53 out of the 58 proteins with training‐related phosphopeptide changes did not exhibit significant simultaneous changes of their protein abundance in the SJ‐enriched protein fraction of the same brain region. Moreover, four proteins in the FC, i.e. two proteins associated with membrane transport processes (AP2‐associated protein kinase 1, AAK1_MOUSE; Conner and Schmid 2002; AP3 complex subunit beta‐2, AP3B2_MOUSE, Faundez et al. 1998), an RNA‐binding protein (Matrin‐3, MATR3_MOUSE; Salton et al. 2011), and the actin‐associated protein β2‐spectrin (Spectrin beta chain, non‐erythrocytic 1, SPTB2_MOUSE), showed opposite changes at the two detection levels. This indicates that training‐induced changes in phosphopeptide abundance do not simply reflect changes in the abundance of a given protein in the SJ‐enriched fractions but also, at least in part, changes in mechanisms of posttranslational modification (phosphorylation/dephosphorylation) of such proteins. Protein modifications in turn can regulate the association with the SJ protein networks (Sheng and Hoogenraad 2007; Sheng and Kim 2011). Strongest up‐regulation of phosphopeptide abundances was observed in β2‐spectrin, the PSD adaptor protein DLGAP3/SAPAP3 (Disks large‐associated protein 3, DLGP3_MOUSE, Welch et al. 2007), the BAR‐domain protein amphiphysin (AMPH_MOUSE) involved in endocytosis (Ren et al. 2006), and the non‐receptor tyrosine kinase Src (neuronal proto‐oncogene tyrosine‐protein kinase Src, SRC_MOUSE, Kalia et al. 2004) in FC. Strong reduction of phosphorylation after training was detected in HIP for the melanoma‐associated antigen E1 (MAGE1_MOUSE) and for transmembrane protein 64 (TMM64_MOUSE), a protein potentially involved in Ca2+ signaling (Kim et al. 2013), and in FC for TrkC (NT‐3 growth factor receptor, NTRK3_MOUSE) (Table S4).
Functional annotation of regulated proteins
To gain insight into cell biological functions underlying the observed proteome changes, we assigned functional categories to the regulated proteins on the basis of the SynProt database (www.synprot.de). In Fig. 4, the numbers of up‐ versus down‐regulated SJ‐associated proteins and phosphoproteins are documented; detailed information is specified in Tables S3 and S4 with respect to detection levels, brain regions, and functional categories. At the level of protein abundance in SJ‐enriched fractions (Fig. 4a), members of the categories ‘cytoskeleton, scaffolding, extracellular matrix (ECM), cell adhesion’ and ‘DNA and RNA binding, transcription, translation’ were among the most frequently regulated proteins. Components of other functional categories, including those with putative functions in inter‐ and intracellular communication, such as ‘endocytosis, exocytosis, trafficking’ and ‘signal transduction’, were recognized as well, but to a lesser extent. In contrast, at the level of phosphopeptide abundance (Fig. 4b), the most prominent effects of auditory discrimination training were evident in the category ‘signal transduction’. The list of proteins showing training‐induced regulation of phosphopeptide abundance (Table S4) includes neurotransmitter and neurotrophin receptors as well as regulators and scaffolds of the synaptic cytomatrix (DLG2, DLGAP3, β2‐spectrin, AP‐3 complex subunit β2, AP2‐associated protein kinase 1).
Figure 4.
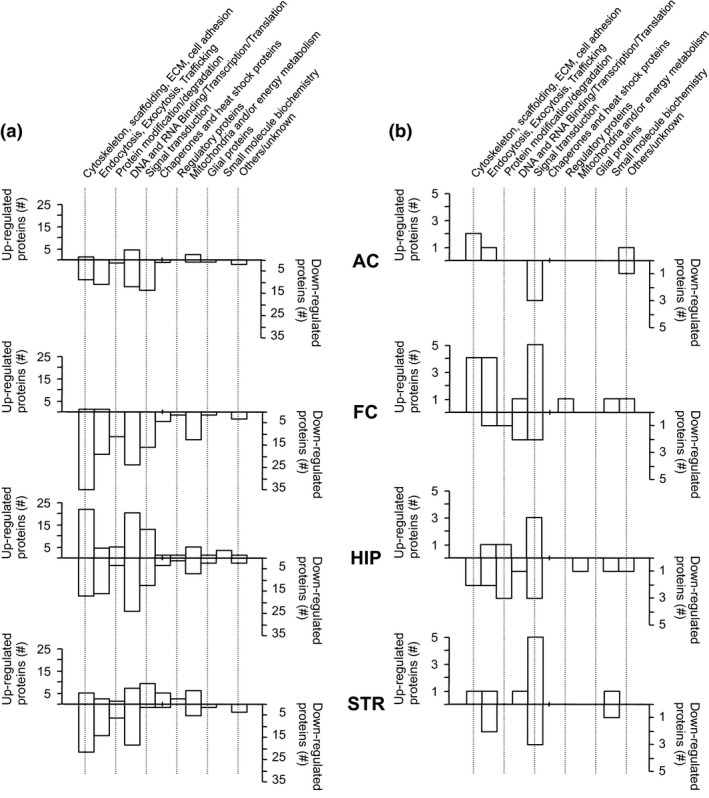
Assignment of FMTD training‐regulated SJ‐enriched proteins to structural and functional elements and processes. (a) Numbers of proteins regulated in their abundance as listed in Table S3. (b) Numbers of proteins with phosphopeptide changes as listed in Table S4. AC, auditory cortex; FC, frontal cortex; HIP, hippocampus; STR, striatum.
To assess biological processes mostly affected by FMTD training, we utilized GeneCodis (Tabas‐Madrid et al. 2012), which performs a single enrichment analysis based on different annotation databases. Data on abundances of proteins and phosphopeptides (Tables S3 and S4) were combined for the analysis, but brain regions were considered separately. To avoid redundant annotations, we took only those terms from the GO database into account that describe biological processes. A graphic overview depicting clustering of GO terms is displayed in Fig. 5 based on data summarized in Table S6. Strikingly, different cellular transport processes including ion transport across membranes as well as intracellular protein and membrane transport (e.g. endo‐ and exocytosis), are significantly regulated. In addition, alterations in the SJ‐enriched proteome indicate that RNA‐based processes, including local protein biosynthesis as well as diverse metabolic and signaling pathways, seem to be involved in learning‐dependent restructuring of synapses. Most interestingly, processes of cellular development, learning, locomotory exploration behavior, and synaptic transmission were also signified by the observed proteomic pattern changes.
Figure 5.
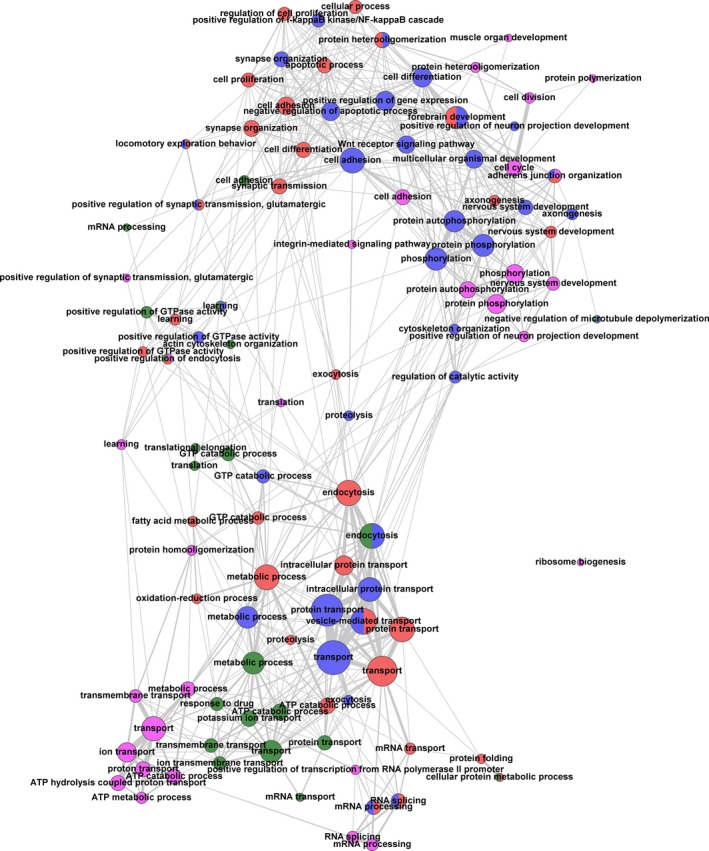
Representation of biological functions and pathways in the identified protein data sets by single enrichment analysis (SEA) utilizing GeneCodis as a tool (see Table S6). The analysis was performed for each examined brain region with the combined data on protein and phosphopeptide abundances (Tables S3 and S4). Annotation databases such as Gene Ontology (GO) (http://geneontology.org/) assign proteins and genes to their ‘biological functions’ or ‘biological pathways’. The SEA tests for significantly represented biological pathways within a given list of proteins. The significance is determined by comparing the frequency of representation of a given pathway in that list with the expected random frequency. The network was calculated by in‐house scripts and visualized with the tool Gephi (http://gephi.github.io/). Only GO terms with at least three proteins in at least one of the brain regions were taken into account. Nodes are depicted as circles. Each node represents a GO term, the color indicates the brain region (green: auditory cortex; blue: frontal cortex; magenta: hippocampus; red: striatum). The size of a given node visualizes the number of proteins that it has in common with other nodes. Additionally, the number and strengths of connections (indicated by line width) indicate the number of proteins that a particular node shares with other nodes. Numbers and strengths of connections, in turn, determine the distance of nodes, thus clustering closely related nodes. If nodes represent the same GO term and include identical sets of proteins, but derive from different brain regions, they were merged into one node (indicated by respective colors).
Further, IPA was used to identify canonical pathways represented by the proteomic changes 24 h after the learning experiment. Table 1 lists 11 pathways with highest significance levels. While more general pathways like ‘clathrin‐mediated endocytosis signaling’ and ‘remodeling of adherens junctions’ were altered in all the brain regions investigated, more specific canonical pathways were identified in individual areas. ‘GABA receptor signaling’ representing components of the main inhibitory system was significantly affected in the cortical subfields AC and FC as well as in the STR, but not in the HIP. On the other hand, ‘glutamate receptor signaling’ and the related pathway of ‘synaptic long‐term potentiation (LTP)’ were identified as key pathways in the HIP, a prime target region for learning‐related LTP. Intriguingly, in the STR, a central area of the dopaminergic reinforcement‐analyzing system, the ‘dopamine receptor signaling’ pathway turned out to be significantly influenced. Finally, ‘Notch signaling’ and ‘calcium signaling’ were identified with significance in the FC only. It should be noted that even those cellular processes and pathways found to be regulated in all analyzed brain regions were represented by area‐specific changes of individual components (e.g. Figure S4) pointing to additional regional specificity of the induced biological processes and their underlying signaling networks.
Table 1.
Top canonical pathways represented by identified changes in the synaptic proteomes in individual brain regions
| Top canonical pathways | Auditory cortex | Frontal cortex | Hippocampus | Striatum | ||||
|---|---|---|---|---|---|---|---|---|
| p‐value | n r/n tot | p‐value | n r/n tot | p‐value | n r/n tot | p‐value | n r/n tot | |
| Clathrin‐mediated endocytosis signaling | 3.31E‐03 | 4/185 | 9.11E‐08 | 11/185 | 6.31E‐03 | 6/185 | 1.58E‐06 | 9/185 |
| Axonal guidance signaling | 0.422 | 2/433 | 3.57E‐02 | 7/433 | 1.55E‐02 | 9/433 | – | – |
| Calcium signaling | 0.118 | 2/178 | 3.87E‐02 | 4/178 | 0.211 | 3/178 | 8.91E‐02 | 3/178 |
| Regulation of cellular mechanics by calpain protease | – | – | 0.335 | 1/57 | 1.66E‐03 | 4/57 | 0.288 | 1/57 |
| RhoA signaling | 0.333 | 1/122 | 0.216 | 2/122 | 1.35E‐05 | 8/122 | 3.63E‐02 | 3/122 |
| Notch signaling | – | – | 2.49E‐03 | 3/38 | 0.288 | 1/38 | 0.202 | 1/38 |
| Remodeling of epithelial adherens junctions | 2.14E‐02 | 2/68 | 8.97E‐06 | 6/68 | 3.16E‐03 | 4/68 | 7.08E‐04 | 4/68 |
| Glutamate receptor signaling | 0.173 | 1/57 | 0.335 | 1/57 | 1.66E‐03 | 4/57 | 0.288 | 1/57 |
| GABA receptor signaling | 2.09E‐02 | 2/67 | 1.16E‐04 | 5/67 | 0.119 | 2/67 | 6.76E‐04 | 4/67 |
| Dopamine receptor signaling | – | – | – | – | 0.502 | 1/78 | 1.20E‐03 | 4/78 |
| Synaptic long‐term potentiation | 5.89E‐02 | 2/119 | 0.208 | 2/119 | 2.19E‐02 | 4/119 | 0.157 | 2/119 |
For this analysis QIAGEN's Ingenuity® Pathway Analysis (IPA®, QIAGEN Redwood City, www.qiagen.com/ingenuity) was used: Selection criteria were minimum significance levels < 0.05 and at least three proteins per pathway in at least one brain region. n r/n tot – The table gives the number of regulated proteins identified in the proteomics screen (n r) in relation to the total number of proteins in the reference proteome of the defined Ingenuity® pathway (n tot). p‐values indicating significant overlaps are given in bold. For the analysis, the combined data of synaptic protein and phosphopeptide abundances (Tables S3 and S4) were used.
Discussion
The findings of this study suggest that training mice to discriminate the modulation direction of FM tones in order to avoid mild foot‐shock reduces the association of proteins with synaptic cytomatrices in the cortical, hippocampal, and striatal brain samples 24 h later. At the level of protein abundance, less than 8% of 6272 quantified proteins showed significant training‐induced changes. Most of these alterations were detected in individual brain regions; only 20 proteins show significant regulation in three or four of the brain areas investigated. At the phosphopeptide level, ≈ 3% of 1905 identified proteins were significantly regulated 24 h after FMTD training. Again, the vast majority of these modifications were restricted to individual brain regions. Most of the proteins found to be regulated in particular regions were identified in other regions as not significantly regulated, suggesting brain region‐specific effects of FMTD training.
Protein networks underlying FMTD learning
The actin cytoskeleton and its regulatory proteins participate in learning‐dependent synaptic plasticity processes subserving various types of memories (for review, see Lamprecht 2014). Consistent with previous findings regarding the molecular signature of the FMTD learning paradigm (Kähne et al. 2012), this study, focusing on a different set of synaptic proteins, emphasizes the involvement of proteins crucial for the re‐organization of cellular structure. Relative down‐regulation of the majority of regulated SJ‐enriched proteins suggests that learning processes may initially loosen the association of proteins with synaptic cytomatrices to facilitate subsequent long‐lasting plastic rearrangements (for discussion, see Kähne et al. 2012). A network of FMTD training‐regulated proteins based on the IPA networks ‘cellular assembly and organization’ and ‘cell morphology’ revealed a number of actin cytoskeletal elements and interacting components of the PSD (Figure S4) – many of them known to be involved in synaptic plasticity and assembly. Among these, Shank3/ProSAP2, AKAP5, and PHAR1/Phactr1 are found regulated in three of the four investigated brain areas. Shank3 is known as major postsynaptic scaffold protein interacting directly or indirectly with a variety of membrane and cytoplasmic proteins (Gundelfinger et al. 2006). AKAP5 is a scaffold for a major signaling complex in excitatory synapses (Sanderson and Dell'Acqua 2011) and Phactr1 is a G‐actin and phosphatase‐1‐binding protein (Allen et al. 2004). Another very interesting protein regulated in all four analyzed brain areas is the cytoplasmic fragile X mental retardation protein (FMRP)‐interacting RNA‐binding protein CYFIP2. CYFIPs are also part of the WAVE complex and thus involved in Rac signaling to trigger Arp2/3‐dependent actin nucleation. This process is known to be important in the spatiotemporal regulation of actin dynamics in cell adhesion and vesicle trafficking as well as synaptic development and plasticity (Abekhoukh and Bardoni 2014). Shank3 indirectly acts on the WAVE complex (Figure S4; Han et al. 2013). Phactr1 is supposed to play also an important role in actin reorganization (Allen et al. 2004; Allain et al. 2012) and to make contact with the central PSD scaffolding protein PSD‐95 (DLG4) (Arbuckle et al. 2010). In addition to the widely regulated CYFIP2, Shank3, and Phactr1, some elements of the actin‐associated machinery were modulated differentially in individual brain areas (Figure S4b–e). For example, in the FC, the actin‐associated proteins β‐Adducin (Q8C0Y2‐MOUSE), Wiskott‐Aldrich syndrome family member 1 (WASF1/WAVE1, WASF1_MOUSE), Cortactin‐binding protein 2 (CTTBP2, CTTB2_MOUSE), and Cortactin‐binding protein N‐terminal‐like protein (CTTBP2NL, CT2NL_MOUSE) were specifically regulated (Figure S4c). All four proteins have been implicated in dendrite and spine plasticity and in learning and memory processes (Soderling et al. 2003, 2007; Rabenstein et al. 2005; Bednarek and Caroni 2011; Ruediger et al. 2011; Chen and Hsueh 2012; Chen et al. 2012; Shih et al. 2014). Moreover, neurotransmitter receptors, including GluA2‐ and GluN2B‐containing glutamate receptors and the D1 dopamine receptor are synaptic membrane proteins linked to the subsynaptic protein network and differentially regulated in the brain structures analyzed (Figure S4b–e).
Septins constitute a family of proteins regulated 24 h after the learning experiment. These proteins are considered as the ‘fourth component of the cytoskeleton’ (Mostowy and Cossart 2012) involved in the coordination of actin and microtubule remodeling in neurites, lateral compartmentalization of membranes, and entry of membrane proteins into dendritic spines (Caudron and Barral 2009; Hu et al. 2012; Ageta‐Ishihara et al. 2013; Ewers et al. 2014). In the CNS, septins are abundant and exhibit cell type‐specific and developmentally regulated patterns of expression (Finger et al. 2003; Shinoda et al. 2010). Interestingly, septin‐5, 6, and 11, which were up‐regulated in the hippocampus, are localized at dendritic branch points and at the base of dendritic spines (Xie et al. 2007). Depletion of septin‐6 or ‐11 reduces dendritic arborization and alters the length, density, and head morphology of dendritic spines (Cho et al. 2011).
Considering the intimate physical and physiological connection of astrocytes and neurons at synaptic junctions, it is not surprising that also specific astroglial proteins have been detected and found to be differentially regulated after FMTD training. Of particular interest might be the differential regulation of the astroglial proteins ezrin (down), glutamine synthetase (up), and aquaporin‐4 (down) specifically in the HIP. The actin cytoskeleton‐associated protein ezrin is a key component of peripheral astrocytic processes (PAP) associated with synapses and critical for motility of these fine processes and thereby the structural plasticity of PAPs (Lavialle et al. 2011). In conjunction with the down‐regulation of aquaporin‐4, which is generally positively correlated with astroglial volume and may regulate ‘adaptive swelling’ of PAPs (Nagelhus et al. 2004), and increased levels of glutamine synthetase, reciprocal alterations in synaptic activity might be directly reflected on the level of the tripartite synapse (Clarke and Barres 2013). As neurons and synapses share identical proteins (receptors, channels, cell adhesion molecules, ECM components and many regulatory proteins) in particular with astrocytes, it is an unresolved question at this point, in which cell type the observed changes in these ‘shared’ proteins upon auditory discrimination do really occur.
Protein phosphorylation is a key event in regulating activity, subcellular localization, and protein interactions at the synapse. Being a very rapid protein modification occurring already within seconds to minutes after stimulation, its duration depends on a delicate balance between protein kinases and phosphatases. Experience‐dependent changes in phosphorylation capacities are known for decades (Ehrlich et al. 1977). Here, we found specific changes in phosphoprotein patterns 24 h after FMTD training, pointing to long‐term deviations of the synaptic phosphoproteome. In the FC, a particularly prominent increase in phosphorylation was monitored for the non‐receptor tyrosine kinase Src at Ser‐17. This residue is known to be phosphorylated by protein kinase A in response to cAMP stimulation, e.g. by neurotransmitters or growth factors, where it may be involved in the control of neurite outgrowth via Rap1 activation (Obara et al. 2004; Kennedy et al. 2005; Amata et al. 2014). Another protein that is highly phosphorylated in the FC after FMTD training is DLGAP3/SAPAP3 at Ser‐712. Mutants affecting this protein display defects at corticostriatal synapses and compulsive disorder‐like behavior (Welch et al. 2007; Wan et al. 2014). Long‐term up‐regulation of Ser‐712 phosphorylation in DLGAP3/SAPAP3 has also been reported in the rodent hippocampus paralleling spatial memory retrieval in the Barnes maze (Li et al. 2014).
In silico analysis of the data acquired in this study revealed several biological processes and pathways as modulated after the FMTD learning experiment. Membrane transport processes, modulation of cell–cell junctions and the cell‐cortical actin‐based cytoskeleton, RNA processing, RNA transport, and protein synthesis were affected in all the four brain regions (Tables 1 and S6). However, within these pathways, different components were found to be regulated (Fig. 5; see also Figure S4). Other biological pathways seemed to be modulated significantly only in one or two of the analyzed brain areas. This suggests spatial and/or temporal selectivity for the dynamics of synaptic proteomes, potentially representing differential processes of synaptic plasticity in the different brain regions at the investigated time point after the learning experiment.
Implications for understanding cortex‐dependent memory formation during FMTD learning
Our previous studies in gerbils suggested that increased cortical glutamate and dopamine signaling during and immediately after FMTD learning may induce different protein synthesis‐dependent processes that support initial memory retention for about 1 day as well as long‐term memory consolidation and anterograde memory formation (Kraus et al. 2002; Tischmeyer et al. 2003; Schicknick and Tischmeyer 2006; Schicknick et al. 2008). Our present findings suggest that learning the new task and/or experiencing initial prerequisites necessary for learning, such as stimulus novelty, led to increased synaptic remodeling in brain regions implicated in FMTD learning and memory.
The vast majority of alterations detected in this study 24 h after the learning experiment were restricted to individual brain regions, implying that FMTD learning may induce region‐specific synaptic proteome and phosphoproteome changes. In the HIP, SJ‐enriched proteins representing the pathways ‘regulation of cellular mechanics by calpain protease’, ‘glutamate receptor signaling’, and ‘synaptic long‐term potentiation’, a well‐characterized cellular form of synaptic plasticity thought to underlie learning and memory, were regulated (Table 1). Regulation of the pathway ‘calcium signaling’ was detected in the FC, and ‘dopamine receptor signaling’ was monitored in striatal regions, which are the principal recipient structures of midbrain dopamine axons (Tritsch and Sabatini 2012). Memory consolidation is assumed to involve interactions of networks in multiple brain regions over days or weeks (Wiltgen et al. 2004; Frankland and Bontempi 2005). The HIP is believed to integrate information from distributed cortical networks into a coherent memory trace and to mediate its temporary storage and retrieval. For remote memory storage and retrieval, neurons in the cortex, in particular in frontal regions, must undergo a tagging process early upon encoding (Lesburgueres et al. 2011); consolidation of the memory trace at the cortical level would then occur slowly via repeated reactivation of hippocampo‐cortical networks. Corticostriatal synaptic plasticity may enable the learned transformation of sound representation into behavioral action during auditory‐cued decision‐making (Xiong et al. 2015). Thus, in view of the concept of an active redistribution of memory representations from temporary into long‐term stores (Squire and Alvarez 1995), the present findings may be indicative of learning‐induced mechanisms mediating – probably under dopaminergic control (Reichenbach et al. 2015) – different aspects of memory consolidation. At the molecular level, it is tempting to speculate that mechanisms of post‐translational protein modification, such as phosphorylation, calpain‐activated proteolysis, and cytoskeletal reorganization, that have previously been implicated in long‐term memory formation and maintenance (e.g. Routtenberg and Rekart 2005; Giese and Mizuno 2013; Kwapis and Helmstetter 2014), might participate in the management of FMTD memory for at least 1 day after the learning event.
In conclusion, this study revealed cross‐regional as well as distinctive synaptic proteome and phosphoproteome changes in cortical and subcortical brain regions of mice 24 h after differential conditioning to FM tones, which may be indicative of mechanisms supporting different aspects of memory consolidation.
Supporting information
Table S1. (a) MIAPE‐compliant MS‐description for label‐free MS proteomics. (b) MIAPE‐compliant MSI‐description for label‐free MS proteomics. (c) MIAPE‐compliant MS‐description for MRM. (d) MIAPE‐compliant MSI‐description for MRM.
Table S2. Antibodies used for western blot verification.
Table S3. Proteins showing abundance changes in the SJ‐enriched samples from different brain regions of mice 24 h after FMTD training.
Table S4. Phosphopeptides and deduced proteins showing abundance changes in the SJ‐enriched samples from different brain regions of mice 24 h after FMTD training.
Table S5. Verification of the regulation of selected proteins.
Table S6. Data for single enrichment analysis with GeneCodis.
Figure S1. Performance in the FMTD paradigm.
Figure S2. Differential regulation of synaptic protein abundance in analyzed brain regions.
Figure S3. Verification of the regulation of selected proteins by western blot analysis.
Figure S4. Regional differences in the modulation of synaptic protein networks.
Acknowledgments and conflict of interest disclosure
We thank Yvonne Ducho and Kathrin Pohlmann for excellent technical assistance. This work was supported by the Deutsche Forschungsgemeinschaft (SFB 779) and by the State Saxony‐Anhalt/European Regional Development Fund (ERDF) via the Center for Behavioral Brain Sciences (CBBS) to E.D.G, T.K., M.N., F.W.O., W.T., C.S., D.C.D., K.H.S.; and the Initiative for Research and Innovation of the Leibniz Association (SAW) to E.D.G. and D.C.D. There is no financial/commercial conflict of interests.
All experiments were conducted in compliance with the ARRIVE guidelines.
Note
459 after removal of artifacts and double database entries.
References
- Abekhoukh S. and Bardoni B. (2014) CYFIP family proteins between autism and intellectual disability: links with Fragile X syndrome. Front. Cell. Neurosci. 8, 81. [DOI] [PMC free article] [PubMed] [Google Scholar]
- Ageta‐Ishihara N., Miyata T., Ohshima C., Watanabe M., Sato Y., Hamamura Y., Higashiyama T., Mazitschek R., Bito H. and Kinoshita M. (2013) Septins promote dendrite and axon development by negatively regulating microtubule stability via HDAC6‐mediated deacetylation. Nat. Commun. 4, 2532. [DOI] [PMC free article] [PubMed] [Google Scholar]
- Allain B., Jarray R., Borriello L. et al (2012) Neuropilin‐1 regulates a new VEGF‐induced gene, Phactr‐1, which controls tubulogenesis and modulates lamellipodial dynamics in human endothelial cells. Cell. Signal. 24, 214–223. [DOI] [PubMed] [Google Scholar]
- Allen P. B., Greenfield A. T., Svenningsson P., Haspeslagh D. C. and Greengard P. (2004) Phactrs 1‐4: a family of protein phosphatase 1 and actin regulatory proteins. Proc. Natl Acad. Sci. USA 101, 7187–7192. [DOI] [PMC free article] [PubMed] [Google Scholar]
- Amata I., Maffei M. and Pons M. (2014) Phosphorylation of unique domains of Src family kinases. Front. Genet. 5, 181. [DOI] [PMC free article] [PubMed] [Google Scholar]
- Arbuckle M. I., Komiyama N. H., Delaney A. et al (2010) The SH3 domain of postsynaptic density 95 mediates inflammatory pain through phosphatidylinositol‐3‐kinase recruitment. EMBO Rep. 11, 473–478. [DOI] [PMC free article] [PubMed] [Google Scholar]
- Bednarek E. and Caroni P. (2011) beta‐Adducin is required for stable assembly of new synapses and improved memory upon environmental enrichment. Neuron 69, 1132–1146. [DOI] [PubMed] [Google Scholar]
- Benjamini Y. and Hochberg Y. (1995) Controlling the False Discovery Rate ‐ a Practical and Powerful Approach to Multiple Testing. J. R. Stat. Soc. Series B Methodol. 57, 289–300. [Google Scholar]
- Bingol B. and Schuman E. M. (2005) Synaptic protein degradation by the ubiquitin proteasome system. Curr. Opin. Neurobiol. 15, 536–541. [DOI] [PubMed] [Google Scholar]
- Bonn S., Seeburg P. H. and Schwarz M. K. (2007) Combinatorial expression of alpha‐ and gamma‐protocadherins alters their presenilin‐dependent processing. Mol. Cell. Biol. 27, 4121–4132. [DOI] [PMC free article] [PubMed] [Google Scholar]
- Budinger E. and Scheich H. (2009) Anatomical connections suitable for the direct processing of neuronal information of different modalities via the rodent primary auditory cortex. Hear. Res. 258, 16–27. [DOI] [PubMed] [Google Scholar]
- Caudron F. and Barral Y. (2009) Septins and the lateral compartmentalization of eukaryotic membranes. Dev. Cell 16, 493–506. [DOI] [PubMed] [Google Scholar]
- Chen Y. K. and Hsueh Y. P. (2012) Cortactin‐binding protein 2 modulates the mobility of cortactin and regulates dendritic spine formation and maintenance. J. Neurosci. 32, 1043–1055. [DOI] [PMC free article] [PubMed] [Google Scholar]
- Chen Y. K., Chen C. Y., Hu H. T. and Hsueh Y. P. (2012) CTTNBP2, but not CTTNBP2NL, regulates dendritic spinogenesis and synaptic distribution of the striatin‐PP2A complex. Mol. Biol. Cell 23, 4383–4392. [DOI] [PMC free article] [PubMed] [Google Scholar]
- Cho S. J., Lee H., Dutta S., Song J., Walikonis R. and Moon I. S. (2011) Septin 6 regulates the cytoarchitecture of neurons through localization at dendritic branch points and bases of protrusions. Mol. Cells 32, 89–98. [DOI] [PMC free article] [PubMed] [Google Scholar]
- Chua J. J., Kindler S., Boyken J. and Jahn R. (2010) The architecture of an excitatory synapse. J. Cell Sci. 123, 819–823. [DOI] [PubMed] [Google Scholar]
- Clarke L. E. and Barres B. A. (2013) Emerging roles of astrocytes in neural circuit development. Nat. Rev. Neurosci. 14, 311–321. [DOI] [PMC free article] [PubMed] [Google Scholar]
- Conner S. D. and Schmid S. L. (2002) Identification of an adaptor‐associated kinase, AAK1, as a regulator of clathrin‐mediated endocytosis. J. Cell Biol. 156, 921–929. [DOI] [PMC free article] [PubMed] [Google Scholar]
- Ehrlich Y. H., Rabjohns R. R. and Routtenberg A. (1977) Experiential input alters the phosphorylation of specific proteins in brain membranes. Pharmacol. Biochem. Behav. 6, 169–174. [DOI] [PubMed] [Google Scholar]
- Ewers H., Tada T., Petersen J. D., Racz B., Sheng M. and Choquet D. (2014) A Septin‐Dependent Diffusion Barrier at Dendritic Spine Necks. PLoS ONE 9, e113916. [DOI] [PMC free article] [PubMed] [Google Scholar]
- Faundez V., Horng J. T. and Kelly R. B. (1998) A function for the AP3 coat complex in synaptic vesicle formation from endosomes. Cell 93, 423–432. [DOI] [PubMed] [Google Scholar]
- Ferguson S. M. and De Camilli P. (2012) Dynamin, a membrane‐remodelling GTPase. Nat. Rev. Mol. Cell Biol. 13, 75–88. [DOI] [PMC free article] [PubMed] [Google Scholar]
- Fernandez E., Collins M. O., Uren R. T., Kopanitsa M. V., Komiyama N. H., Croning M. D., Zografos L., Armstrong J. D., Choudhary J. S. and Grant S. G. (2009) Targeted tandem affinity purification of PSD‐95 recovers core postsynaptic complexes and schizophrenia susceptibility proteins. Mol. Syst. Biol. 5, 269. [DOI] [PMC free article] [PubMed] [Google Scholar]
- Finger F. P., Kopish K. R. and White J. G. (2003) A role for septins in cellular and axonal migration in C. elegans. Dev. Biol. 261, 220–234. [DOI] [PubMed] [Google Scholar]
- Frankland P. W. and Bontempi B. (2005) The organization of recent and remote memories. Nat. Rev. Neurosci. 6, 119–130. [DOI] [PubMed] [Google Scholar]
- Giese K. P. and Mizuno K. (2013) The roles of protein kinases in learning and memory. Learn. Mem. 20, 540–552. [DOI] [PubMed] [Google Scholar]
- Gundelfinger E. D., Boeckers T. M., Baron M. K. and Bowie J. U. (2006) A role for zinc in postsynaptic density asSAMbly and plasticity? Trends Biochem. Sci. 31, 366–373. [DOI] [PubMed] [Google Scholar]
- Han K., Holder J. L. Jr, Schaaf C. P. et al (2013) SHANK3 overexpression causes manic‐like behaviour with unique pharmacogenetic properties. Nature 503, 72–77. [DOI] [PMC free article] [PubMed] [Google Scholar]
- Henninger N., Feldmann R. E. Jr, Futterer C. D., Schrempp C., Maurer M. H., Waschke K. F., Kuschinsky W. and Schwab S. (2007) Spatial learning induces predominant downregulation of cytosolic proteins in the rat hippocampus. Genes Brain Behav. 6, 128–140. [DOI] [PubMed] [Google Scholar]
- Hu J., Bai X., Bowen J. R., Dolat L., Korobova F., Yu W., Baas P. W., Svitkina T., Gallo G. and Spiliotis E. T. (2012) Septin‐driven coordination of actin and microtubule remodeling regulates the collateral branching of axons. Curr. Biol. 22, 1109–1115. [DOI] [PMC free article] [PubMed] [Google Scholar]
- Ilango A., Shumake J., Wetzel W., Scheich H. and Ohl F. W. (2012) The role of dopamine in the context of aversive stimuli with particular reference to acoustically signaled avoidance learning. Front. Neurosci. 6, 132. [DOI] [PMC free article] [PubMed] [Google Scholar]
- Ilango A., Shumake J., Wetzel W. and Ohl F. W. (2014) Contribution of emotional and motivational neurocircuitry to cue‐signaled active avoidance learning. Front. Behav. Neurosci. 8, 372. [DOI] [PMC free article] [PubMed] [Google Scholar]
- Jüch M., Smalla K. H., Kahne T., Lubec G., Tischmeyer W., Gundelfinger E. D. and Engelmann M. (2009) Congenital lack of nNOS impairs long‐term social recognition memory and alters the olfactory bulb proteome. Neurobiol. Learn. Mem. 92, 469–484. [DOI] [PubMed] [Google Scholar]
- Kähne T., Kolodziej A., Smalla K. H. et al (2012) Synaptic proteome changes in mouse brain regions upon auditory discrimination learning. Proteomics 12, 2433–2444. [DOI] [PMC free article] [PubMed] [Google Scholar]
- Kalia L. V., Gingrich J. R. and Salter M. W. (2004) Src in synaptic transmission and plasticity. Oncogene 23, 8007–8016. [DOI] [PubMed] [Google Scholar]
- Kandel E. R., Dudai Y. and Mayford M. R. (2014) The molecular and systems biology of memory. Cell 157, 163–186. [DOI] [PubMed] [Google Scholar]
- Kennedy M. B., Beale H. C., Carlisle H. J. and Washburn L. R. (2005) Integration of biochemical signalling in spines. Nat. Rev. Neurosci. 6, 423–434. [DOI] [PubMed] [Google Scholar]
- Kim H., Kim T., Jeong B. C. et al (2013) Tmem64 modulates calcium signaling during RANKL‐mediated osteoclast differentiation. Cell Metab. 17, 249–260. [DOI] [PMC free article] [PubMed] [Google Scholar]
- Kraus M., Schicknick H., Wetzel W., Ohl F., Staak S. and Tischmeyer W. (2002) Memory consolidation for the discrimination of frequency‐modulated tones in mongolian gerbils is sensitive to protein‐synthesis inhibitors applied to the auditory cortex. Learn. Mem. 9, 293–303. [DOI] [PMC free article] [PubMed] [Google Scholar]
- Kwapis J. L. and Helmstetter F. J. (2014) Does PKM(zeta) maintain memory? Brain Res. Bull. 105, 36–45. [DOI] [PMC free article] [PubMed] [Google Scholar]
- Lamprecht R. (2014) The actin cytoskeleton in memory formation. Prog. Neurobiol. 117, 1–19. [DOI] [PubMed] [Google Scholar]
- Lamprecht R. and LeDoux J. (2004) Structural plasticity and memory. Nat. Rev. Neurosci. 5, 45–54. [DOI] [PubMed] [Google Scholar]
- Lassek M., Weingarten J. and Volknandt W. (2015) The synaptic proteome. Cell Tissue Res. 359, 255–265. [DOI] [PubMed] [Google Scholar]
- Lavialle M., Aumann G., Anlauf E., Prols F., Arpin M. and Derouiche A. (2011) Structural plasticity of perisynaptic astrocyte processes involves ezrin and metabotropic glutamate receptors. Proc. Natl Acad. Sci. USA 108, 12915–12919. [DOI] [PMC free article] [PubMed] [Google Scholar]
- Lesburgueres E., Gobbo O. L., Alaux‐Cantin S., Hambucken A., Trifilieff P. and Bontempi B. (2011) Early tagging of cortical networks is required for the formation of enduring associative memory. Science 331, 924–928. [DOI] [PubMed] [Google Scholar]
- Li L., Csaszar E., Szodorai E., Patil S., Pollak A. and Lubec G. (2014) The differential hippocampal phosphoproteome of Apodemus sylvaticus paralleling spatial memory retrieval in the Barnes maze. Behav. Brain Res. 264, 126–134. [DOI] [PubMed] [Google Scholar]
- MacLean B., Tomazela D. M., Shulman N., Chambers M., Finney G. L., Frewen B., Kern R., Tabb D. L., Liebler D. C. and MacCoss M. J. (2010) Skyline: an open source document editor for creating and analyzing targeted proteomics experiments. Bioinformatics 26, 966–968. [DOI] [PMC free article] [PubMed] [Google Scholar]
- Matthies H. (1989) In search of cellular mechanisms of memory. Prog. Neurobiol. 32, 277–349. [DOI] [PubMed] [Google Scholar]
- McGaugh J. L. (2000) Memory–a century of consolidation. Science 287, 248–251. [DOI] [PubMed] [Google Scholar]
- Meparishvili M., Nozadze M., Margvelani G., McCabe B. J. and Solomonia R. O. (2015) A Proteomic Study of Memory After Imprinting in the Domestic Chick. Front. Behav. Neurosci. 9, 319. [DOI] [PMC free article] [PubMed] [Google Scholar]
- Moczulska K. E., Tinter‐Thiede J., Peter M., Ushakova L., Wernle T., Bathellier B. and Rumpel S. (2013) Dynamics of dendritic spines in the mouse auditory cortex during memory formation and memory recall. Proc. Natl Acad. Sci. USA 110, 18315–18320. [DOI] [PMC free article] [PubMed] [Google Scholar]
- Monopoli M. P., Raghnaill M. N., Loscher J. S. et al (2011) Temporal proteomic profile of memory consolidation in the rat hippocampal dentate gyrus. Proteomics 11, 4189–4201. [DOI] [PubMed] [Google Scholar]
- Mostowy S. and Cossart P. (2012) Septins: the fourth component of the cytoskeleton. Nat. Rev. Mol. Cell Biol. 13, 183–194. [DOI] [PubMed] [Google Scholar]
- Myhrer T. (1976) Shuttle‐box performance in rats with disruption of hippocampal CA1 output. Brain Res. 110, 376–380. [DOI] [PubMed] [Google Scholar]
- Nagelhus E. A., Mathiisen T. M. and Ottersen O. P. (2004) Aquaporin‐4 in the central nervous system: cellular and subcellular distribution and coexpression with KIR4.1. Neuroscience 129, 905–913. [DOI] [PubMed] [Google Scholar]
- Obara Y., Labudda K., Dillon T. J. and Stork P. J. (2004) PKA phosphorylation of Src mediates Rap1 activation in NGF and cAMP signaling in PC12 cells. J. Cell Sci. 117, 6085–6094. [DOI] [PubMed] [Google Scholar]
- Ohl F. W. (2015) Role of cortical neurodynamics for understanding the neural basis of motivated behavior ‐ lessons from auditory category learning. Curr. Opin. Neurobiol. 31, 88–94. [DOI] [PubMed] [Google Scholar]
- Ohl F. W., Wetzel W., Wagner T., Rech A. and Scheich H. (1999) Bilateral ablation of auditory cortex in Mongolian gerbil affects discrimination of frequency modulated tones but not of pure tones. Learn. Mem. 6, 347–362. [PMC free article] [PubMed] [Google Scholar]
- Ohl F. W., Scheich H. and Freeman W. J. (2001) Change in pattern of ongoing cortical activity with auditory category learning. Nature 412, 733–736. [DOI] [PubMed] [Google Scholar]
- Pavlova T. V., Stepanichev M. Y., Gekht A. B. and Gulyaeva N. V. (2010) Acquisition of an active avoidance reaction in rats and morphological changes in the hippocampus in pentylenetetrazol kindling. Neurosci. Behav. Physiol. 40, 501–506. [DOI] [PubMed] [Google Scholar]
- Pielot R., Smalla K. H., Muller A., Landgraf P., Lehmann A. C., Eisenschmidt E., Haus U. U., Weismantel R., Gundelfinger E. D. and Dieterich D. C. (2012) SynProt: a Database for Proteins of Detergent‐Resistant Synaptic Protein Preparations. Front. Synaptic Neurosci. 4, 1. [DOI] [PMC free article] [PubMed] [Google Scholar]
- Rabenstein R. L., Addy N. A., Caldarone B. J., Asaka Y., Gruenbaum L. M., Peters L. L., Gilligan D. M., Fitzsimonds R. M. and Picciotto M. R. (2005) Impaired synaptic plasticity and learning in mice lacking beta‐adducin, an actin‐regulating protein. J. Neurosci. 25, 2138–2145. [DOI] [PMC free article] [PubMed] [Google Scholar]
- Rao‐Ruiz P., Carney K. E., Pandya N., van der Loo R. J., Verheijen M. H., van Nierop P., Smit A. B. and Spijker S. (2015) Time‐dependent changes in the mouse hippocampal synaptic membrane proteome after contextual fear conditioning. Hippocampus 25, 1250–1261. [DOI] [PubMed] [Google Scholar]
- Ray A. and Treloar H. B. (2012) IgSF8: a developmentally and functionally regulated cell adhesion molecule in olfactory sensory neuron axons and synapses. Mol. Cell Neurosci. 50, 238–249. [DOI] [PMC free article] [PubMed] [Google Scholar]
- Reichenbach N., Herrmann U., Käthne T., Schicknick H., Pielot R., Naumann M., Dieterich D. C., Gundelfinger E. D., Smalla K. H. and Tischmeyer W. (2015) Differential effects of dopamine signalling on long‐term memory formation and consolidation in rodent brain. Proteome Sci. 13, 13. [DOI] [PMC free article] [PubMed] [Google Scholar]
- Ren G., Vajjhala P., Lee J. S., Winsor B. and Munn A. L. (2006) The BAR domain proteins: molding membranes in fission, fusion, and phagy. Microbiol. Mol. Biol. Rev. 70, 37–120. [DOI] [PMC free article] [PubMed] [Google Scholar]
- Richter J. D. and Klann E. (2009) Making synaptic plasticity and memory last: mechanisms of translational regulation. Genes Dev. 23, 1–11. [DOI] [PubMed] [Google Scholar]
- Rosenberg T., Gal‐Ben‐Ari S., Dieterich D. C., Kreutz M. R., Ziv N. E., Gundelfinger E. D. and Rosenblum K. (2014) The roles of protein expression in synaptic plasticity and memory consolidation. Front. Mol. Neurosci. 7, 86. [DOI] [PMC free article] [PubMed] [Google Scholar]
- Routtenberg A. and Rekart J. L. (2005) Post‐translational protein modification as the substrate for long‐lasting memory. Trends Neurosci. 28, 12–19. [DOI] [PubMed] [Google Scholar]
- Ruediger S., Vittori C., Bednarek E., Genoud C., Strata P., Sacchetti B. and Caroni P. (2011) Learning‐related feedforward inhibitory connectivity growth required for memory precision. Nature 473, 514–518. [DOI] [PubMed] [Google Scholar]
- Rybalko N., Suta D., Nwabueze‐Ogbo F. and Syka J. (2006) Effect of auditory cortex lesions on the discrimination of frequency‐modulated tones in rats. Eur. J. Neurosci. 23, 1614–1622. [DOI] [PubMed] [Google Scholar]
- Salton M., Elkon R., Borodina T., Davydov A., Yaspo M. L., Halperin E. and Shiloh Y. (2011) Matrin 3 binds and stabilizes mRNA. PLoS ONE 6, e23882. [DOI] [PMC free article] [PubMed] [Google Scholar]
- Sanderson J. L. and Dell'Acqua M. L. (2011) AKAP signaling complexes in regulation of excitatory synaptic plasticity. Neuroscientist 17, 321–336. [DOI] [PMC free article] [PubMed] [Google Scholar]
- Scheich H., Brechmann A., Brosch M., Budinger E., Ohl F. W., Selezneva E., Stark H., Tischmeyer W. and Wetzel W. (2011) Behavioral semantics of learning and crossmodal processing in auditory cortex: the semantic processor concept. Hear. Res. 271, 3–15. [DOI] [PubMed] [Google Scholar]
- Schicknick H. and Tischmeyer W. (2006) Consolidation of auditory cortex‐dependent memory requires N‐methyl‐D‐aspartate receptor activation. Neuropharmacology 50, 671–676. [DOI] [PubMed] [Google Scholar]
- Schicknick H., Schott B. H., Budinger E., Smalla K. H., Riedel A., Seidenbecher C. I., Scheich H., Gundelfinger E. D. and Tischmeyer W. (2008) Dopaminergic modulation of auditory cortex‐dependent memory consolidation through mTOR. Cereb. Cortex 18, 2646–2658. [DOI] [PMC free article] [PubMed] [Google Scholar]
- Schicknick H., Reichenbach N., Smalla K. H., Scheich H., Gundelfinger E. D. and Tischmeyer W. (2012) Dopamine modulates memory consolidation of discrimination learning in the auditory cortex. Eur. J. Neurosci. 35, 763–774. [DOI] [PubMed] [Google Scholar]
- Schultz W. (2010) Subjective neuronal coding of reward: temporal value discounting and risk. Eur. J. Neurosci. 31, 2124–2135. [DOI] [PubMed] [Google Scholar]
- Schulz A. L., Woldeit M. L., Goncalves A. I., Saldeitis K. and Ohl F. W. (2016) Selective Increase of Auditory Cortico‐Striatal Coherence during Auditory‐Cued Go/NoGo Discrimination Learning. Front. Behav. Neurosci. 9, 368. [DOI] [PMC free article] [PubMed] [Google Scholar]
- Sheng M. and Hoogenraad C. C. (2007) The postsynaptic architecture of excitatory synapses: a more quantitative view. Annu. Rev. Biochem. 76, 823–847. [DOI] [PubMed] [Google Scholar]
- Sheng M. and Kim E. (2011) The postsynaptic organization of synapses. Cold Spring Harb. Perspect. Biol. 3, a005678. [DOI] [PMC free article] [PubMed] [Google Scholar]
- Shevchenko A., Wilm M., Vorm O. and Mann M. (1996) Mass spectrometric sequencing of proteins silver‐stained polyacrylamide gels. Anal. Chem. 68, 850–858. [DOI] [PubMed] [Google Scholar]
- Shih P. Y., Lee S. P., Chen Y. K. and Hsueh Y. P. (2014) Cortactin‐binding protein 2 increases microtubule stability and regulates dendritic arborization. J. Cell Sci. 127, 3521–3534. [DOI] [PubMed] [Google Scholar]
- Shinoda T., Ito H., Sudo K., Iwamoto I., Morishita R. and Nagata K. (2010) Septin 14 is involved in cortical neuronal migration via interaction with Septin 4. Mol. Biol. Cell 21, 1324–1334. [DOI] [PMC free article] [PubMed] [Google Scholar]
- Smalla K. H., Matthies H., Langnase K., Shabir S., Bockers T. M., Wyneken U., Staak S., Krug M., Beesley P. W. and Gundelfinger E. D. (2000) The synaptic glycoprotein neuroplastin is involved in long‐term potentiation at hippocampal CA1 synapses. Proc. Natl Acad. Sci. USA 97, 4327–4332. [DOI] [PMC free article] [PubMed] [Google Scholar]
- Smalla K. H., Klemmer P. and Wyneken U. (2012) Isolation of the Postsynaptic Density: a Specialization of the Subsynaptic Cytoskeleton, in The Cytoskeleton ‐ Imaging, Isolation, and Interaction (Dermietzel R., ed.), pp. 265–282. Humana Press, New York. [Google Scholar]
- Soderling S. H., Langeberg L. K., Soderling J. A., Davee S. M., Simerly R., Raber J. and Scott J. D. (2003) Loss of WAVE‐1 causes sensorimotor retardation and reduced learning and memory in mice. Proc. Natl Acad. Sci. USA 100, 1723–1728. [DOI] [PMC free article] [PubMed] [Google Scholar]
- Soderling S. H., Guire E. S., Kaech S., White J., Zhang F., Schutz K., Langeberg L. K., Banker G., Raber J. and Scott J. D. (2007) A WAVE‐1 and WRP signaling complex regulates spine density, synaptic plasticity, and memory. J. Neurosci. 27, 355–365. [DOI] [PMC free article] [PubMed] [Google Scholar]
- Squire L. R. and Alvarez P. (1995) Retrograde amnesia and memory consolidation: a neurobiological perspective. Curr. Opin. Neurobiol. 5, 169–177. [DOI] [PubMed] [Google Scholar]
- Stark H. and Scheich H. (1997) Dopaminergic and serotonergic neurotransmission systems are differentially involved in auditory cortex learning: a long‐term microdialysis study of metabolites. J. Neurochem. 68, 691–697. [DOI] [PubMed] [Google Scholar]
- Stark H., Rothe T., Wagner T. and Scheich H. (2004) Learning a new behavioral strategy in the shuttle‐box increases prefrontal dopamine. Neuroscience 126, 21–29. [DOI] [PubMed] [Google Scholar]
- Tabas‐Madrid D., Nogales‐Cadenas R. and Pascual‐Montano A. (2012) GeneCodis3: a non‐redundant and modular enrichment analysis tool for functional genomics. Nucleic Acids Res. 40, W478–W483. [DOI] [PMC free article] [PubMed] [Google Scholar]
- Taus T., Kocher T., Pichler P., Paschke C., Schmidt A., Henrich C. and Mechtler K. (2011) Universal and confident phosphorylation site localization using phosphoRS. J. Proteome Res. 10, 5354–5362. [DOI] [PubMed] [Google Scholar]
- Thingholm T. E., Larsen M. R., Ingrell C. R., Kassem M. and Jensen O. N. (2008) TiO(2)‐based phosphoproteomic analysis of the plasma membrane and the effects of phosphatase inhibitor treatment. J. Proteome Res. 7, 3304–3313. [DOI] [PubMed] [Google Scholar]
- Tischmeyer W., Schicknick H., Kraus M., Seidenbecher C. I., Staak S., Scheich H. and Gundelfinger E. D. (2003) Rapamycin‐sensitive signalling in long‐term consolidation of auditory cortex‐dependent memory. Eur. J. Neurosci. 18, 942–950. [DOI] [PubMed] [Google Scholar]
- Trinidad J. C., Thalhammer A., Burlingame A. L. and Schoepfer R. (2013) Activity‐dependent protein dynamics define interconnected cores of co‐regulated postsynaptic proteins. Mol. Cell Proteomics 12, 29–41. [DOI] [PMC free article] [PubMed] [Google Scholar]
- Tritsch N. X. and Sabatini B. L. (2012) Dopaminergic modulation of synaptic transmission in cortex and striatum. Neuron 76, 33–50. [DOI] [PMC free article] [PubMed] [Google Scholar]
- Tweedie‐Cullen R. Y., Reck J. M. and Mansuy I. M. (2009) Comprehensive mapping of post‐translational modifications on synaptic, nuclear, and histone proteins in the adult mouse brain. J. Proteome Res. 8, 4966–4982. [DOI] [PubMed] [Google Scholar]
- Vizcaino J. A., Deutsch E. W., Wang R. et al (2014) ProteomeXchange provides globally coordinated proteomics data submission and dissemination. Nat. Biotechnol. 32, 223–226. [DOI] [PMC free article] [PubMed] [Google Scholar]
- Wan Y., Ade K. K., Caffall Z., Ilcim Ozlu. M., Eroglu C., Feng G. and Calakos N. (2014) Circuit‐selective striatal synaptic dysfunction in the Sapap3 knockout mouse model of obsessive‐compulsive disorder. Biol. Psychiatry 75, 623–630. [DOI] [PMC free article] [PubMed] [Google Scholar]
- Welch J. M., Lu J., Rodriguiz R. M. et al (2007) Cortico‐striatal synaptic defects and OCD‐like behaviours in Sapap3‐mutant mice. Nature 448, 894–900. [DOI] [PMC free article] [PubMed] [Google Scholar]
- Wilhelm B. G., Mandad S., Truckenbrodt S. et al (2014) Composition of isolated synaptic boutons reveals the amounts of vesicle trafficking proteins. Science 344, 1023–1028. [DOI] [PubMed] [Google Scholar]
- Wiltgen B. J., Brown R. A., Talton L. E. and Silva A. J. (2004) New circuits for old memories: the role of the neocortex in consolidation. Neuron 44, 101–108. [DOI] [PubMed] [Google Scholar]
- Xie Y., Vessey J. P., Konecna A., Dahm R., Macchi P. and Kiebler M. A. (2007) The GTP‐binding protein Septin 7 is critical for dendrite branching and dendritic‐spine morphology. Curr. Biol. 17, 1746–1751. [DOI] [PubMed] [Google Scholar]
- Xiong Q., Znamenskiy P. and Zador A. M. (2015) Selective corticostriatal plasticity during acquisition of an auditory discrimination task. Nature 521, 348–351. [DOI] [PMC free article] [PubMed] [Google Scholar]
- Zheng J. F., Patil S. S., Chen W. Q., An W., He J. Q., Hoger H. and Lubec G. (2009) Hippocampal protein levels related to spatial memory are different in the Barnes maze and in the multiple T‐maze. J. Proteome Res. 8, 4479–4486. [DOI] [PubMed] [Google Scholar]
Associated Data
This section collects any data citations, data availability statements, or supplementary materials included in this article.
Supplementary Materials
Table S1. (a) MIAPE‐compliant MS‐description for label‐free MS proteomics. (b) MIAPE‐compliant MSI‐description for label‐free MS proteomics. (c) MIAPE‐compliant MS‐description for MRM. (d) MIAPE‐compliant MSI‐description for MRM.
Table S2. Antibodies used for western blot verification.
Table S3. Proteins showing abundance changes in the SJ‐enriched samples from different brain regions of mice 24 h after FMTD training.
Table S4. Phosphopeptides and deduced proteins showing abundance changes in the SJ‐enriched samples from different brain regions of mice 24 h after FMTD training.
Table S5. Verification of the regulation of selected proteins.
Table S6. Data for single enrichment analysis with GeneCodis.
Figure S1. Performance in the FMTD paradigm.
Figure S2. Differential regulation of synaptic protein abundance in analyzed brain regions.
Figure S3. Verification of the regulation of selected proteins by western blot analysis.
Figure S4. Regional differences in the modulation of synaptic protein networks.