

Summary
Background/Purpose
Irisin is a skeletal muscle myokine that causes the brown coloration of white fat, promotes fat burning, inhibits weight gain and may be useful for treatment of obesity. Irisin is also related to glucose/lipid metabolism and may prevent onset of diabetes, but a consensus on irisin secretion has not been reached. The purpose of this study was to determine the relationships between serum irisin levels and physical factors in untreated Japanese men and women with obesity.
Methods
The subjects were 66 untreated patients with obesity (body mass index ≥30 kg m−2) who visited our obesity clinic. The subjects included 19 men and 47 women with a mean age of 45.7 ± 13.4 years, mean body weight of 93.8 ± 17.6 kg, and mean body mass index of 36.5 ± 4.7 kg m−2. At the initial visit, blood sampling was performed, body composition was evaluated using dual energy X‐ray absorptiometry, and exercise tolerance was determined in a cardiopulmonary exercise test. Homeostasis model of assessment – insulin resistance (HOMA‐IR), an index of insulin resistance, and the serum level of irisin were measured.
Results
In men, serum irisin was positively correlated with fasting blood glucose (r = 0.491, P < 0.05), immunoreactive insulin (r = 0.536, P < 0.05), HOMA‐IR (r = 0.635, P < 0.01), body weight (r = 0.491, P < 0.05), lean body mass of the trunk (r = 0.579, P < 0.05) and whole lean body mass (r = 0.489, P < 0.05). In women, serum irisin was positively correlated with immunoreactive insulin (r = 0.502, P < 0.01) and HOMA‐IR (r = 0.385, P < 0.01). In both sexes, HOMA‐IR was an independent variable associated with obesity (men: β = 0.635, R2 = 0.369, P < 0.01; women: β = 0.385, R2 = 0.129, P < 0.01).
Conclusion
The serum level of irisin was positively correlated with HOMA‐IR in Japanese patients with obesity of both sexes. This suggests that compensatory enhancement of irisin secretion may occur in response to insulin resistance.
Keywords: body composition, insulin resistance, irisin, lean muscle mass, obesity
Highlights
In men with obesity, the serum irisin level was positively correlated with the fasting blood glucose level, immunoreactive insulin and homeostasis model of assessment – insulin resistance (HOMA‐IR).
In women with obesity, the serum irisin level was positively correlated with immunoreactive insulin and HOMA‐IR.
In stepwise multiple linear regression analysis, HOMA‐IR was an independent variable associated with obesity.
Compensatory enhancement of irisin secretion may occur in response to insulin resistance.
Introduction
Recent studies have shown that skeletal muscle is not simply a motile organ, but produces physiological active substances that are referred to as myokines 1, 2, 3, 4, 5, 6, 7, 8, 9, 10, 11, 12, 13, 14, 15, 16, 17, 18, 19, 20, 21, 22, 23, 24, 25, 26. Myokines act on skeletal muscle and perimuscular tissue through auto‐ or parasecretory mechanisms, and also act endocrinologically on remote organs such as adipose tissue. Thus, skeletal muscle is involved in both muscle/bone metabolism and glucose/lipid metabolism.
Irisin is a myokine that causes brown coloration of white fat, promotes fat burning and inhibits weight gain. Irisin is associated with glucose/lipid metabolism 2, 4, 6, 7, 10, 13, 14, 17, 18 and may prevent obesity and onset of diabetes 3. A decrease in skeletal muscle volume is a factor in insulin resistance 27, 28, and irisin is related more strongly to insulin resistance than other myokines. Irisin is also related to metabolic parameters and may be useful for obesity treatment 2, 3, based on a proposed hypothesis for the anti‐obesity effect of irisin 4. However, a consensus regarding irisin secretion has not been reached 5.
The serum irisin level decreases with age 4, 5, 9, and many studies have examined the relationship between body mass index (BMI) and irisin. However, these findings have included a negative correlation 6, 10, 11, 12, a positive correlation 7, 13, 14, 15 and no correlation 2, 4, 16. Thus, a consensus has not been reached. Huh et al. reported a decrease in irisin in patients with obesity with marked weight loss after gastrectomy 4, and Crujeiras and Huerta et al. also showed that the compensatory increase in irisin in patients with obesity was reversed with weight loss 15, 24. These reports suggest an anti‐obesity effect of irisin and the irisin level in patients with obesity increases to maintain metabolic homeostasis 4, 15, 24.
Kurdiova et al. found lower serum irisin in men with obesity than in non‐obese men, and increased expression of fibronectin type III domain‐containing protein 5 (FNDC5) mRNA (the precursor of irisin) in skeletal muscle and fat in obese men, which suggests that irisin secretion in this tissue is promoted in response to obesity 2. Rivada et al. found expression of FNDC5 mRNA in white fat and involvement of adiponectin in fat in irisin regulation in obesity 8. Liu et al. also showed that the irisin level was high in patients with non‐diabetic obesity and lower in those with type 2 diabetes mellitus, which suggests that regulation of irisin secretion may differ between patients with and without diabetes. In addition, a mechanism in which compensatory irisin secretion is promoted in response to a reduction in glucose/lipid metabolism in patients with non‐diabetic obesity has been reported 2, 6, 7. These studies indicate the complexity of the irisin secretory response, and especially, the feedback mechanisms in tissue other than skeletal muscle. Furthermore, no study has examined the relationship between irisin and metabolic parameters in Japanese patients with obesity.
In seeking a treatment for obesity, improving the HOMA‐IR score for assessment of insulin resistance may be helpful as the first priority for patients with obesity who do not have severe disease. Therefore, we have focused on irisin metabolism and the relationship between irisin and HOMA‐IR. In this study, we investigated the relationships between serum irisin levels and physical factors in untreated men and women with obesity to examine the mechanisms regulating irisin secretion, based on the hypothesis that HOMA‐IR is an important factor in irisin secretion in patients with obesity without diabetes.
Methods
Subjects and protocol
The subjects were 66 untreated patients with obesity (BMI ≥30 kg m−2) who visited the obesity clinic in our university hospital between 2013 and 2014. The subjects included 19 men and 47 women, and had a mean age of 45.7 ± 13.4 years, a mean body weight of 93.8 ± 17.6 kg and a mean BMI of 36.5 ± 4.7 kg m−2. We excluded patients taking anti‐diabetic drugs, insulin, or drugs for obesity (Table 1). This study was conducted according to the Ethics Regulations of Kansai Medical University. After explaining the purpose, contents and precautions of the study to all subjects, written informed consent regarding study participation was obtained (Approval no. H130181, date of approval: March 26, 2014).
Table 1.
Demographics and lifestyle factors of male and female subjects
| Variable | Male | Female | P value a |
|---|---|---|---|
| N (%) | 19 (28.8) | 47 (71.2) | |
| Smoking status (n, %) current/past/never | 2 (10.5)/5 (26.3)/21 (63.2) | 4 (8.5)/4 (8.5)/39 (83.0) | 0.214 |
| Alcohol (n, %) every day/often/none | 4 (21.1)/3 (15.8)/12 (63.2) | 4 (8.5)/14 (29.8)/29 (61.7) | 0.244 |
| Medication (n, %) Hypertensive drug/anti‐diabetic drug/insulin | 5 (26.3)/0/0 | 4 (8.5)/0/0 | 0.023 |
P values by t‐test
At the initial consultation, height, body weight, body composition, visceral/subcutaneous fat area on CT, exercise tolerance, muscle strength of the lower limbs and haematological parameters were measured. Associations between these measurements and serum irisin levels were investigated in each sex.
Body composition and skeletal muscle index
Body composition (fat mass and lean body mass) was measured using dual energy X‐ray absorptiometry (DXA) (DPX‐NT, GE Healthcare Corp., Buckinghamshire, UK). For skeletal muscle parameters, the body weight‐corrected value (%) of the total lean body mass (kg) on X‐ray absorptiometry and the height‐corrected value (skeletal muscle index [SMI], kg m−2) of the lean body mass of the limbs (kg) were used.
Measurement of lower limb muscle strength
Lower limb muscle strength was measured twice based on the uniform rotation leg strength using a recumbent ergometer (Strength Ergo, Mitsubishi Electric Corp., Tokyo, Japan). The maximum value was recorded and values were corrected using the body weight (Nm/kg).
Cardiopulmonary exercise test
A symptomatic limited cardiopulmonary exercise test was conducted using a bicycle ergometer (232C‐XL, Combi Corp., Tokyo, Japan). Expired gas analysis was performed using the breath‐by‐breath method (AE‐300, Minato Medical Science Co., Ltd., Osaka, Japan). The anaerobic threshold was determined using the V‐slope method 29. Peak oxygen uptake (peak VO2) was measured as the highest level under load.
Serum irisin
Blood was collected after fasting for measurements of peripheral and biochemical data and myokines. Blood samples were centrifuged at 4 °C and 3,000 rpm for 10 min and placed in a container for serum storage at −80 °C until an enzyme‐linked immunosorbent assay for serum irisin (Irisin Kit, EX‐067‐29, Phoenix Pharmaceuticals, Burlingame, CA, USA) was performed with use of a Powerscan HT plate reader (DS Pharma Biomedical Co., Ltd., Osaka, Japan).
Haematological parameters
We used an automatic analyzer (ADAMS Glucose GA‐1170, ARKRAY, Inc., Kyoto, Japan) for glucose analysis, and HLC‐723®G7, an automatic glycohemoglobin analyzer (Tosoh Bioscience Corp., Tokyo, Japan) for measurement of HbA1c. HOMA‐IR, an index of insulin resistance, was calculated based on the blood insulin level after fasting early in the morning (immunoreactive insulin [IRI]) and the fasting blood sugar (FBS) level, using the formula: HOMA‐IR = (IRI × FBS)/405.
Statistical analysis
Values are expressed as mean ± standard deviation. Results were compared between two groups by chi‐square test and independent t‐test. Associations among parameters were evaluated using Pearson or Spearman correlation coefficients. For multivariate analysis, factors with a high variance inflation factor were excluded from parameters with significant differences in simple correlation, and stepwise multiple linear regression analysis was performed using fat and skeletal muscle parameters as independent variables and age as an adjustment factor. All analyses were performed using spss version 21(IBM Corp., New York, USA) for Windows. A P value of 0.05 was regarded as significant.
Results
Patient characteristics
The patient background is shown in Table 1. The 66 subjects with obesity including 19 men (age: 47.9 ± 14.0 years, BMI: 37.6 ± 4.6 kg m−2) and 47 women (age: 44.8 ± 13.2 years, BMI: 36.0 ± 4.8 kg m−2). No subjects were taking medications for diabetes mellitus. Smoking and alcohol consumption did not differ significantly between the sexes. The proportion of patients taking hypotensive drugs was significantly higher in men, but there were no other sex differences.
Clinical findings are shown in Table 2. The mean body weight, % lean body mass, and SMI were 109.0 ± 17.7 kg, 57.2 ± 4.1% and 9.2 ± 1.1 kg m−2, respectively, in men; and 87.7 ± 13.4 kg, 49.1 ± 4.8% and 7.2 ± 0.8 kg/m2 respectively, in women. The first two of these parameters were significantly higher in men (P < 0.01). Peak VO2 values were 20.3 ± 4.6 and 17.4 ± 3.2 mL min−1 kg−1 in men and women, respectively. The visceral fat area was significantly higher in men (217.8 ± 55.0 vs. 174.7 ± 67.7 cm2, P < 0.01). % body fat was 35.5 ± 5.9 in men and 49.3 ± 8.4% in women. Serum irisin levels were significantly lower in men (1.1 ± 0.1 vs. 1.2 ± 0.2 ng mL−1, P < 0.05).
Table 2.
Clinical parameters of male and female subjects
| Variables | All (n = 66) | Male (n = 19) | Female (n = 47) |
|---|---|---|---|
| Age (years) | 45.7 ± 13.4 | 47.9 ± 14.0 | 44.8 ± 13.2 |
| Height (cm) | 160.0 ± 8.7 | 169.8 ± 6.1 | 156.0 ± 6.0** |
| Body weight (kg) | 93.8 ± 17.6 | 109.0 ± 17.7 | 87.7 ± 13.4** |
| Body mass index (kg m−2) | 36.5 ± 4.7 | 37.6 ± 4.6 | 36.0 ± 4.8 |
| % Body fat (%) | 45.3 ± 10.0 | 35.5 ± 5.9 | 49.3 ± 8.4** |
| % Lean body mass (%) | 51.4 ± 5.9 | 57.2 ± 4.1 | 49.1 ± 4.8** |
| Skeletal muscle index (kg m−2) | 7.8 ± 1.3 | 9.2 ± 1.1 | 7.2 ± 0.8** |
| Lower limb muscle strength (kg kg−1) | 1.4 ± 0.3 | 1.5 ± 0.3 | 1.3 ± 0.3 |
| ATVO2 (mL min−1 kg−1) | 11.0 ± 1.8 | 10.9 ± 1.2 | 11.0 ± 2.1 |
| Peak VO2 (mL min−1 kg−1) | 18.3 ± 3.9 | 20.3 ± 4.6 | 17.4 ± 3.2** |
| Visceral fat area (cm2) | 187.2 ± 66.8 | 217.8 ± 55. 0 | 174.7 ± 67.7* |
| Subcutaneous fat area (cm2) | 443.2 ± 125.4 | 433.2 ± 116.5 | 447.3 ± 129.8 |
| Fasting glucose (mg dL−1) | 103.4 ± 21.8 | 107.8 ± 22.1 | 101.6 ± 21.7 |
| Fasting insulin (μU mL−1) | 13.6 ± 7.8 | 14.2 ± 10.0 | 13.4 ± 6.9 |
| HOMA‐IR | 3.5 ± 2.1 | 3.9 ± 2.9 | 3.3 ± 1.7 |
| Irisin (ng mL−1) | 1.2 ± 0.2 | 1.1 ± 0.1 | 1.2 ± 0.2* |
P < 0.05
P < 0.01 by independent t‐test
Results are expressed as mean ± SD not significant. % body fat = total fat mass/weight; % lean body mass = total lean body mass/weight; skeletal muscle index = lean body mass of extremities/height2.
HOMA‐IR, homeostasis model of assessment – insulin resistance.
Relationships between serum irisin levels and clinical factors
In men, serum irisin was positively correlated with IRI (r = 0.536, P < 0.05), HOMA‐IR (r = 0.635, P < 0.01), body weight (r = 0.491, P < 0.05), lean body mass of the trunk (r = 0.579, P < 0.05), whole lean body mass (r = 0.489, P < 0.05), and fasting blood sugar level (r = 0.491, P < 0.05). In women, serum irisin was positively correlated with HOMA‐IR (r = 0.385, P < 0.01) and IRI (r = 0.502, P < 0.01). The relationship between serum irisin and HOMA‐IR in men and women with obesity is shown in Figure 1. In stepwise multiple linear regression analysis in men and women, HOMA‐IR was extracted as an independent variable (men: β = 0.635, R2 = 0.369, P < 0.01; women: β = 0.385, R2 = 0.129, P < 0.01) (Table 3).
Figure 1.
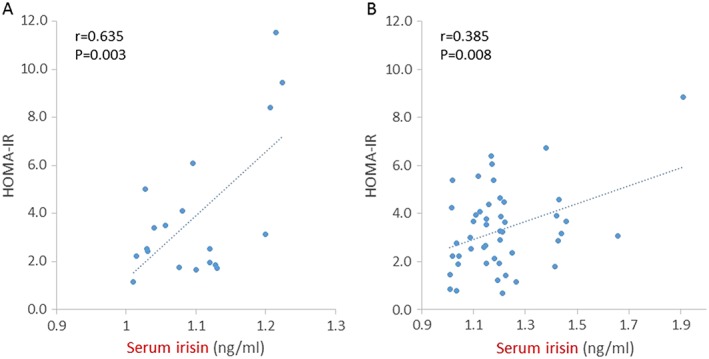
Serum irisin levels were positively correlated with HOMA‐IR in 19 men (A) and 47 women (B) with obesity. Pearson correlation coefficients (r) and P values are shown in each graph.
Table 3.
Stepwise multiple linear regression analysis of serum irisin levels in men and women with obesity
| Independent variable | Male (n = 19) | Female (n = 47) | ||
|---|---|---|---|---|
| β | P value | β | P value | |
| HOMA‐IR | 0.664 | 0.003 | 0.425 | 0.004 |
| Age | −0.034 | 0.869 | −0.128 | 0.396 |
| BMI | 0.169 | 0.434 | −0.012 | 0.933 |
| % body fat | 0.153 | 0.449 | 0.061 | 0.680 |
| % lean body mass | −0.107 | 0.585 | −0.274 | 0.053 |
| Peak VO2 | 0.019 | 0.924 | −0.117 | 0.427 |
BMI, body mass index; HOMA‐IR, homeostasis model of assessment – insulin resistance.
Discussion
In this study, serum irisin levels were positively correlated with HOMA‐IR in men and women with obesity, and HOMA‐IR was independently related to the irisin level. There was also a negative correlation between irisin and age and a positive correlation between irisin and % body fat in all subjects. A positive correlation between serum irisin and body weight was found in men, but not in women. Thus, this study in Japanese patients with obesity without diabetes suggests that irisin might be positively correlated with metabolic parameters (Figure 2).
Figure 2.
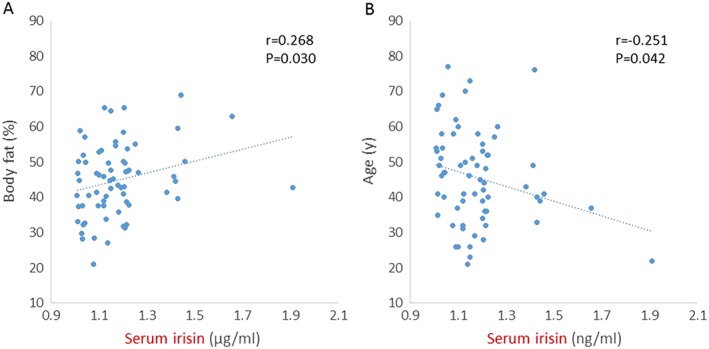
Serum irisin levels were positively associated with body fat (A) and negatively correlated with age (B) in all subjects with obesity (n = 66). Pearson correlation coefficients (r) and P values are shown in each graph.
Park et al. 13 and Ebert et al. 19 found a positive correlation between HOMA‐IR and irisin, consistent with other reports 7, 9, 13, 14. In contrast, Al‐Daghri et al. found that irisin was negatively correlated with HOMA‐IR in healthy women 20, and Moreno‐Navarrete et al. reported a negative correlation between irisin levels and insulin resistance in men with obesity 6. The reasons for this discrepancy are unclear. In a recent, large‐scale exploratory study in 1,115 subjects with obesity in China (349 men, 766 women), the proportion of patients with a low blood sugar level or metabolic syndrome was significantly lower among those with a high irisin level, suggesting that irisin plays an important role in insulin resistance or metabolic syndrome 18. Thus, it is likely that the irisin level is negatively correlated with HOMA‐IR in healthy adults, but positively correlated with HOMA‐IR in patients with obesity or diabetes. In the current study, serum irisin was significantly positively correlated with IRI and HOMA‐IR in untreated Japanese patients with obesity.
Insulin resistance might also be correlated with irisin secretion, because an increase in irisin promotes energy consumption, which contributes to weight loss, fat reduction and improved insulin resistance 3. Concerning the mechanism, activated PGC1α may increase expression of FNDC5 mRNA, as a precursor of irisin, promoting irisin secretion into blood. FNDC5 mRNA is detected in skeletal muscle and in fat, kidney, liver, heart, lung and blood vessels 2, 4, 6, 21. In a cross‐sectional study, Kurdiova et al. found that serum irisin was lower in men with obesity than in non‐obese men, whereas expression of FNDC5 mRNA was significantly higher in skeletal muscle and fat in men with obesity than in non‐obese men and pre‐diabetic/diabetes patients. Thus, irisin secretion may be compensatively enhanced through a fat‐derived feedback mechanism in patients with obesity. This mechanism might be involved in the positive correlation between irisin levels and % body fat in subjects with obesity. Further studies are needed to examine this possibility.
Irisin secreted into blood improves insulin resistance by increasing uncoupling protein 1 (UCP1) gene expression, resulting in brown coloration of white fat 22. PGC1α promotes irisin secretion, contributing to mitochondrial biosynthesis and an improvement in oxidative metabolism. Mitochondria play an important role in insulin resistance, and a reduction in PCG1α expression or function induces marked insulin resistance and diabetes 30, 31, 32. The subjects in this study were patients with obesity without diabetes. A feedback mechanism mediated by the PGC1alpha‐irisin‐UCP1 signaling pathway may have been present in response to an excess level of fat or insulin resistance. This requires further examination in patients with obesity and diabetes.
In this study, serum irisin in women with obesity was significantly higher than that in men with obesity, and there were also sex differences in body weight, % lean body mass, SMI, peak VO2 and visceral fat area (all higher in men) and in % body fat (higher in women). Increases in % lean body mass and exercise tolerance promote irisin secretion, but women had a higher level of irisin, suggesting the presence of a mechanism for irisin secretion control to compensate for an excess level of fat. Roca‐Rivada et al. and Yan et al. also found significantly higher irisin levels in women than in men 8, 18. Huh et al. 4 reported a negative correlation between irisin and adiponectin in women with obesity, a positive correlation between irisin and estradiol and no correlation between irisin and testosterone, with a proposal of involvement of irisin in insulin resistance and glucose/lipid metabolism responses 4. However, in a large‐scale cross‐sectional study, Kerstholt et al. found no sex difference in irisin 23. Closer investigation of these effects is required in further studies.
This study has some limitations. First, the number of subjects was small for a cross‐sectional study and inclusion of only 19 men limited the analysis with respect to sex. Second, irisin is associated with many hormones and cytokines, but only associations with exercise tolerance, body composition and insulin resistance were examined. Lastly, we did not compare the results with those in patients with diabetes or investigate expression of mRNA in muscle and fatty tissue.
Conclusion
In this study in Japanese patients with obesity without diabetes, the serum irisin level was positively correlated with HOMA‐IR in men and women. Our results suggest that compensatory enhancement of irisin secretion may occur in response to insulin resistance in patients with obesity.
Conflict of Interest Statement
No conflict of interest was declared.
Acknowledgements
We thank the staff of the Health Science Center of Kansai Medical University for their assistance. This study was supported by a Grant‐in‐Aid for Scientific Research from ROHTO Pharmaceutical Co., Ltd. An abstract of this study was presented at the EuroPRevent 2015 meeting (May 2015, Lisbon) and at the 36th annual meeting of the Japan Society for the Study of Obesity (October 2015, Nagoya).
Fukushima, Y. , Kurose, S. , Shinno, H. , Cao Thi Thu, H. , Tamanoi, A. , Tsutsumi, H. , Hasegawa, T. , Nakajima, T. , and Kimura, Y. (2016) Relationships between serum irisin levels and metabolic parameters in Japanese patients with obesity. Obesity Science & Practice, 2: 203–209. doi: 10.1002/osp4.43.
References
- 1. Pedersen BK. Muscle as a secretory organ. Compr Physiol 2013; 3: 1337–1362. [DOI] [PubMed] [Google Scholar]
- 2. Kurdiova T, Balaz M, Ukropcova B. Effects of obesity, diabetes and exercise on FNDC5 gene expression and irisin release in human skeletal muscle and adipose tissue: in vivo and in vitro studies. J Physiol 2014; 592: 1091–1107. [DOI] [PMC free article] [PubMed] [Google Scholar]
- 3. Bostrom P, Wu J, Jedrychowski MP, et al. A PGC1‐alpha‐dependent myokine that drives brown‐fat‐like development of white fat and thermogenesis. Nature 2012; 481: 463–468. [DOI] [PMC free article] [PubMed] [Google Scholar]
- 4. Huh JY, Panagiotou G, Mougios V, et al. FNDC5 and irisin in humans: I. Predictors of circulating concentrations in serum and plasma and II. mRNA expression and circulating concentrations in response to weight loss and exercise. Metabolism 2014: 1725–1738. [DOI] [PMC free article] [PubMed] [Google Scholar]
- 5. Elsen M, Raschke S, Eckel J. Browning of white fat: does Irisin play a role in humans? J Endocrinol 2014; 222: 25–38. [DOI] [PubMed] [Google Scholar]
- 6. Moreno‐Navarrete JM, Ortega F, Serrano M, et al. Irisin is expressed and produced by human muscle and adipose tissue in association with obesity and insulin resistance. J Clin Endocrinol Metab 2013; 98: E769–778. [DOI] [PubMed] [Google Scholar]
- 7. Liu JJ, Wong MD, Toy WC, et al. Lower circulating irisin is associated with type 2 diabetes mellitus. J Diabetes Complications 2013; 27: 365–369. [DOI] [PubMed] [Google Scholar]
- 8. Roca‐Rivada A, Castelao C, Senin LL, et al. FNDC5/irisin is not only a myokine but also an adipokine. PLoS One 2013; 8 e60563. [DOI] [PMC free article] [PubMed] [Google Scholar]
- 9. Chen JQ, Huang YY, Gusdon AM, Qu S. Irisin: a new molecular marker and target in metabolic disorder. Lipids Health Dis 2015; 14: 2. [DOI] [PMC free article] [PubMed] [Google Scholar]
- 10. Choi YK, Kim MK, Bae KH, et al. Serum irisin levels in new‐onset type 2 diabetes. Diabetes Res Clin Pract 2013; 100: 96–101. [DOI] [PubMed] [Google Scholar]
- 11. Polyzos SA, Kountouras J, Anastasilakis AD, et al. Irisin in patients with nonalcoholic fatty liver disease. Metabolism 2014; 63: 207–217. [DOI] [PubMed] [Google Scholar]
- 12. Aydin S, Aydin S, Kuloglu T, et al. Alterations of irisin concentrations in saliva and serum of obese and normal‐weight subjects, before and after 45 min of a Turkish bath or running. Peptides 2013: 13–18. [DOI] [PubMed] [Google Scholar]
- 13. Park KH, Zaichenko L, Brinkoetter M, et al. Circulating irisin in relation to insulin resistance and the metabolic syndrome. J Clin Endocrinol Metab 2013; 98: 4899–4907. [DOI] [PMC free article] [PubMed] [Google Scholar]
- 14. Stengel A, Hofmann T, Goebel‐Stengel M, et al. Circulating levels of irisin in patients with anorexia nervosa and different stages of obesity–correlation with body mass index. Peptides 2013; 39: 125–130. [DOI] [PubMed] [Google Scholar]
- 15. Crujeiras AB, Zulet MA, Lopez‐Legarrea P, et al. Association between circulating irisin levels and the promotion of insulin resistance during the weight maintenance period after a dietary weight‐lowering program in obese patients. Metabolism 2014; 6: 520–531. [DOI] [PubMed] [Google Scholar]
- 16. Gouni‐Berthold I, Berthold HK, Huh JY, et al. Effects of lipid‐lowering drugs on irisin in human subjects in vivo and in human skeletal muscle cells ex vivo. PLoS One 2013; 8 e72858. [DOI] [PMC free article] [PubMed] [Google Scholar]
- 17. Sesti G, Andreozzi F, Fiorentino TV, et al. High circulating irisin levels are associated with insulin resistance and vascular atherosclerosis in a cohort of nondiabetic adult subjects. Acta Diabetol 2014; 51: 705–13. [DOI] [PubMed] [Google Scholar]
- 18. Yan B, Shi X, Zhang H, et al. Association of serum irisin with metabolic syndrome in obese Chinese adults. PLoS One 2014; 9 e94235. [DOI] [PMC free article] [PubMed] [Google Scholar]
- 19. Ebert T, Focke D, Petroff D, et al. Serum levels of the myokine irisin in relation to metabolic and renal function. Eur J Endocrinol 2014; 170: 501–506. [DOI] [PubMed] [Google Scholar]
- 20. Al‐Daghri NM, Alkharfy KM, Rahman S, et al. Irisin as a predictor of glucose metabolism in children: sexually dimorphic effects. Eur J Clin Invest 2014; 44: 119–124. [DOI] [PubMed] [Google Scholar]
- 21. Aydin S, Kuloglu T, Aydind S, et al. Cardiac, skeletal muscle and serum irisin responses to with or without water exercise in young and old male rats: cardiac muscle produces more irisin than skeletal muscle. Peptides 2014; 52: 68–73. [DOI] [PubMed] [Google Scholar]
- 22. Sanchis‐Gomar F, Perez‐Quilis C, Sanchis‐Gomar F, et al. The p38‐PGC‐1α‐irisin‐betatrophin axis: exploring new pathways in insulin resistance. Adipocyte 2014; 3: 67–68. [DOI] [PMC free article] [PubMed] [Google Scholar]
- 23. Kerstholt N, Ewert R, Nauck M, et al. Association of circulating irisin and cardiopulmonary exercise capacity in healthy volunteers: results of the Study of Health in Pomerania. BMC Pulm Med 2015; 15: 41. [DOI] [PMC free article] [PubMed] [Google Scholar]
- 24. Huerta AE, Prieto‐Hontoria PL, Fernández‐Galilea M, et al. Circulating irisin and glucose metabolism in overweight/obese women: effects of α‐lipoic acid and eicosapentaenoic acid. J Physiol Biochem 2015; 71: 547–58. DOI: 10.1007/s13105-015-0400-5. [DOI] [PubMed] [Google Scholar]
- 25. Pardo M, Crujeiras AB, Amil M, et al. Association of irisin with fat mass, resting energy expenditure, and daily activity in conditions of extreme body mass index. Int J Endocrinol 2014: 1–9. [DOI] [PMC free article] [PubMed] [Google Scholar]
- 26. Albrecht E, Norheim F, Thiede B, et al. Irisin – a myth rather than an exercise‐inducible myokine. Sci Rep 2015; 5: 8889 DOI: 10.1038/srep08889. [DOI] [PMC free article] [PubMed] [Google Scholar]
- 27. Moon SS. Low skeletal muscle mass is associated with insulin resistance, diabetes,and metabolic syndrome in the Korean population. The Korea National Health and Nutrition Examination Survey (KNHANES) 2009–2010. Endocr J 2014; 61: 61–70. [DOI] [PubMed] [Google Scholar]
- 28. Lee CG, Boyko EJ, Strotmeyer ES. Association between insulin resistance and lean mass loss and fat mass gain in older men without diabetes mellitus. J Am Geriatr Soc 2011; 59: 1217–1224. [DOI] [PMC free article] [PubMed] [Google Scholar]
- 29. Beaver WL, Waserlllan K, Whpp BJ. A new method for detecting anaerobic threshold by gas exchange. J Appl Physiol 1986; 60: 2020–2027. [DOI] [PubMed] [Google Scholar]
- 30. Guilherme A, Virbasius JV, Puri V, Czech MP. Adipocyte dysfunctions linking obesity to insulin resistance and type 2 diabetes. Nat Rev Mol Cell Biol 2008; 9: 367–377. [DOI] [PMC free article] [PubMed] [Google Scholar]
- 31. Handschin C, Spiegelman BM. The role of exercise and PGC1alpha in inflammation and chronic disease. Nature 2008; 454: 463–469. [DOI] [PMC free article] [PubMed] [Google Scholar]
- 32. Yan J, Feng Z, Liu J, et al. Enhanced autophagy plays a cardinal role in mitochondrial dysfunction in type 2 diabetic Goto‐Kakizaki (GK) rats: ameliorating effects of (‐)‐epigallocatechin‐3‐gallate. J Nutr Biochem 2012; 23: 716–724. [DOI] [PubMed] [Google Scholar]