

Summary
Background
Matrix metalloproteinase‐9 is a proteolytic enzyme whose expression is increased in ulcerative colitis.
Aim
To evaluate the safety and efficacy of GS‐5745, a fully humanised anti‐matrix metalloproteinase‐9 monoclonal antibody, in moderately‐to‐severely active ulcerative colitis.
Methods
We randomised 74 patients with ulcerative colitis to treatment with single or multiple ascending intravenous or subcutaneous doses of GS‐5745 or placebo. Multiple‐dose cohorts received either IV infusions (0.3, 1.0, 2.5 or 5.0 mg/kg GS‐5745 or placebo) every 2 weeks (three total IV infusions) or five weekly SC injections (150 mg GS‐5745 or placebo). The primary outcomes were the safety, tolerability and pharmacokinetics of escalating single and multiple doses of GS‐5745. Exploratory analyses in the multiple‐dose cohorts included clinical response (≥3 points or 30% decrease from baseline in Mayo Clinic score and ≥1 point decrease in the rectal bleeding subscore or a rectal bleeding subscore ≤1) and clinical remission (a complete Mayo Clinic score ≤2 with no subscore >1) at Day 36. Biological effects associated with a clinical response to GS‐5745 were explored using histological and molecular approaches.
Results
Twenty‐three of the 42 patients (55%) receiving multiple doses of GS‐5745 had adverse events, compared with 5/8 patients (63%) receiving placebo. GS‐5745 showed target‐mediated drug disposition, approximately dose‐proportional increases in maximum plasma concentration and more than dose‐proportional increases in the area under the plasma drug concentration‐time curve. Clinical response occurred in 18/42 patients (43%) receiving GS‐5745 compared with 1/8 patients (13%) receiving placebo. Clinical remission occurred in 6/42 patients (14%) receiving GS‐5745 and 0/8 (0%) receiving placebo. Patients with a clinical response to GS‐5745 had reductions in matrix metalloproteinase‐9 tissue levels (mean 48.9% decrease from baseline compared with a mean 18.5% increase in nonresponders, P = 0.008) significant improvements in histopathology scores (confirmed with three separate histological disease activity indices), as well as changes in colonic gene expression that were consistent with reduced inflammation.
Conclusion
This phase 1 trial provides preliminary evidence for the safety and therapeutic potential of GS‐5745 in the treatment of ulcerative colitis.
Introduction
Ulcerative colitis (UC) is a chronic inflammatory disorder of the colonic mucosa limited to the rectum and colon, and characterised histologically by the presence of both acute and chronic inflammation. The hallmark symptom of UC is bloody diarrhoea that is frequently accompanied by rectal urgency and tenesmus. A dysregulated mucosal immune response to commensal gut flora in genetically susceptible individuals seems likely to be involved in the aetiology of UC, although the precise pathogenesis is unknown.1, 2
Treatment for UC is tailored to the severity, location and extent of the disease, and includes aminosalicylates for mild disease, corticosteroids for patients who are failing or do not respond to first‐line therapies, immunomodulators for corticosteroid‐weaning and maintenance of remission, and biologic agents (tumour necrosis factor – and α4β7‐integrin antagonists), which are typically reserved for patients with severe or corticosteroid‐refractory disease.2, 3, 4 While both tumour necrosis factor antagonists and vedolizumab target biologically and pathologically relevant molecules (cytokines) and processes (gut‐specific leucocyte trafficking) in UC, new therapies directed towards alternative disease mechanisms are needed to address the unmet medical need of patients who do not respond to, or lose response to, currently available biologics.5, 6, 7
Matrix metalloproteinases are a family of structurally related zinc‐dependent proteases, whose members are grouped according to substrate preference (i.e., collagenases, gelatinases, stromelysins and membrane‐type). Initially believed to facilitate cell migration, infiltration and tissue remodelling through their ability to degrade extracellular matrix and basement membrane, matrix metalloproteinases are now understood to play a much broader role in cellular homoeostasis as enzymatic modulators of cytokines, chemokines, receptors, proteases and adhesion molecules.8, 9, 10, 11 Matrix metalloproteinase activity is tightly regulated on multiple levels, from transcription to activation of enzymatic activity. However, increased concentrations of active matrix metalloproteinases lead to extracellular matrix breakdown and tissue destruction, and their dysregulated expression has been implicated in a number of pathological processes.9, 12
The involvement of matrix metalloproteinases in intestinal inflammation and inflammatory bowel disease is well‐documented.9, 13, 14, 15 Basic and clinical research in the past decade has produced abundant evidence in support of one matrix metalloproteinase in particular; gelatinase‐2, or matrix metalloproteinase‐9, in the pathophysiology of inflammatory bowel disease and more recently as a potential biomarker for UC.14, 15, 16, 17, 18, 19 Matrix metalloproteinase‐9 activity in UC appears both to initiate and perpetuate an inflammatory state, and has been proposed to contribute to tissue damage and disease pathology through destruction of basement membrane, alteration in barrier permeability, defective re‐epithelialisation, activation of pro‐inflammatory cytokines and angiogenesis.9, 12, 15, 20, 21
Matrix metalloproteinase‐9 mucosal expression, protein and serum antigen levels, and activity have all been shown to be significantly higher in UC patients than in healthy controls and to correspond to disease activity.22, 23, 24, 25, 26 Faecal matrix metalloproteinase‐9 levels, which are significantly increased in patients with UC compared with healthy controls and those with irritable bowel syndrome, are correlated with clinical and endoscopic activity scores, serum C‐reactive protein (CRP) and faecal calprotectin, and are highly sensitive for the detection of endoscopically active UC.16, 19
GS‐5745 (Gilead Sciences, Inc, Foster City, CA, USA) is a fully humanised high‐affinity IgG4 monoclonal antibody that selectively binds and inhibits matrix metalloproteinase‐9.21 We performed a randomised placebo‐controlled phase 1b single and multiple ascending dose‐ranging study to determine if inhibition of matrix metalloproteinase‐9 is safe and effective in patients with active UC. The primary outcomes of the study were the safety and pharmacokinetics of GS‐5745. This paper reports the safety, tolerability and pharmacokinetics of GS‐5745 in the entire study population (for single and multiple doses), as well as exploratory efficacy, immunohistochemistry and gene expression outcomes in the multiple‐dose cohorts.
Materials and methods
This trial (ClinicalTrials.gov NCT01831427) was performed at 17 centres in the USA, Hungary, Canada, Belgium, the Netherlands, Moldova and Romania between March 2013 and January 2015. The study was funded by Gilead Sciences, Inc. An independent ethics committee or investigational review board at each centre approved the protocol and all patients gave written informed consent. Patients and all personnel directly involved in the conduct of the study remained blinded to treatment assignment. All authors had access to the study data and reviewed and approved the final manuscript. The study protocol has been provided as supporting information.
Patients
Eligible patients were 18–65 years of age with documented moderately‐to‐severely active UC extending at least 15 cm from the anal verge. Patients in the single ascending dose cohort had to have a minimum Partial Mayo score ≥3 with a rectal bleeding and stool frequency subscore of at least 1. Patients in the multiple ascending dose cohorts had to have a complete Mayo Clinic score ≥6 and an endoscopic subscore ≥2 by blinded central read. The Mayo Clinic scoring system assesses UC disease activity based on four subscores (stool frequency, rectal bleeding, endoscopic findings and physician's global assessment). Total scores range from 0 to 12 with higher scores indicating more severe disease.27 The Partial Mayo score ranges from 1 to 9 based on 3 of the 4 subscores, excluding endoscopy.28 Treatment with stable doses of corticosteroids (≤20 mg/day) were allowed as were oral aminosalicylates, azathioprine, mercaptopurine and methotrexate, provided there were no dose adjustments for these agents within 30 days of screening or during the course of the study. Treatment with approved and investigational biologics within 8 weeks of randomisation and during the study was not permitted. Additional inclusion and exclusion criteria are described in the study protocol provided as supporting information.
Study design
The study design (Figure 1) included single and multiple ascending intravenous (IV) doses as well as an adaptive SC dose (150 mg SC cohort; administered in multiple doses), and was conducted in a staggered, parallel cohort manner to allow for assessment of dose‐dependent adverse events before proceeding to higher doses (Figure S1).
Figure 1.
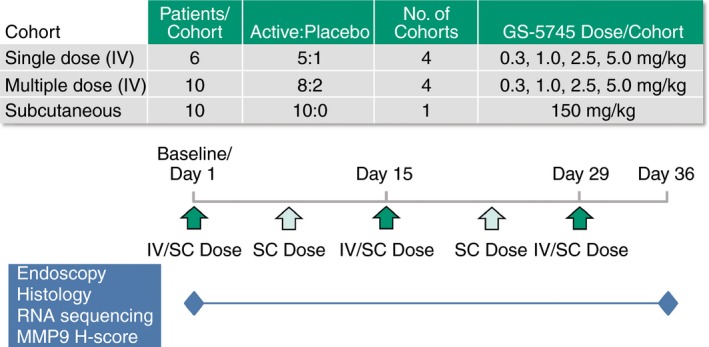
Study design. The study included single and multiple ascending intravenous (IV) dose groups as well as an adaptive subcutaneous (SC) dose group. Patients were randomised 5:1 (GS‐5745:placebo) in the single dose and 8:2 (GS‐5745:placebo) in the multiple‐dose groups to treatment with 0.3, 1.0, 2.5 and 5.0 mg/kg GS‐5745 or placebo. Patients in the adaptive SC dose group were randomised to treatment with 150 mg GS‐5745. Patients in the single IV dose groups had a single infusion on Day 1, whereas patients in the multiple IV dose groups had three infusions separated by 2 weeks, on Days 1, 15 and 29. Patients in the SC dose group received five weekly injections on Days 1, 8, 15, 22 and 29. Adverse events were assessed at all clinic visits and blood sampling for pharmacokinetic sampling was performed as described in the Methods section. Endoscopies and biopsies for endoscopic, histological and molecular analyses were performed on Days 1 and 36.
In the single ascending dose portion of the trial, four sequential cohorts of patients, each randomised 5:1 (GS‐5745:placebo), received a single IV infusion of 0.3, 1.0, 2.5 and 5.0 mg/kg GS‐5745 on Day 1. The first two patients in each dose cohort received their infusions of GS‐5745 in a staggered fashion 24 h apart. Provided no untoward adverse events were observed within 24 h post‐infusion in the first two patients, the remaining four in each dose cohort received infusions. Escalation to a higher dose of GS‐5745 in the single ascending dose portion of the trial was not performed until a thorough assessment of safety and tolerability of the preceding lower dose was completed through Day 14.
Dosing in the multiple ascending dose portion of the trial was initiated following review of the safety and tolerability of a single IV dose of GS‐5745 1.0 mg/kg (single‐dose cohort 2) through Day 15. In this portion of the trial, four sequential cohorts of patients, each randomised 8:2 (GS‐5745:placebo), received three infusions of 0.3, 1.0, 2.5 and 5.0 mg/kg GS‐5745 every 2 weeks on Days 1, 15 and 29. Successive multiple‐dose cohorts received infusions only after the safety data through Day 43 for the preceding lower multiple‐dose cohort, and through Day 15 for the subsequent higher single‐dose cohort were reviewed.
Patients in the 150‐mg SC multiple‐dose cohort were randomised to receive five weekly SC doses of GS‐5745 150 mg on Days 1, 8, 15, 22 and 29. Dosing in this portion of the trial was not initiated until safety data from the GS‐5745 2.5 mg/kg multiple‐dose cohort were reviewed through Day 43. Randomisation was performed centrally using a computerised interactive voice/web response system.
Collection of samples
Patients were seen on Days 1, 2, 3, 8, 15, 29 and 43 in the single ascending dose cohorts, Days 1, 8, 15, 29, 36, 43 and 71 in the multiple ascending dose cohorts and Days 1, 8, 15, 22, 29, 36, 43, and 71 in the 150‐mg SC multiple‐dose cohort. Adverse events, vital signs and concomitant medications were recorded at each visit in all cohorts. Blood sampling for pharmacokinetic analysis occurred at the following timepoints: pre‐dose and 1, 2 and 6 h post dose on Day 1, 24 h, 48 h, and Days 8, 15, 29, and 43 in the single ascending dose cohorts and Days 1, 8, 15, 29 (pre‐dose, 1 h, 2 h, and 6 h post dose on each dosing day) in the multiple ascending and 150‐mg SC dose cohorts (with additional sampling on Day 22 in the 150‐mg SC multiple‐dose cohort). Flexible sigmoidoscopy was performed on Days 1 and 36 for calculation of the complete Mayo Clinic score in the multiple ascending and 150‐mg SC dose cohorts. During both sigmoidoscopies, colonic biopsies (three samples) were taken from an area with active disease on Day 1 and at the same distance from the anal verge on both days. Biopsy samples were used for histological and gene expression analyses. Blinded central reading of endoscopic videos and histology was performed. Urine and blood samples were obtained (pre‐dose on infusion visits) for urinalysis, clinical chemistry and haematology, determination of CRP concentrations and erythrocyte sedimentation rates (ESR), and for use in coagulation assays. Stool samples were collected for measurement of faecal calprotectin and lactoferrin concentrations on Days 1 and 15 in the single ascending dose cohorts and Days 1 and 36 in the multiple ascending and 150‐mg SC dose cohorts. Collection and preparation of samples for immunohistochemistry assessments are described in the supporting information.
For analysis of gene expression, transcriptome sequencing assays were completed on paired (Day 1 and Day 36) samples using the Hi‐Seq platform (Illumina, San Diego, CA, USA). RNA‐seq short reads were aligned to the human reference genome (GRCh37) using STAR (v2.3.0e) software.29
Outcome measures
Primary measures
Clinical and laboratory adverse events were coded using the Medical Dictionary for Regulatory Activities (MedDRA). Adverse event severity was recorded and graded according to the Common Terminology Criteria for Adverse Events Version 4.03.
The pharmacokinetic parameters for the single ascending dose cohorts included GS‐5745 area under the plasma concentration–time curve from time 0 to infinity and to the last quantifiable concentration, maximum plasma concentration and for the multiple ascending dose cohorts, area under the concentration–time curve at the end of the dosing interval, maximum plasma concentration and plasma concentration at the end of the dosing interval.
Pre‐specified exploratory assessments
Exploratory assessments of efficacy were conducted in patients in the multiple‐dose cohorts. These assessments included the proportions of patients who achieved clinical response, clinical remission and endoscopic response. Clinical response was defined as reduction in the complete Mayo Clinic score of ≥3 points and a decrease in at least 30% from the baseline score, with a decrease of ≥1 point on the rectal bleeding subscore or an absolute rectal bleeding subscore of ≤1.28, 30 Clinical remission was defined as a complete Mayo Clinic score ≤2 with no subscore >1. Endoscopic response was defined as Mayo Clinic endoscopic subscore of 0 or 1.
Absolute values and change from baseline in the complete Mayo Clinic score at Day 36 in the multiple ascending and 150‐mg SC dose cohorts were also calculated, as were shifts in distribution from baseline in the Mayo Clinic endoscopic subscore.
Exploratory pharmacodynamic analyses included change from baseline in serum CRP concentrations and ESR as well as faecal concentrations of calprotectin and lactoferrin. The biologic effects associated with a clinical response to GS‐5745 were also explored histologically by comparing the change and percentage change in matrix metalloproteinase‐9 tissue levels by immunohistochemistry. Thresholds were determined for low, medium and high matrix metalloproteinase‐9 staining and the percentage of cells within each category was calculated. Overall matrix metalloproteinase‐9 staining intensity was expressed as a matrixmetalloproteinase‐9 histological score (calculated as 1× [(% low)] + 2 × [% medium] + 3 × [% high]) that considers the distribution and intensity of staining (range, 0–300).
Post hoc assessments
Post hoc assessments included proportion of patients with histological remission, defined as a Geboes score31 of <3 at Day 36. Histological disease activity at Day 36 was also measured using three separate indices (the Geboes and modified Riley scores, and the Robarts Histopathology Index.4, 32, 33 Differential gene expression analyses comparing Day 1 and Day 36 samples as well as samples from patients with a clinical response (‘responders’) and patients who did not meet the criteria for a clinical response (‘nonresponders’) were performed using the Bioconductor edgeR package.34 A GeneGo MetaCore (Thomson Reuters, New York, NY, USA) pathway enrichment analysis against an annotated disease database was performed on the top 50 differentially expressed genes.
Statistical methods
GS‐5745 plasma concentrations and pharmacokinetic parameters, and efficacy and pharmacodynamic outcomes were listed and summarised using descriptive statistics by cohort. Changes from baseline to Day 36 in efficacy outcomes and matrix metalloproteinase‐9 levels were measured using nonparametric methods, and compared using the Wilcoxon two‐sided sample text. For efficacy outcomes, patients without a Day 36 complete Mayo score were considered nonresponders and 95% confidence intervals were calculated using the exact method.35 Data from patients who received placebo in each single and multiple ascending dose cohort were pooled.
Whole transcriptome gene expression before and after treatment with GS‐5745 was analysed using a generalised linear model with negative binomial as the link function. False discovery rate was derived using the Benjamini–Hochberg procedure for multiple testing corrections.36 The top 50 differentially expressed genes in patients treated with GS‐5745 and putative genes associated with a clinical response were selected based on raw P values for the log2 fold change in expression from Day 1 to Day 36. Top differentially expressed genes were then compared against the MetaCore disease‐related gene sets for a disproportionate overlap or enrichment.37 Fisher exact test was used to determine the statistical significance of enrichment.
Due to the exploratory nature of this study and no reliable variability estimation, no formal sample size calculations were used to determine cohort size. Sample sizes in each cohort were based on industry convention for a similar type of study.
Results
Patient disposition and characteristics
Of 124 patients who were screened for enrolment, 74 were randomised and entered the study. Of these, 70 (95%) completed study treatment and 64 (86%) completed the study (Figure 2).
Figure 2.
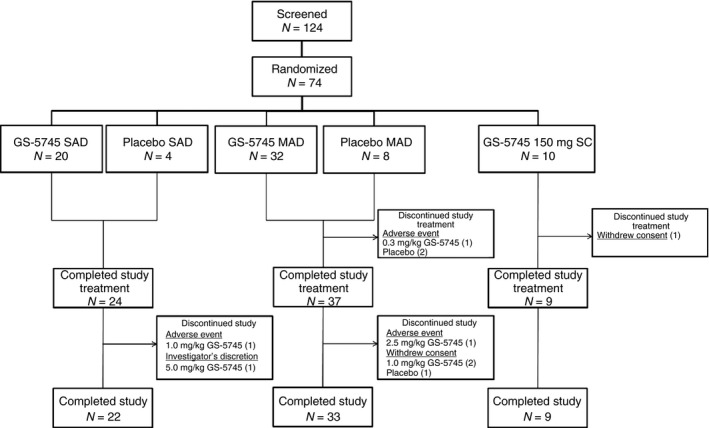
Patient disposition. Of 124 patients screened for eligibility, 74 were randomised to single or multiple doses of GS‐5745 or placebo; 24 were randomised to a single intravenous infusion (n = 20 GS‐5745, n = 4 placebo), 40 were randomised to multiple intravenous infusions (n = 32 GS‐5745, n = 8 placebo) and 10 were randomised to multiple subcutaneous injections of GS‐5745. Of the randomised patients, the following proportions completed study treatment: 24/24 (100%) in the single intravenous dose group, 37/40 (92.5%) in the multiple intravenous dose group (one patient treated with GS‐5745 and two patients treated with placebo discontinued due to an adverse event), and 9/10 (90%) in the multiple subcutaneous GS‐5745 dose group (1 patient withdrew consent). Of the patients who completed study treatment, the following proportions completed the study: 22/24 (91.7%) in the single intravenous dose group (one patient each treated with GS‐5745 discontinued the study due to an adverse event or at the discretion of the investigator), 33/37 (89.2%) in the multiple intravenous dose group (1 patient treated with GS‐5745 discontinued the study due to an adverse event, and two patients in the GS‐5745 group and one patient in the placebo group withdrew consent), and 9/9 (100%) in the multiple subcutaneous GS‐5745 dose group.
The baseline characteristics of the patients participating in the single‐dose portion of the trial are shown in Table 1. The baseline characteristics of the patients participating in the multiple‐dose portion of the trial are shown in Table 2. The mean age of the patients randomised to treatment with multiple doses of GS‐5745 in the combined IV and SC groups was 44 years (range 21–65 years) and there was an equal distribution of males and females. Patients randomised to treatment with GS‐5745 had a mean baseline [standard deviation (s.d.)] complete Mayo score of 8 (1.4), a mean Partial Mayo score of 5 (1.2), and a mean endoscopic subscore of 2 (0.5). Mean baseline UC disease duration was 7 years (range 0–28 years). Disease characteristics of the patients treated with placebo at baseline were similar to those treated with GS‐5745.
Table 1.
Demographics of patients in the single ascending dose cohorts
| Characteristic | GS‐5745 | Pooled placebo (N = 4) | |||
|---|---|---|---|---|---|
| 0.3 mg/kg (N = 5) | 1.0 mg/kg (N = 5) | 2.5 mg/kg (N = 5) | 5.0 mg/kg (N = 5) | ||
| Age, years | 42 ± 11.3 | 37 ± 11.3 | 45 ± 15.4 | 42 ± 12.9 | 41 ± 15.1 |
| Female sex, n (%) | 4 (80) | 3 (60) | 1 (20) | 3 (60) | 3 (75) |
| White race, n (%) | 2 (40) | 3 (60) | 5 (100) | 5 (100) | 3 (75) |
| BMI, kg/m2 | 30.2 ± 9.0 | 24.5 ± 2.1 | 25.2 ± 7.9 | 27.7 ± 9.1 | 31.0 ± 13.5 |
| Weight, kg | 82.8 ± 24.1 | 70.8 ± 9.8 | 79.3 ± 28.5 | 79.7 ± 23.1 | 91.1 ± 41.1 |
| Modified Mayo Score | 6 ± 1.1 | 6 ± 1.3 | 5 ± 1.5 | 4 ± 1.5 | 6 ± 0.0 |
| Disease duration, years | 5 ± 4.7 | 2 ± 2.0 | 20 ± 15.1 | 6 ± 5.7 | 8 ± 5.6 |
| Concomitant medications, n (%) | |||||
| Aminosalicylates | 5 (100) | 4 (80) | 5 (100) | 5 (100) | 4 (100) |
| Corticosteroids | 4 (80) | 4 (80) | 4 (80) | 3 (60) | 3 (75) |
| Azathioprine/mercaptopurine | 3 (60) | 1 (20) | (40) | 1 (20) | 4 (100) |
| Prior anti‐tumour necrosis factor therapy | 0 | 1 (20) | 1 (20) | 0 | 2 (50) |
| Faecal calprotectin, mg/kg | |||||
| Median | 852.5 | 284.1 | 261.1 | 84.8 | 1120.3 |
| Range | 88.8–1852.2 | 23.7–1300.4 | 69.5–1963.1 | 47.0–5768.8 | 511.4–2228.9 |
| Faecal lactoferrin, μg/g | |||||
| Median | 190.8 | 36.5 | 63.4 | 17.9 | 501.3 |
| Range | 19.2–349.9 | 0.81–800.0 | 32.4–252.2 | 2.0–542.5 | 263.8–750.8 |
| Serum CRP, mg/dL | |||||
| Median | 0.44 | 0.61 | 0.20 | 0.57 | 0.37 |
| Range | 0.03–2.03 | 0.02–4.08 | 0.07–2.45 | 0.24–1.85 | 0.18–1.90 |
| ESR, mm/hour | |||||
| Median | 22 | 12 | 21 | 29 | 26 |
| Range | 17–71 | 3–64 | 5–25 | 7–65 | 11–39 |
CRP, C‐reactive protein; ESR, erythrocyte sedimentation rate.
Plus–minus values are means ± s.d.
Table 2.
Demographics of patients in the multiple ascending intravenous and subcutaneous dose cohorts
| Characteristic | GS‐5745 | Pooled placebo (N = 8) | ||||
|---|---|---|---|---|---|---|
| 0.3 mg/kg IV (N = 8) | 1.0 mg/kg IV (N = 8) | 2.5 mg/kg IV (N = 8) | 5.0 mg/kg IV (N = 8) | 150 mg SC (N = 10) | ||
| Age, years | 42 ± 13.9 | 39 ± 11.7 | 38 ± 13.7 | 50 ± 9.8 | 48 ± 8.8 | 44 ± 15.8 |
| Female sex, n (%) | 5 (63) | 3 (38) | 5 (63) | 2 (25) | 6 (60) | 3 (38) |
| White race, n (%) | 7 (88) | 7 (88) | 8 (100) | 8 (100) | 8 (80) | 8 (100) |
| BMI, kg/m2 | 27.9 ± 5.6 | 26.9 ± 8.3 | 25.9 ± 5.3 | 26.1 ± 2.8 | 28.2 ± 6.4 | 27.0 ± 5.1 |
| Weight, kg | 80.1 ± 24.4 | 77.6 ± 23.0 | 73.1 ± 16.4 | 77.2 ± 13.2 | 82.0 ± 21.6 | 81.0 ± 18.1 |
| Complete Mayo Score | 8 ± 1.0 | 8 ± 1.5 | 8 ± 1.1 | 7 ± 1.1 | 9 ± 1.6 | 8 ± 1.8 |
| Partial Mayo Score | 6 ± 0.7 | 5 ± 1.5 | 5 ± 0.8 | 5 ± 1.2 | 6 ± 1.3 | 5 ± 1.6 |
| Disease duration, years | 8 ± 8.6 | 3 ± 3.3 | 6 ± 6.6 | 8 ± 9.2 | 9 ± 5.8 | 6 ± 5.6 |
| Concomitant medications, n (%) | ||||||
| Aminosalicylates | 7 (88) | 7 (88) | 8 (100) | 8 (100) | 10 (100) | 5 (63) |
| Corticosteroids | 6 (75) | 7 (88) | 4 (50) | 4 (50) | 7 (70) | 4 (50) |
| Azathioprine/mercaptopurine | 3 (38) | 2 (25) | 2 (25) | 4 (50) | 3 (30) | 6 (75) |
| Prior anti‐tumour necrosis factor therapy | 0 | 2 (25) | 2 (25) | 2 (25) | 3 (30) | 1 (13) |
| Faecal calprotectin, mg/kg | ||||||
| Median | 578.3 | 599.2 | 847.8 | 597.1 | 544.1 | 800.9 |
| Range | 85.8–4964.8 | 198–2560.0 | 106.4–2781.3 | 94.8–1427.8 | 71.6–677.8 | 62.3–7341.8 |
| Faecal lactoferrin, μg/g | ||||||
| Median | 255.6 | 147.4 | 99.9 | 199.8 | 183.4 | 176.2 |
| Range | 2.9–800.0 | 49.1–800.0 | 21.6–460.9 | 16.4–437.3 | 3.4–800.0 | 14.6–800.01 |
| Serum CRP, mg/dL | ||||||
| Median | 0.40 | 2.12 | 0.63 | 0.37 | 0.54 | 0.57 |
| Range | 0.07–9.12 | 0.27–4.9 | 0.08–3.48 | 0.05–2.18 | 0.02–1.07 | 0.05–5.28 |
| ESR, mm/hour | ||||||
| Median | 28 | 27 | 18 | 21 | 10 | 17 |
| Range | 4–36 | 7–40 | 3–92 | 6–36 | 1–23 | 5–80 |
TNF, tumour necrosis factor; CRP, C‐reactive protein; ESR, erythrocyte sedimentation rate
Plus–minus values are means ± s.d.
Safety
Safety findings in the single ascending dose cohorts are shown in Table S1.
Among patients in the multiple ascending and SC dose cohorts, 23 of 42 (55%) of those treated with GS‐5745, and five of eight (63%) treated with placebo reported at least one adverse event during the study, and most were Grade 1 or 2 in severity (Table 3). The most common adverse events in patients treated with GS‐5745 in the multiple‐dose groups were anaemia, fatigue, nasopharyngitis and headache. Ten patients treated with GS‐5745, and three treated with placebo had adverse events that were considered related to study drug by the investigator. Two patients treated with GS‐5745 had serious adverse events, both of which were considered treatment‐related by the investigator; one patient in the GS‐5745 0.3 mg/kg multiple‐dose cohort had a Grade 4 serious adverse event of hypersensitivity on Day 14 during the second infusion which lead to study drug discontinuation, and one patient in the GS‐5745 1.0 mg/kg multiple‐dose cohort had Grade 3 worsening of UC that led to hospitalisation and required treatment with IV steroids. The serious adverse event of hypersensitivity was the only adverse event leading to study drug discontinuation in patients treated with GS‐5745.
Table 3.
Summary of safety findings in the multiple ascending intravenous and subcutaneous dose cohorts
| GS‐5745, n (%) | Pooled placebo (N = 8) | ||||||
|---|---|---|---|---|---|---|---|
| 0.3 mg/kg IV (N = 8) | 1.0 mg/kg IV (N = 8) | 2.5 mg/kg IV (N = 8) | 5.0 mg/kg IV (N = 8) | 150 mg SC (N = 10) | IV + SC combined (N = 42) | ||
| Any adverse event | 2 (25) | 6 (75) | 5 (63) | 5 (63) | 5 (50) | 23 (55) | 5 (63) |
| Grade 3 or above adverse event | 1 (13) | 1 (13) | 0 | 0 | 0 | 2 (5) | 2 (25) |
| Grade 2 or above adverse event | 1 (13) | 4 (50) | 3 (38) | 1 (13) | 3 (30) | 12 (29) | 5 (63) |
| Adverse event related to study drug | 1 (13) | 3 (38) | 2 (25) | 3 (38) | 1 (10) | 10 (24) | 3 (38) |
| Serious adverse event | 1 (13)a | 1 (13)b | 0 | 0 | 0 | 2 (5) | 1 (13)c |
| Adverse event leading to study drug discontinuation | 1 (13) | 0 | 0 | 0 | 0 | 1 (2) | 2 (25) |
| Adverse event occurring in ≥5% of patients in any GS‐5745 group | |||||||
| Anaemia | 0 | 3 (38) | 2 (25) | 0 | 0 | 5 (12) | 4 (50) |
| Fatigue | 0 | 2 (25) | 1 (13) | 0 | 0 | 3 (7) | 1 (13) |
| Nasopharyngitis | 1 (13) | 0 | 0 | 2 (25) | 0 | 3 (7) | 0 |
| Headache | 0 | 0 | 0 | 2 (25) | 1 (10) | 3 (7) | 2 (25) |
Grade 4 hypersensitivity after 2nd dose.
Worsening of UC at Day 43 requiring IV steroids.
Grade 3 anaemia requiring peripheral blood mononuclear cell transfusion.
Pharmacokinetics
In single‐dose cohorts, GS‐5745 displayed typical nonlinear pharmacokinetic profiles, with nonparalleled terminal phases across dose levels and plasma concentrations dropping relatively faster at lower concentrations. Maximum plasma concentrations of GS‐5745 increased approximately dose proportionally, the area under the plasma concentration–time curve increased more than dose proportionally, and half‐lives were longer at higher doses (Table S2). Overall, these results suggested a contribution of target‐mediated drug disposition to GS‐5745 pharmacokinetics. Consistent with typical monoclonal antibodies, the steady state volume of distribution was low (Table S2), suggesting limited extravascular distribution.
In multiple‐dose cohorts, GS‐5745 displayed typical nonlinear pharmacokinetic profiles with nonparalleled terminal phases across IV dose levels (Figure 3). Consistent with single‐dose pharmacokinetic data, after three IV infusions every other week, GS‐5745 maximum plasma concentration increased approximately dose proportionally and the area under the plasma concentration–time curve at the end of the dosing interval increased more than dose proportionally (Table S3). At the lower doses of GS‐5745 (0.3, 1.0, and 2.5 mg/kg IV), maximum plasma concentration was similar on Days 1 and 29 and plasma concentration at the end of the dosing interval was below detection level for all or most patients, consistent with the short plasma half‐life at these dose levels and expected lack of accumulation after multiple dosing. There was modest accumulation (27% increase in mean maximum plasma concentration) following every other week dosing with GS‐5745 5.0 mg/kg IV, which is consistent with reduced target‐mediated drug disposition and longer half‐life at this dose level. A schedule‐adjusted area under the concentration–time curve demonstrated that exposure to GS‐5745 150 mg SC weekly was similar to exposure to GS‐5745 2.5 mg/kg IV every 2 weeks.
Figure 3.
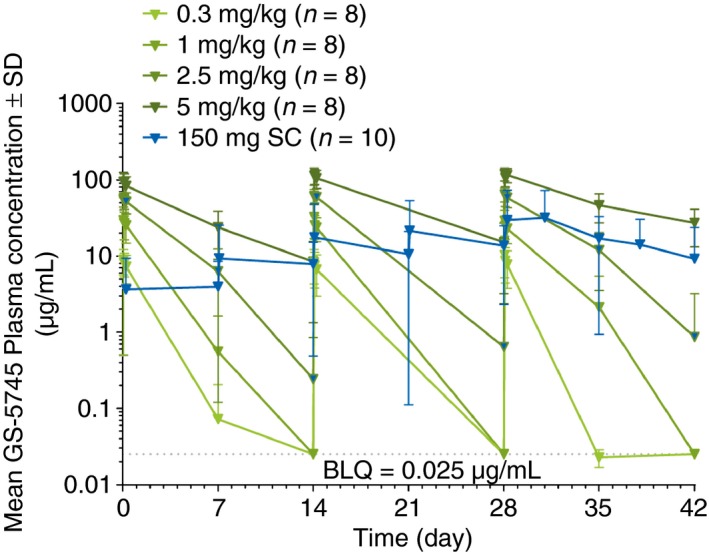
Dose‐dependent GS‐5745 plasma concentrations over time. GS‐5745 displayed typical nonlinear pharmacokinetic profiles with nonparalleled terminal phases across intravenous dose levels in the multiple‐dose cohorts.
Clinical efficacy
The results of the exploratory efficacy analyses by dose are shown in Table 4. In the pooled multiple‐dose cohorts, clinical response occurred in 18 of 42 [43%; 95% confidence interval (CI) 28–59%] patients treated with GS‐5745 and 1 of 8 (13%; 95% CI <1–53%) patients treated with placebo. Clinical remission occurred in 6 of 42 patients (14%; 95% CI 5–29%) treated with GS‐5745 and 0 of 8 (0%; 95% CI 0–37%) patients treated with placebo. Endoscopic response occurred in 14 of 42 (33%; 95% CI 20–50%) of patients treated with GS‐5745 and 2 of 8 (25%; 95% CI 3–65%) of patients treated with placebo. Histological remission occurred in 18 of 37 (49%; 95% CI 32–66%) patients treated with GS‐5745 and 3 of 5 (60%; 95% CI 15–95%) patients treated with placebo.
Table 4.
Summary of efficacy outcomes in the multiple ascending intravenous and subcutaneous dose cohorts
| Outcome | GS‐5745, n/N (%) | Pooled placebo | |||||
|---|---|---|---|---|---|---|---|
| 0.3 mg/kg IV | 1.0 mg/kg IV | 2.5 mg/kg IV | 5.0 mg/kg IV | 150 mg SC | IV + SC combined | ||
| Clinical response | 3/8 (38) | 4/8 (50) | 4/8 (50) | 3/8 (38) | 4/10 (40) | 18/42 (43) | 1/8 (13) |
| Clinical remission | 0/8 (0) | 2/8 (25) | 2/8 (25) | 0/8 (0) | 2/10 (20) | 6/42 (14) | 0/8 (0) |
| Endoscopic response | 2/8 (25) | 3/8 (38) | 3/8 (38) | 1/8 (13) | 5/10 (50) | 14/42 (33) | 2/8 (25) |
| Histological remissiona | 2/6 (33) | 4/7 (57) | 4/8 (50) | 3/7 (43) | 5/9 (56) | 18/37 (49) | 3/5 (60) |
Data are reported for patients who had paired baseline and Day 36 biopsy samples
The mean change in the Mayo Clinic score from baseline to Day 36 for each patient in the multiple‐dose cohorts (IV and SC) is shown in Figure 4. In the multiple‐dose cohorts, Mayo Clinic scores decreased a mean (s.d.) of 2 (2.6) points in patients treated with GS‐5745 and 1 (1.8) points in patients treated with placebo. Overall, 28 of 42 patients (67%) treated with GS‐5745 had an improvement, 6 of 42 (14%) had a worsening, and 8 of 42 (19%) had no change (or were missing a complete Mayo Clinic score) in the complete Mayo Clinic score through Day 36. For patients treated with placebo three of eight patients (38%) had an improvement, one of eight (13%) had a worsening and four of eight (50%) had no change (or were missing a complete Mayo Clinic score). Twenty patients treated with GS‐5745 had 1 (n = 15) or 2 (n = 5) point decreases in the Mayo Clinic endoscopic subscore from baseline to Day 36, whereas 23 patients had unchanged subscores, and two patients had a 1 point increase. One patient each in the placebo group had a 1 or 2 point decrease in the Mayo Clinic endoscopic subscore from baseline, three had unchanged subscores, and one patient had a 1 point increase.
Figure 4.
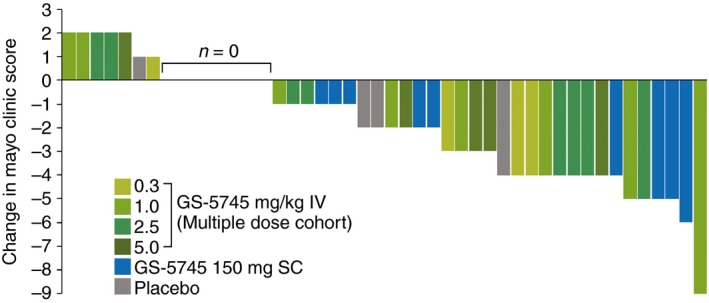
Individual patient changes in the Mayo Clinic Score from baseline to Day 36. Overall, 28 of 42 patients (67%) treated with GS‐5745 had an improvement, 6 of 42 (14%) had a worsening, and 8 of 42 (19%) had no change (or were missing a complete Mayo Clinic score) in the complete Mayo Clinic score through Day 36. For patients treated with placebo, three of eight patients (38%) had an improvement, one of eight (13%) had a worsening and four of eight (50%) had no change (or were missing a complete Mayo Clinic score).
Pharmacodynamics
There was no apparent treatment effect of GS‐5745 on the change from baseline to Day 36 in median concentrations of CRP, or faecal calprotectin and lactoferrin. Similar results were observed for change from baseline in median ESR (Table S4).
Histology
A statistically significant reduction in matrix metalloproteinase‐9 staining (as measured by matrix metalloproteinase‐9 histologic score) was observed in Day 36 biopsy sections in patients who were in clinical response following treatment with GS‐5745 (‘responders’) compared to those who did not meet the response criteria (‘nonresponders’). The change and percentage change from baseline to Day 36 in the matrix metalloproteinase‐9 histological score are shown in Table 5. A clinical response to GS‐5745 and a reduction in matrix metalloproteinase‐9 tissue levels were accompanied by histological improvement at Day 36 as measured by three independent disease activity indices (Table 6). Histological disease activity scores were unchanged at Day 36 in patients who were considered ‘nonresponders’, whereas ‘responders’ had scores below the thresholds associated with other definitions of disease remission for the Geboes score and the Robarts Histopathology Index.31, 38
Table 5.
Change in matrix metalloproteinase‐9 levels according to response status in patients treated with GS‐5745
| Matrix metalloproteinase‐9 histologic score | Clinical response status at Day 36 | P value | |
|---|---|---|---|
| Nonresponder (n = 21) | Responder (n = 14) | ||
| Change from baseline | |||
| Mean (s.d.) | −6.0 (38) | −44.3 (42.5) | 0.016 |
| Median (range) | −4.7 (−70–68.2) | −41.5 (−134.6–23.4) | |
| Percentage change from baseline | |||
| Mean (s.d.) | 18.5 (82.1) | −48.9 (41.1) | 0.008 |
| Median (range) | −2.55 (−69.2–235.8) | −50.0 (−99.1–62.5) | |
Table 6.
Histological outcomes according to response status in patients treated with GS‐5745
| Clinical response status at Day 36 | |||
|---|---|---|---|
| Nonresponder | Responder | P value | |
| Robarts Histopathology Index | (n = 18) | (n = 14) | |
| Baseline | 15.2 | 16.2 | |
| Day 36 | 17.8 | 4.14 | |
| Change from baseline | 2.6 | −12.1 | <0.001 |
| Modified Riley Score | (n = 21) | (n = 14) | |
| Baseline | 5.2 | 4.9 | |
| Day 36 | 5.3 | 2.1 | |
| Change from baseline | 0.14 | −2.7 | 0.002 |
| Geboes Scorea | (n = 21) | (n = 14) | |
| Baseline | 4.4 | 4.1 | |
| Day 36 | 4.5 | 2.1 | |
| Change from baseline | 0.05 | −1.9 | 0.004 |
Scored 0 ‐5 (2a and 2b scores are combined).
Gene expression
Samples from 26 patients treated with GS‐5745 and six patients treated with placebo were evaluable based on quality assessment and were subjected to transcriptome sequencing for analysis of gene expression. The top 50 differentially expressed genes between Day 36 and baseline (based on log2 fold change in expression in patients treated with GS‐5745) are shown in Table S5. Unsupervised hierarchical clustering was carried out based on log fold change in the top 50 differentially expressed genes derived from the treatment group (Figure S2). Patient clusters showed a modest separation based on disease severity. The top 50 genes were found to be enriched for genes relevant to pathogenesis of inflammatory bowel diseases based on the MetaCore disease marker database (e.g. PI3, CXCL6, FCGR3A, PDK4, CD86, S100A9, IL2RA and IL19). Genes among these top 50 were also found to be associated with immune response (e.g. CCL18, FCGR3A, CD86, IL2RA) and inflammatory defence pathways (e.g. S100A7, S100A9, CXCL6). Several potentially biologically relevant genes were observed to show a more pronounced change in the responder group (n = 15) compared with nonresponders (n = 11, for example, IL19, FCGR3A, CXCL6, IL2RA, CD86, S100A9, AQP1). However, the differences in expression levels based on responder status were not statistically significant, likely due to the small sample size. The top 50 differentially expressed genes between Day 36 and baseline based response status in patients treated with GS‐5745 are shown in Table S6. Differentially expressed genes derived from the responder group were enriched for genes relevant to pathogenesis of inflammatory bowel disease. The expression of a number of these genes (interleukin‐17 and ‐23, matrix metalloproteinase‐3) was decreased in responders compared with nonresponders.
Discussion
In this phase 1 randomised placebo‐controlled trial, short‐term treatment with both single and multiple (IV and SC) ascending doses of the anti‐matrix metalloproteinase‐9 monoclonal antibody GS‐5745 were shown to be safe and well‐tolerated in patients with moderately‐to‐severely active UC. Patients in the multiple‐dose cohorts demonstrated clinical, endoscopic and histological responses to treatment. Furthermore, both immunohistochemistry and gene expression analyses revealed an association between clinical outcomes and the biologic effect of treatment with GS‐5745. Patients with clinical response to GS‐5745 had reduced tissue levels of matrix metalloproteinase‐9 (indicating target engagement by GS‐5745), histologic improvement (and remission) and significant changes in the expression of genes that are involved in the host immune response.
Clinical response, remission and mucosal healing rates were highest in the 1 mg/kg IV, 2.5 mg/kg IV and 150 mg SC cohorts and were lowest in the 0.3 mg/kg IV and 5.0 mg/kg IV cohorts (Figure 2). The reasons for the least efficacy in the lowest and highest tested doses are unknown. The baseline disease characteristics, gene expression and matrix metalloproteinase‐9 tissue levels were not different in these patients. When the mean change in overall Mayo score and rates of histological remission are compared, however, all doses – with the exception of the lowest dose (0.3 mg/kg) – performed relatively similarly. These data may suggest that tissue matrix metalloproteinase‐9 is saturated at low GS‐5745 concentrations and thus higher doses provide no additional therapeutic benefit.
Although the therapeutic potential of targeting matrix metalloproteinases has long been recognised in multiple disease states, development of matrix metalloproteinase inhibitors, including inhibitors of matrix metalloproteinase‐9 has been hampered by their association with unacceptable safety profiles, including the development of musculoskeletal syndrome.39, 40 The dose‐limiting toxicities of earlier agents, however, were likely due to their broad spectrum and semi‐selective activities. Our results are consistent with those reported with AB0041 (the mouse precursor to humanised GS‐5745) in the rat musculoskeletal syndrome model – patients in the current trial did not report adverse events associated with musculoskeletal syndrome through Day 71 (the last study‐follow‐up visit).21 Consistent with the nonlinear pharmacokinetic profile of GS‐5745, there did not appear to be dose‐dependent increases in the types or frequency of adverse events. Although slightly more than half of the patients treated with multiple doses of GS‐5745 reported at least one adverse event in the study, most of these events were mild to moderate. Given that IV and SC dosing had comparable safety and efficacy profiles, SC dosing of GS‐5745 is being pursued in further clinical development.
The comparison of gene expression profiles between patients treated with GS‐5745 and those treated with placebo suggest that targeting matrix metalloproteinase‐9 has a specific effect on immune‐related pathways. This immunomodulatory effect (e.g. decreased expression of interleukin‐17B and interleukin‐23) is more pronounced in responders than in nonresponders, but whether this is a direct effect of matrix metalloproteinase‐9 inhibition or a consequence of improvements in disease severity is unclear.
In summary, our results show that GS‐5745 is well‐tolerated in patients with active UC, and that treatment with multiple IV or SC doses results in favourable clinical, endoscopic and histological outcomes, particularly in patients with reductions in matrix metalloproteinase‐9 tissue levels. This integrated approach of assessing clinical (Mayo clinic score with centrally read endoscopy), biological (gene and tissue expression) and histological components as a response to therapy has provided evidence of the therapeutic potential of GS‐5745 despite a small sample size. These positive data support further clinical development of GS‐5745 for patients with moderately‐to‐severely active UC.
Authorship
Guarantor of the article: WJS.
Author contributions: WJS, EY, XZ, ZJ, DG, YX, ZY, DF, JAS, BK and BGF made substantial contributions to the conception and design of the study. WJS, BRB, RF, JO and SDL were involved in the acquisition of data. All authors were involved in the analysis and interpretation of data. WJS, BGF and LMS were responsible for drafting of the manuscript. All authors participated in critical revision of the manuscript for important intellectual content. WJS had full access to all of the data and takes full responsibility for the veracity of the data and statistical analysis. ZY and RKP performed the statistical analyses. All authors participated in drafting the article or revising it critically for important intellectual content.
All authors approved the final version and jointly decided to submit the manuscript.
Supporting information
Figure S1. Study cohort dosing overview.
Figure S2. Hierarchical clustering with Log2 fold change in the top 50 differentially expressed genes from baseline to Day 36 by treatment.
Table S1. Summary of safety findings in the single‐dose cohorts.
Table S2. GS‐5745 plasma pharmacokinetic parameters in the single‐dose cohorts.
Table S3. GS‐5745 plasma pharmacokinetic parameters in the MAD and SC cohorts.
Table S4. Biomarker values according to treatment group
Table S5. Top differentially expressed genes from baseline to Day 36 by treatment.
Table S6. Top differentially expressed genes from baseline to Day 36 by response status for patients treated with GS‐5745.
Acknowledgements
Declaration of personal interests: WJS has received consulting fees from Abbott, ActoGeniX NV, AGI Therapeutics Inc, Alba Therapeutics Corp, Albireo, Alfa Wasserman, Amgen, AM‐Pharma BV, Anaphore, Astellas, Athersys Inc, Atlantic Healthcare Ltd, Aptalis, BioBalance Corp, Boehringer‐Ingelheim, Bristol‐Myers Squibb, Celgene, Celek Pharmaceuticals, Cellerix SL, Cerimon Pharmaceuticals, ChemoCentryx, CoMentis, Cosmo Technologies, Coronado Biosciences, Cytokine Pharmasciences, Eagle Pharmaceuticals, EnGene Inc, Eli Lilly, Enteromedics, Exagen Diagnostics Inc, Ferring Pharmaceuticals, Flexio Therapeutics Inc, Funxional Therapeutics Ltd, Genzyme Corp, Gilead Sciences, Given Imaging, GSK, Human Genome Sciences, Ironwood Pharmaceuticals, KaloBios Pharmaceuticals, Lexicon Pharmaceuticals, Lycera Corp, Meda Pharmaceuticals, Merck Research Laboratories, Merck Serono, Millenium Pharmaceuticals, Nisshin Kyorin Pharmaceuticals, Novo Nordisk, NPS Pharmaceuticals, Optimer Pharmaceuticals, Orexigen Therapeutics Inc, PDL Biopharma, Pfizer, Procter and Gamble, Prometheus Laboratories, ProtAb Ltd, Purgenesis Technologies Inc, Relypsa Inc, Roche, Salient Pharmaceuticals, Salix Pharmaceuticals, Santarus, Schering Plough, Shire Pharmaceuticals, Sigmoid Pharma Ltd, Sirtris Pharmaceuticals, SLA Pharma UK Ltd, Targacept, Teva Pharmaceuticals, Therakos, Tillotts Pharma AG, TxCell SA, UCB Pharma, Viamet Pharmaceuticals, Vascular Biogenics Ltd, Warner Chilcott UK Ltd and Wyeth; research grants from Abbott, Bristol‐Myers Squibb, Genentech, GSK, Janssen, Milennium Pharmaceuticals, Novartis, Pfizer, Procter and Gamble, Shire Pharmaceuticals and UCB Pharma; payments for lectures/speakers bureaus from Abbott, Bristol‐Myers Squibb and Janssen; and holds stock/stock options in Enteromedics. BRB, RF, JO, SDL, RKP: nothing to disclose. EY, XZ, ZJ, DG, YX, ZY, DF, JAS, BK, GMS, JGM: employees of Gilead Sciences, Inc. LMS is an employee of Robarts Clinical Trials, Inc, which is a research organisation that participated in this study. BGL has received consulting fees from Prometheus Laboratories, Santarus, Nestle Health Sciences, Takeda Pharmaceuticals and is an employee of Robarts Clinical Trials which was a research organisation that participated in this study. BGF has received grant/research support from Millennium Pharmaceuticals, Merck, Tillotts Pharma AG, Abbott Labs, Novartis Pharmaceuticals, Centocor Inc., Elan/Biogen, UCB Pharma, Bristol‐Myers Squibb, Genentech, ActoGenix, Wyeth Pharmaceuticals Inc.; Consulting fees from Millennium Pharmaceuticals, Merck, Centocor Inc., Elan/Biogen, Janssen‐Ortho, Teva Pharmaceuticals, Bristol‐Myers Squibb, Celgene, UCB Pharma, Abbott Labs, Astra Zeneca, Serono, Genentech, Tillotts Pharma AG, Unity Pharmaceuticals, Albireo Pharma, Given Imaging Inc., Salix Pharmaceuticals, Novonordisk, GSK, Actogenix, Prometheus Therapeutics and Diagnostics, Athersys, Axcan, Gilead, Pfizer, Shire, Wyeth, Zealand Pharma, Zyngenia, GiCare Pharma Inc. Sigmoid Pharma; Speakers Bureau for UCB, Abbott, J&J/Janssen.
Declaration of funding interests: This study was funded in full by Gilead Sciences, Inc. Writing support was provided by Robarts Clinical Trials, Inc. (funded by Gilead Sciences, Inc.)
This article was accepted for publication after full peer‐review.
References
- 1. Abraham C, Cho JH. Inflammatory bowel disease. N Engl J Med 2009; 361: 2066–78. [DOI] [PMC free article] [PubMed] [Google Scholar]
- 2. Ordás I, Eckmann L, Talamini M, Baumgart DC, Sandborn WJ. Ulcerative colitis. Lancet 2012; 380: 1606–19. [DOI] [PubMed] [Google Scholar]
- 3. Kornbluth A, Sachar DB; Practice Parameters Committee of the American College of Gastroenterology . Ulcerative colitis practice guidelines in adults: American College Of Gastroenterology, Practice Parameters Committee. Am J Gastroenterol 2010; 105: 501–23. [DOI] [PubMed] [Google Scholar]
- 4. Feagan BG, Rutgeerts P, Sands BE, et al Vedolizumab as induction and maintenance therapy for ulcerative colitis. N Engl J Med 2013; 369: 699–710. [DOI] [PubMed] [Google Scholar]
- 5. Allez M, Karmiris K, Louis E, et al Report of the ECCO pathogenesis workshop on anti‐TNF therapy failures in inflammatory bowel diseases: definitions, frequency and pharmacological aspects. J Crohns Colitis 2010; 4: 355–66. [DOI] [PubMed] [Google Scholar]
- 6. D'Haens GR, Panaccione R, Higgins PD, et al The London position statement of the world congress of gastroenterology on biological therapy for IBD with the European Crohn's and colitis organization: when to start, when to stop, which drug to choose, and how to predict response? Am J Gastroenterol 2011; 106: 199–212. [DOI] [PubMed] [Google Scholar]
- 7. Ben‐Horin S, Chowers Y. Review article: loss of response to anti‐TNF treatments in Crohn's disease. Aliment Pharmacol Ther 2011; 33: 987–95. [DOI] [PubMed] [Google Scholar]
- 8. Sternlicht MD, Werb Z. How matrix metalloproteinases regulate cell behavior. Ann Rev Cell Dev Biol 2001; 17: 463–516. [DOI] [PMC free article] [PubMed] [Google Scholar]
- 9. Ravi A, Garg P, Sitaraman SV. Matrix metalloproteinases in inflammatory bowel disease: boon or a bane? Inflamm Bowel Dis 2007; 13: 97–107. [DOI] [PubMed] [Google Scholar]
- 10. Page‐McCaw A, Ewald AJ, Werb Z. Matrix metalloproteinases and the regulation of tissue remodelling. Nat Rev Mol Cell Biol 2007; 8: 221–33. [DOI] [PMC free article] [PubMed] [Google Scholar]
- 11. Rodrıguez DZ, Morrison CJ, Overall CM. Matrix metalloproteinases: what do they not do? New substrates and biological roles identified by murine models and proteomics. Biochim Biophys Acta 2010; 1803: 39–54. [DOI] [PubMed] [Google Scholar]
- 12. Medina C, Radomski MW. Role of matrix metalloproteinases in intestinal inflammation. J Pharmacol Exp Ther 2006; 318: 933–8. [DOI] [PubMed] [Google Scholar]
- 13. von Lampe B, Barthel B, Coupland SE, Riecken EO, Rosewicz S. Differential expression of matrix metalloproteinases and their tissue inhibitors in colon mucosa of patients with inflammatory bowel disease. Gut 2000; 47: 63–73. [DOI] [PMC free article] [PubMed] [Google Scholar]
- 14. Medina C, Videla S, Radomski A, et al Increased activity and expression of matrix metalloproteinase‐9 in a rat model of distal colitis. Am J Physiol Gastrointest Liver Physiol 2003; 284: G116–22. [DOI] [PubMed] [Google Scholar]
- 15. O'Sullivan S, Gilmer JF, Medina C. Matrix metalloproteinases in inflammatory bowel disease: an update. Mediators Inflamm 2015; 2015: 964131. doi: 10.1155/2015/964131 [Epub ahead of print]. [DOI] [PMC free article] [PubMed] [Google Scholar]
- 16. Annaházi A, Molnár T, Farkas K, et al Fecal MMP‐9: a new noninvasive differential diagnostic and activity marker in ulcerative colitis. Inflamm Bowel Dis 2013; 19: 316–20. [DOI] [PubMed] [Google Scholar]
- 17. Faubion WA Jr, Fletcher JG, O'Byrne S, et al EMerging BiomARKers in Inflammatory Bowel Disease (EMBARK) study identifies fecal calprotectin, serum MMP9, and serum IL‐22 as a novel combination of biomarkers for Crohn's disease activity: role of cross‐sectional imaging. Am J Gastroenterol 2013; 108: 1891–900. [DOI] [PubMed] [Google Scholar]
- 18. de Bruyn M, Arijs I, Wollants WJ, et al Neutrophil gelatinase B‐associated lipocalin and matrix metalloproteinase‐9 complex as a surrogate serum marker of mucosal healing in ulcerative colitis. Inflamm Bowel Dis 2014; 20: 1198–207. [DOI] [PubMed] [Google Scholar]
- 19. Farkas K, Saródi Z, Bálint A, et al The diagnostic value of a new fecal marker, matrix metalloprotease‐9, in different types of inflammatory bowel diseases. J Crohns Colitis 2015; 9: 231–7. [DOI] [PubMed] [Google Scholar]
- 20. Castaneda FE, Walia B, Vijay‐Kumar M, et al Targeted deletion of metalloproteinase 9 attenuates experimental colitis in mice: central role of epithelial‐derived MMP. Gastroenterology 2005; 129: 1991–2008. [DOI] [PubMed] [Google Scholar]
- 21. Marshall DC, Lyman SK, McCauley S, et al Selective allosteric inhibition of MMP9 is efficacious in preclinical models of ulcerative colitis and cancer. PLoS ONE 2015; 10: e0127063. [DOI] [PMC free article] [PubMed] [Google Scholar]
- 22. Baugh MD, Perry MJ, Hollander AP, et al Matrix metalloproteinase levels are elevated in inflammatory bowel disease. Gastroenterology 1999; 117: 814–22. [DOI] [PubMed] [Google Scholar]
- 23. Gao Q, Meijer MJ, Kubben FJ, et al Expression of matrix metalloproteinases‐2 and ‐9 in intestinal tissue of patients with inflammatory bowel diseases. Dig Liver Dis 2005; 37: 584–92. [DOI] [PubMed] [Google Scholar]
- 24. Lakatos G, Sipos F, Miheller P, et al The behavior of matrix metalloproteinase‐9 in lymphocytic colitis, collagenous colitis and ulcerative colitis. Pathol Oncol Res 2012; 18: 85–91. [DOI] [PubMed] [Google Scholar]
- 25. Matusiewicz M, Neubauer K, Mierzchala‐Pasierb M, Gamian A, Krzystek‐Korpacka M. Matrix metalloproteinase‐9: its interplay with angiogenic factors in inflammatory bowel diseases. Dis Markers 2014; 2014: 643645. [DOI] [PMC free article] [PubMed] [Google Scholar]
- 26. Kolho KL, Sipponen T, Valtonen E, Savilahti E. Fecal calprotectin, MMP‐9, and human beta‐defensin‐2 levels in pediatric inflammatory bowel disease. Int J Colorectal Dis 2014; 29: 43–50. [DOI] [PubMed] [Google Scholar]
- 27. Schroeder KW, Tremaine WJ, Ilstrup DM. Coated oral 5‐aminosalicylic acid therapy for mildly to moderately active ulcerative colitis. A randomized study. N Engl J Med 1987; 317: 1625–9. [DOI] [PubMed] [Google Scholar]
- 28. Rutgeerts P, Sandborn WJ, Feagan BG, et al Infliximab for induction and maintenance therapy for ulcerative colitis. N Engl J Med 2005; 353: 2462–76. [DOI] [PubMed] [Google Scholar]
- 29. Dobin A, Davis CA, Schlesinger F, et al STAR: ultrafast universal RNA‐seq aligner. Bioinformatics 2013; 29: 15–21. [DOI] [PMC free article] [PubMed] [Google Scholar]
- 30. D'Haens G, Sandborn WJ, Feagan BG, et al A review of activity indices and efficacy end points for clinical trials of medical therapy in adults with ulcerative colitis. Gastroenterology 2007; 132: 763–86. [DOI] [PubMed] [Google Scholar]
- 31. Geboes K, Riddell R, Ost A, et al A reproducible grading scale for histological assessment of inflammation in ulcerative colitis. Gut 2000; 47: 404–9. [DOI] [PMC free article] [PubMed] [Google Scholar]
- 32. Riley SA, Mani V, Goodman MJ, Dutt S, Herd ME. Microscopic activity in ulcerative colitis: what does it mean? Gut 1991; 32: 174–8. [DOI] [PMC free article] [PubMed] [Google Scholar]
- 33. Mosli MM, Feagan BG, Zou GY, et al Reproducibility of histological assessments of disease activity in UC. Gut 2014; 64: 1765–73. [DOI] [PubMed] [Google Scholar]
- 34. Robinson MD, McCarthy DJ, Smyth GK. edgeR: a Bioconductor package for differential expression analysis of digital gene expression data. Bioinformatics 2010; 26: 139–40. [DOI] [PMC free article] [PubMed] [Google Scholar]
- 35. Clopper C, Pearson ES. The use of confidence or fiducial limits illustrated in the case of the binomial. Biometrika 1934; 26: 404–13. [Google Scholar]
- 36. Benjamini Y, Hochberg Y. Controlling the false discovery rate: a practical and powerful approach to multiple testing. J R Stat Soc Series B Stat Methodol 1995; 57: 289–300. [Google Scholar]
- 37. Khatri P, Sirota M, Butte AJ. Ten years of pathway analysis: current approaches and outstanding challenges. PLoS Comput Biol 2012; 8: e1002375. [DOI] [PMC free article] [PubMed] [Google Scholar]
- 38. Mosli MH, Feagan BG, Zou G, et al Development and validation of a histological index for UC. Gut 2015; pii: gutjnl‐2015‐310393. doi: 10.1136/gutjnl‐2015‐310393 [Epub ahead of print]. [DOI] [PubMed] [Google Scholar]
- 39. Coussens LM, Fingleton B, Matrisian LM. Matrix metalloproteinase inhibitors and cancer: trials and tribulations. Science 2002; 295: 2387–92. [DOI] [PubMed] [Google Scholar]
- 40. Peterson JT. The importance of estimating the therapeutic index in the development of matrix metalloproteinase inhibitors. Cardiovasc Res 2006; 69: 677–87. [DOI] [PubMed] [Google Scholar]
Associated Data
This section collects any data citations, data availability statements, or supplementary materials included in this article.
Supplementary Materials
Figure S1. Study cohort dosing overview.
Figure S2. Hierarchical clustering with Log2 fold change in the top 50 differentially expressed genes from baseline to Day 36 by treatment.
Table S1. Summary of safety findings in the single‐dose cohorts.
Table S2. GS‐5745 plasma pharmacokinetic parameters in the single‐dose cohorts.
Table S3. GS‐5745 plasma pharmacokinetic parameters in the MAD and SC cohorts.
Table S4. Biomarker values according to treatment group
Table S5. Top differentially expressed genes from baseline to Day 36 by treatment.
Table S6. Top differentially expressed genes from baseline to Day 36 by response status for patients treated with GS‐5745.