

Summary
Objective
To describe the characteristics of real‐world patients potentially eligible for adjunctive pharmacotherapy for weight loss.
Methods
Patients from the GE Centricity electronic medical record database were selected if they had body mass index (BMI) ≥30 or ≥27 to <30 kg m−2 with ≥1 obesity‐associated comorbidity (hypertension, dyslipidemia, or type 2 diabetes) from 2002–2011; were aged ≥18 years and had ≥12 months of continuous enrollment before and after the date of first eligible BMI recorded (index date). Descriptive statistics and logistic regression were used for analysis.
Results
Of the 1,835,541 patients with overweight or obesity included, comorbidities were common (hypertension [55.4%], dyslipidemia [36.1%] and type 2 diabetes [13.4%]). The percentage of patients who received pharmacotherapy for weight loss was 0.7% within 12 months after the index date. Patients who received pharmacotherapy had higher BMI (median, 33.6 vs. 31.3 kg m−2), were younger (median, 42 vs. 52 years), primarily women (84.3 vs. 58.2%), commercially insured (70.1 vs. 50.4%) and had more frequent use of antidepressants (30.8 vs. 14.1%) and non‐steroidal anti‐inflammatory drugs (21.7 vs. 12.0%) than those who did not at baseline (all P values < 0.0001).
Conclusions
Few eligible patients received pharmacotherapy for weight loss. Patients who received pharmacotherapy tended to be heavier, younger, female, commercially insured, and used more antidepressants and non‐steroidal anti‐inflammatory drugs.
Keywords: Patient characteristics, pharmacotherapy for weight loss, real‐world data
Introduction
Obesity affects one‐third (34.9%) of adults in the USA 1. Obesity is associated with an increased risk of a variety of diseases, including type 2 diabetes, dyslipidemia, hypertension, sleep apnea, osteoarthritis, cardiovascular disease and respiratory diseases 2, as well as several types of cancers 3. Obesity also poses a high economic burden on society, with medical costs associated with obesity totaling approximately $147bn per year in the USA 4.
The primary approach for obesity management and control is a change in lifestyle, but the benefits of pharmacotherapy for weight loss also have been demonstrated in clinical trials 5, 6. The combined use of lifestyle modification and pharmacotherapy may work better in achieving clinically meaningful weight‐loss goal 7. According to the 2013 American Heart Association/American College of Cardiology/The Obesity Society guidelines 2, pharmacotherapy as an adjunctive treatment to comprehensive lifestyle changes may be an option for motivated patients with a body mass index (BMI) ≥30 kg m−2 or ≥27 kg m−2 with ≥1 obesity‐associated comorbidity. However, data are limited on the characteristics of real‐world patients eligible for adjunctive pharmacotherapy and the predictors of adjunctive pharmacotherapy use. Such data may help develop effective strategies for weight‐loss management and control. An analysis was thus conducted to describe the characteristics of real‐world patients potentially eligible for adjunctive pharmacotherapy for weight loss and to identify the predictors of adjunctive pharmacotherapy use in the primary care setting in the USA.
Methods
Study population
A retrospective analysis was conducted using data from the GE Centricity® database, a de‐identified longitudinal ambulatory care electronic medical record database with approximately 38 million patient records mainly from primary care providers in 49 states and Washington, DC, in the USA. At the time of the analysis, data were available through 30 September 2013. The distribution of age, gender and race in this database is generally similar to the US population.
Patients with BMI records were identified between 1 October 2002 and 30 September 2011 (index period). Patients were eligible if they had a BMI ≥30 kg m−2 or BMI ≥27 to <30 kg m−2 with ≥1 obesity‐associated comorbidity (hypertension, dyslipidemia, or type 2 diabetes); were aged ≥18 years at the index date; had ≥12 months of continuous enrollment before and on the index date (baseline period) and had ≥12 months of continuous follow‐up after the index date. The index date was defined as the date of the first BMI value of ≥30 kg m−2 or BMI ≥27 to <30 kg m−2 with ≥1 obesity‐associated comorbidity recorded during the index period. For patients with BMI values of both ≥30 kg m−2 and BMI ≥27 to <30 kg m−2 with ≥1 obesity‐associated comorbidity, BMI of ≥30 kg m−2 took precedence. Patients' records with extreme values of height (<3 or ≥8 ft), weight (<50 or ≥650 Ib), or BMI (<12 or ≥100 kg m−2), or with extreme laboratory values were excluded from the analysis.
Study covariates
Patient characteristics included demographic variables collected at index (age, gender, race, geographic region and insurance); anthropometric and lifestyle variables within 12 months prior to or on the index date (weight [kg], BMI [weight in kg/height in m2] and smoking status); comorbid conditions within 12 months before or on the index date (hypertension, dyslipidemia, depression, anxiety, sleep apnea, gastroesophageal reflux disease [GERD] and asthma); comorbid conditions any time before or on the index date (type 2 diabetes, osteoarthritis, coronary heart disease, congestive heart failure, cardiac dysrhythmia, stroke, chronic kidney disease and chronic obstructive pulmonary disease); comedications within 12 months before or on the index date (anti‐diabetic drugs, anti‐hypertensive drugs, lipid‐lowering drugs, antidepressants, non‐steroidal anti‐inflammatory drugs [NSAIDs] and weight‐loss drugs); and metabolic markers within 12 months before or on the index date (glycated haemoglobin [HbA1C], glucose, triglycerides, total cholesterol, low‐density lipoprotein cholesterol, high‐density lipoprotein cholesterol, systolic blood pressure, diastolic blood pressure and high‐sensitivity C‐reactive protein). Comorbid conditions were defined according to ICM‐9‐CM codes, medication use, or laboratory results using ICD‐9‐CM codes or algorithms from published studies and clinical guidelines (Table S1).
Study outcomes
The outcome variable for this analysis was the prescription of pharmacotherapy for weight loss within 12 months after the index date. Weight‐loss drugs that were considered included benzphetamine, diethylpropion, orlistat, phendimetrazine, phentermine, sibutramine, lorcaserin and phentermine/topiramate. Bupropion/naltrexone and liraglutide 3.0 mg were not considered in this analysis, as they were approved in 2014, which was outside of the study period.
Statistical analysis
Patient characteristics were analysed using descriptive statistics in the overall study population and were stratified by the use of pharmacotherapy for weight loss within 12 months after the index date. Tests for differences between patients who received pharmacotherapy (the treated group) and those who did not receive pharmacotherapy (the untreated group) were performed using a chi‐square test or the Fisher's exact test for comparing the frequencies of categorical variables, and the Wilcoxon rank‐sum test for comparing the median values of continuous variables between these two groups. For variables with unknown, undetermined, not entered, or missing data, only non‐missing values were included in tests for statistical significance.
To identify patient characteristics at baseline predictive of the use of pharmacotherapy for weight loss, a logistic regression analysis was conducted to estimate the odds ratios and their 95% confidence intervals with the inclusion of the following variables: BMI categories at index (≥27 to <30 with hypertension, dyslipidemia, or type 2 diabetes, ≥30 to <35, ≥35 to <40, ≥40 kg m−2), age at index (18–34, 35–49, 50–64, ≥65 years), gender (male, female, unknown), race (white, black or African American, Hispanic, Asian, American Indian/multi/other, unknown/undetermined/not entered/missing), region (Midwest, Northeast, South, West), insurance (commercial, Medicare, Medicare [others], Medicaid, self‐pay, Tricare/Railroad/United Mine Workers, unknown/missing), smoking status (no, yes), hypertension (no, yes), dyslipidemia (no, yes), type 2 diabetes (no, yes), osteoarthritis (no, yes), coronary heart disease (no, yes), congestive heart failure (no, yes), cardiac dysrhythmia (no, yes), stroke (no, yes), chronic kidney disease (no, yes), depression (no, yes), anxiety (no, yes), sleep apnea (no, yes), GERD (no, yes), chronic obstructive pulmonary disease (no, yes), asthma (no, yes), anti‐diabetic drugs (no, yes), anti‐hypertensive drugs (no, yes), lipid‐lowering drugs (no, yes), antidepressants (no, yes), NSAIDs (no, yes) and weight‐loss drugs (no, yes). A backward stepwise selection procedure was used to identify the variables for the final multivariable model, and the variables with P values of > 0.05 were excluded from the model.
All tests were two‐sided, and data were analyzed using sas software, version 9.2 (SAS Institute, Cary, NC, USA).
Results
A total of 25,704,135 patients had BMI measurements at any time in the database, and 1,835,541 patients were included in the analysis after the application of the inclusion and exclusion criteria (Figure 1). The median BMI value of patients at index was 31.3 kg m−2 (Table 1); 20% of patients had a BMI of ≥27 to <30 kg m−2 with hypertension, dyslipidemia, or type 2 diabetes; 55% of patients had a BMI of ≥30 to <35 kg m−2; 15% of patients had a BMI of ≥35 to <40 kg m−2; and 11% of patients had a BMI of ≥40 kg m−2 (Figure 1). Of the study population, 58.3% were women and the mean baseline age of patients was 51.8 ± 16.5 years. Comorbidities were common (hypertension [55.4%], dyslipidemia [36.1%], and type 2 diabetes [13.4%]) and the use of concomitant medications was also common (anti‐hypertensive drugs [19.3%], lipid‐lowering drugs [17.9%], antidepressants [14.2%], NSAIDs [12.1%] and anti‐diabetic drugs [7.8%]) at baseline. However, the use of weight‐loss drugs at baseline was rare (0.6%).
Figure 1.
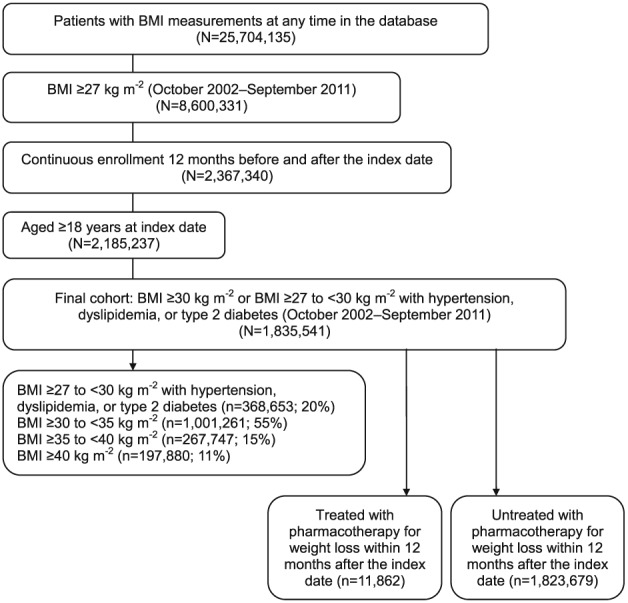
Flow diagram of study population selection.
Table 1.
Characteristics of patients potentially eligible for pharmacotherapy for weight loss
| Characteristic* | Overall (n = 1,835,541) | Treated with pharmacotherapy for weight loss within 12 months after the index date (n = 11,862) | Untreated with pharmacotherapy for weight loss within 12 months after the index date (n = 1,823,679) | P value† |
|---|---|---|---|---|
| Weight at index, kg | ||||
| Median (25th, 75th percentile) | 90.7 (80.7, 103.0) | 93.4 (83.0, 110.0) | 90.7 (80.7, 103.0) | <0.0001 |
| Body mass index at index, kg m−2 | ||||
| Median (25th, 75th percentile) | 31.3 (30.1, 35.1) | 33.6 (30.8, 39.2) | 31.3 (30.1, 35.1) | <0.0001 |
| Body mass index categories at index, n (%) | <0.0001 | |||
| ≥27 to <30 kg m−2 with hypertension, dyslipidemia, or type 2 diabetes | 368,653 (20.1) | 752 (6.3) | 367,901 (20.2) | |
| ≥30 to <35 kg m−2 | 1,001,261 (54.5) | 6099 (51.4) | 995,162 (54.6) | |
| ≥35 to <40 kg m−2 | 267,747 (14.6) | 2364 (19.9) | 265,383 (14.6) | |
| ≥40 kg m−2 | 197,880 (10.8) | 2647 (22.3) | 195,233 (10.7) | |
| Age at index, years | ||||
| Median (25th, 75th percentile) | 52.0 (40.0, 64.0) | 42.0 (33.0, 51.0) | 52.0 (40.0, 65.0) | <0.0001 |
| Age groups at index, n (%) | <0.0001 | |||
| 18–34 years | 323,882 (17.7) | 3589 (30.3) | 320,293 (17.6) | |
| 35–49 years | 479,923 (26.2) | 4753 (40.1) | 475,170 (26.1) | |
| 50–64 years | 573,802 (31.3) | 2863 (24.1) | 570,939 (31.3) | |
| ≥65 years | 457,934 (25.0) | 657 (5.5) | 457,277 (25.1) | |
| Gender, n (%)‡ | <0.0001 | |||
| Male | 764,624 (41.7) | 1860 (15.7) | 762,764 (41.8) | |
| Female | 1,070,719 (58.3) | 10,001 (84.3) | 1,060,718 (58.2) | |
| Race, n (%)‡ | <0.0001 | |||
| White | 1,056,812 (85.3) | 7363 (85.5) | 1,049,449 (85.3) | |
| Black or African American | 132,366 (10.7) | 932 (10.8) | 131,434 (10.7) | |
| Hispanic | 19,334 (1.6) | 167 (1.9) | 19,167 (1.6) | |
| Asian | 12,119 (1.0) | 58 (0.7) | 12,061 (1.0) | |
| American Indian/multi/other | 18,150 (1.5) | 90 (1.1) | 18,060 (1.5) | |
| Region, n (%) | <0.0001 | |||
| Midwest | 475,237 (25.9) | 3057 (25.8) | 472,180 (25.9) | |
| Northeast | 502,212 (27.4) | 1888 (15.9) | 500,324 (27.4) | |
| South | 593,853 (32.4) | 5184 (43.7) | 588,669 (32.3) | |
| West | 264,239 (14.4) | 1733 (14.6) | 262,506 (14.4) | |
| Insurance, n (%)‡ | <0.0001 | |||
| Commercial | 595,161 (50.5) | 4642 (70.1) | 590,519 (50.4) | |
| Medicare | 455,333 (38.6) | 1264 (19.1) | 454,069 (38.7) | |
| Medicare (others§) | 50,201 (4.3) | 168 (2.5) | 50,033 (4.3) | |
| Medicaid | 35,262 (3.0) | 306 (4.6) | 34,956 (3.0) | |
| Self‐pay | 36,630 (3.1) | 213 (3.2) | 36,417 (3.1) | |
| Tricare/Railroad/United Mine Workers | 6,903 (0.6) | 28 (0.4) | 6,875 (0.6) | |
| Smokers, n (%) | 78,493 (4.3) | 524 (4.4) | 77,969 (4.3) | 0.44║ |
| Comorbid conditions at baseline, n (%) | ||||
| Hypertension | 1,016,290 (55.4) | 5688 (48.0) | 1,010,602 (55.4) | <0.0001║ |
| Dyslipidemia | 663,015 (36.1) | 3765 (31.7) | 659,250 (36.2) | <0.0001║ |
| Type 2 diabetes¶ | 246,539 (13.4) | 1382 (11.7) | 245,157 (13.4) | <0.0001║ |
| Osteoarthritis¶ | 166,869 (9.1) | 903 (7.6) | 165,966 (9.1) | <0.0001║ |
| Coronary heart disease¶ | 62,024 (3.4) | 121 (1.0) | 61,903 (3.4) | <0.0001║ |
| Congestive heart failure¶ | 35,274 (1.9) | 73 (0.6) | 35,201 (1.9) | <0.0001║ |
| Cardiac dysrhythmia¶ | 89,946 (4.9) | 216 (1.8) | 89,730 (4.9) | <0.0001║ |
| Stroke¶ | 46,299 (2.5) | 89 (0.8) | 46,210 (2.5) | <0.0001║ |
| Chronic kidney disease¶ | 47,429 (2.6) | 100 (0.8) | 47,329 (2.6) | <0.0001║ |
| Depression | 51,161 (2.8) | 821 (6.9) | 50,340 (2.8) | <0.0001║ |
| Anxiety | 55,365 (3.0) | 605 (5.1) | 54,760 (3.0) | <0.0001║ |
| Sleep apnea | 29,984 (1.6) | 260 (2.2) | 29,724 (1.6) | <0.0001║ |
| Gastroesophageal reflux disease | 88,902 (4.8) | 652 (5.5) | 88,250 (4.8) | 0.001║ |
| Chronic obstructive pulmonary disease¶ | 66,517 (3.6) | 253 (2.1) | 66,264 (3.6) | <0.0001║ |
| Asthma | 44,404 (2.4) | 390 (3.3) | 44,014 (2.4) | <0.0001║ |
| Comedications at baseline, n (%) | ||||
| Anti‐hypertensive drugs | 354,797 (19.3) | 1918 (16.2) | 352,879 (19.4) | <0.0001║ |
| Lipid‐lowering drugs | 328,846 (17.9) | 1540 (13.0) | 327,306 (18.0) | <0.0001║ |
| Anti‐diabetic drugs | 143,000 (7.8) | 1074 (9.1) | 141,926 (7.8) | <0.0001║ |
| Antidepressants | 260,142 (14.2) | 3653 (30.8) | 256,489 (14.1) | <0.0001║ |
| Non‐steroidal anti‐inflammatory drugs | 221,356 (12.1) | 2579 (21.7) | 218,777 (12.0) | <0.0001║ |
| Weight‐loss drugs | 10,685 (0.6) | 4474 (37.7) | 6211 (0.3) | <0.0001 |
| Metabolic markers at baseline‡ | ||||
| Glycated haemoglobin, % | ||||
| n | 224,683 | 1,332 | 223,351 | |
| Median (25th, 75th percentile) | 6.5 (5.9, 7.6) | 6.3 (5.7, 7.4) | 6.5 (5.9, 7.6) | <0.0001 |
| Glucose, mg dL−1 | ||||
| n | 68,956 | 474 | 68,482 | |
| Median (25th, 75th percentile) | 100 (91, 118) | 97.5 (89, 111) | 100 (91, 118) | 0.001 |
| Triglycerides, mg dL−1 | ||||
| n | 442,186 | 2786 | 439,400 | |
| Median (25th, 75th percentile) | 134 (94, 192) | 139 (96, 197) | 134 (94, 192) | 0.03 |
| Total cholesterol, mg dL−1 | ||||
| n | 670,077 | 4149 | 665,928 | |
| Median (25th, 75th percentile) | 190 (164, 219) | 197 (173, 226) | 190 (163, 219) | <0.0001 |
| Low‐density lipoprotein cholesterol, mg dL−1 | ||||
| n | 487,835 | 3123 | 484,712 | |
| Median (25th, 75th percentile) | 111 (88, 136) | 117 (94, 140) | 111 (88, 136) | <0.0001 |
| High‐density lipoprotein cholesterol, mg dL−1 | ||||
| n | 648,504 | 3923 | 644,581 | |
| Median (25th, 75th percentile) | 47 (39, 57) | 49 (41, 59) | 47 (39, 57) | <0.0001 |
| Systolic blood pressure, mmHg | ||||
| n | 1,759,558 | 11,753 | 1,747,805 | |
| Median (25th, 75th percentile) | 128 (120, 140) | 124 (117, 134) | 128 (120, 140) | <0.0001 |
| Diastolic blood pressure, mmHg | ||||
| n | 1,758,964 | 11,752 | 1,747,212 | |
| Median (25th, 75th percentile) | 80 (70, 84) | 80 (72, 84) | 80 (70, 84) | 0.11 |
| High‐sensitivity C‐reactive protein, mg L−1 | ||||
| n | 2944 | 13 | 2931 | |
| Median (25th, 75th percentile) | 3.8 (1.4, 10.6) | 4.0 (1.7, 16.1) | 3.8 (1.4, 10.6) | 0.82 |
| Bariatric surgery,¶, # n (%) | 1869 (0.1) | 16 (0.1) | 1853 (0.1) | 0.25 |
Within 12 months before or on the index date except as noted.
P values were from the chi‐square test or Fisher's exact test for comparing the frequencies of categorical variables between the treated group and the untreated group, and from the Wilcoxon rank‐sum test for comparing the median values of continuous variables between the two groups. For variables with unknown, undetermined, not entered, or missing data, only those with values were included in tests for statistical significance.
Including only non‐missing data.
Including Medicare part A, part C, private, or supplemental insurance.
Fisher's exact test.
Any time before or on the index date.
Within 12 months after the index date.
There were also few patients who received pharmacotherapy for weight loss within 12 months after the index date (0.7%; n = 11,862). The percentage of patients who received pharmacotherapy within 12 months after the index date increased with increasing baseline BMI categories (Figure 2). Among patients who received pharmacotherapy within 12 months after the index date, phentermine was the most frequently prescribed weight‐loss drug (62.9%), followed by orlistat (19.1%), sibutramine (14.7%), phendimetrazine (1.8%), diethylpropion (1.3%) and benzphetamine (0.2%). Lorcaserin and phentermine/topiramate, which were approved in the summer of 2012 (slightly overlapping with the study period), were not present in this analysis.
Figure 2.
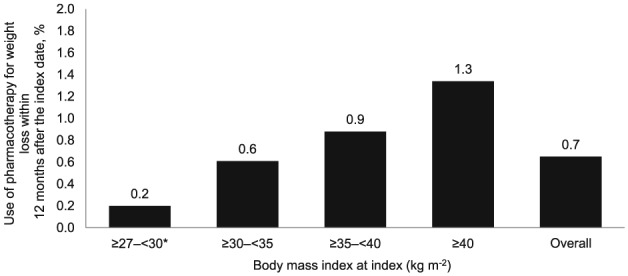
Use of pharmacotherapy for weight loss within 12 months after the index date among patients potentially eligible for pharmacotherapy for weight loss. Note: *BMI ≥27 to <30 kg m−2 (overweight) with ≥1 obesity‐associated comorbidity (hypertension, dyslipidemia, or type 2 diabetes).
Compared with those who did not receive pharmacotherapy for weight loss within 12 months after the index date, patients who received treatment were predominantly female (84.3% vs. 58.2%), heavier (median BMI, 33.6 vs. 31.3 kg m−2), approximately 10 years younger (median age, 42 vs. 52 years), more commercially insured (70.1% vs. 50.4%) and were more likely to live in the Southern region of the USA (43.7% vs. 32.3%) at baseline (all P values < 0.0001) (Table 1). The percentage of female patients decreased with increasing baseline BMI categories among patients who received pharmacotherapy, but increased with increasing baseline BMI categories among those who did not receive pharmacotherapy (Figure 3a). Patients who received pharmacotherapy were younger than their counterparts who did not receive pharmacotherapy, and this trend was observed across all baseline BMI categories (Figure 3b).
Figure 3.
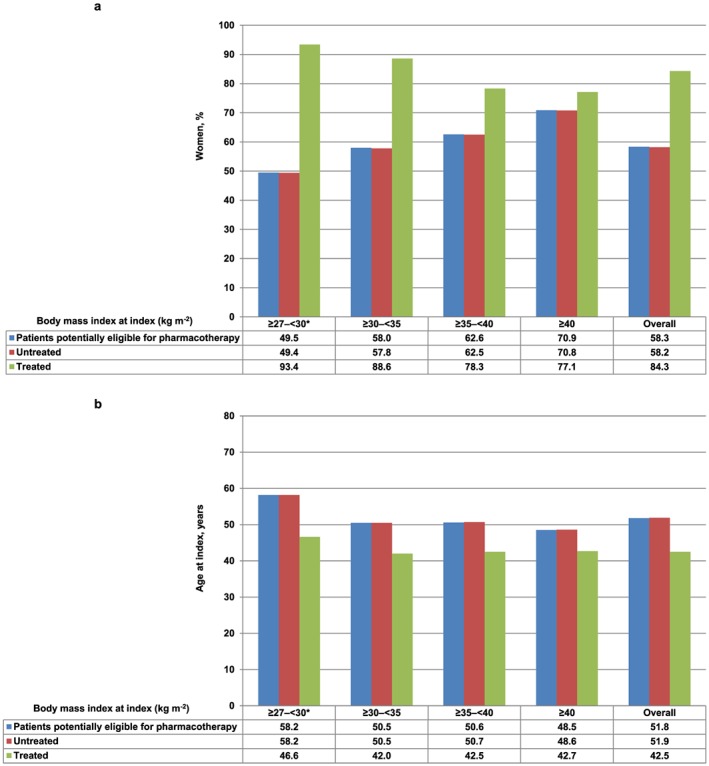
Gender and age distribution of patients potentially eligible for pharmacotherapy for weight loss, a. Gender distribution of patients, b. Mean age at index of patients. Note: *BMI ≥27 to <30 kg m−2 (overweight) with ≥1 obesity‐associated comorbidity (hypertension, dyslipidemia, or type 2 diabetes).
Moreover, patients who received pharmacotherapy for weight loss within 12 months after the index date had a relatively lower percentage of hypertension, dyslipidemia, type 2 diabetes, osteoarthritis, cardiovascular diseases (coronary heart disease, congestive heart failure, cardiac dysrhythmia and stroke), chronic kidney disease and chronic obstructive pulmonary disease, but had a higher percentage of depression, anxiety, sleep apnea, GERD and asthma at baseline (all P values < 0.0001 except for GERD [P = 0.001]) (Table 1). Additionally, at baseline, these patients received relatively fewer anti‐hypertensive drugs and lipid‐lowering drugs, but slightly more anti‐diabetic medications (all P values < 0.0001). Further, use of antidepressants (30.8% vs. 14.1%), NSAIDs (21.7% vs. 12.0%) and weight‐loss drugs (37.7% vs. 0.3%) at baseline was markedly higher in patients who received pharmacotherapy for weight loss within 12 months after the index date than those who did not (all P values < 0.0001). Patients who received pharmacotherapy for weight loss within 12 months after the index date had slightly lower levels of HbA1C, glucose and systolic blood pressure, but slightly higher levels of triglycerides, total cholesterol, low‐density lipoprotein cholesterol and high‐density lipoprotein cholesterol at baseline (all P values < 0.0001 except for glucose [P = 0.001] and triglyceride [P = 0.03]).
In multivariable analysis using a backward stepwise selection procedure, baseline patient characteristics that were significantly associated with the use of pharmacotherapy for weight loss in the following 12 months (positively or negatively) included BMI, age, gender, race, region, insurance, dyslipidemia, depression, osteoarthritis, sleep apnea, type 2 diabetes, cardiovascular disease, chronic kidney disease, use of anti‐hypertensive drugs, anti‐diabetic drugs, antidepressants, NSAIDs, or weight‐loss drugs (Table 2). Use of weight‐loss drugs at baseline was the strongest predictor of future weight‐loss drug use – those who used weight‐loss drugs at baseline were 99 times more likely to use weight‐loss drugs in the next 12 months (Table 2).
Table 2.
Patient characteristics at baseline that were predictive of the use of pharmacotherapy for weight loss within 12 months after the index date in the multivariable logistic regression analysis
| Characteristic* | Odds ratio† | 95% confidence interval† | P value† |
|---|---|---|---|
| BMI categories at index, kg m−2 | |||
| ≥27 to <30 with hypertension, dyslipidemia, or type 2 diabetes | 0.51 | (0.47–0.56) | <0.0001 |
| ≥30 to <35 | 1.00 | ||
| ≥35 to <40 | 1.32 | (1.25–1.39) | <0.0001 |
| ≥40 | 1.56 | (1.48–1.65) | <0.0001 |
| Age groups at index, years | |||
| 18–34 | 1.00 | ||
| 35–49 | 0.83 | (0.79–0.88) | <0.0001 |
| 50–64 | 0.50 | (0.47–0.53) | <0.0001 |
| ≥65 | 0.22 | (0.20–0.25) | <0.0001 |
| Gender | |||
| Male | 1.00 | ||
| Female | 2.58 | (2.44–2.72) | <0.0001 |
| Unknown | 1.36 | (0.16–11.46) | 0.78 |
| Race | |||
| White | 1.00 | ||
| Black or African American | 0.75 | (0.69–0.81) | <0.0001 |
| Hispanic | 1.15 | (0.97–1.37) | 0.11 |
| Asian | 0.92 | (0.70–1.21) | 0.55 |
| American Indian/multi/other | 0.62 | (0.50–0.78) | <0.0001 |
| Unknown/undetermined/not entered/missing | 0.79 | (0.76–0.83) | <0.0001 |
| Region | |||
| Midwest | 1.00 | ||
| Northeast | 0.59 | (0.55–0.63) | <0.0001 |
| South | 1.21 | (1.15–1.27) | <0.0001 |
| West | 1.10 | (1.03–1.18) | 0.004 |
| Insurance | |||
| Commercial | 1.00 | ||
| Medicare | 0.74 | (0.69–0.80) | <0.0001 |
| Medicare (others‡) | 0.85 | (0.72–1.01) | 0.07 |
| Medicaid | 0.82 | (0.72–0.94) | 0.003 |
| Self‐pay | 0.67 | (0.58–0.78) | <0.0001 |
| Tricare/Railroad/United Mine Workers | 0.83 | (0.55–1.25) | 0.37 |
| Unknown/missing | 0.99 | (0.95–1.04) | 0.74 |
| Comorbid conditions at baseline, n (%) | |||
| Dyslipidemia | |||
| No | 1.00 | ||
| Yes | 1.18 | (1.12–1.24) | <0.0001 |
| Depression | |||
| No | 1.00 | ||
| Yes | 1.15 | (1.05–1.26) | 0.003 |
| Osteoarthritis§ | |||
| No | 1.00 | ||
| Yes | 1.11 | (1.02–1.20) | 0.01 |
| Sleep apnea | |||
| No | 1.00 | ||
| Yes | 1.44 | (1.25–1.66) | <0.0001 |
| Type 2 diabetes§ | |||
| No | 1.00 | ||
| Yes | 0.89 | (0.80–0.99) | 0.03 |
| Coronary heart disease§ | |||
| No | 1.00 | ||
| Yes | 0.73 | (0.60–0.89) | 0.002 |
| Congestive heart failure§ | |||
| No | 1.00 | ||
| Yes | 0.69 | (0.53–0.88) | 0.003 |
| Cardiac dysrhythmia§ | |||
| No | 1.00 | ||
| Yes | 0.77 | (0.67–0.90) | 0.0006 |
| Stroke§ | |||
| No | 1.00 | ||
| Yes | 0.74 | (0.59–0.92) | 0.006 |
| Chronic kidney disease§ | |||
| No | 1.00 | ||
| Yes | 0.78 | (0.63–0.96) | 0.02 |
| Comedications at baseline, n (%) | |||
| Anti‐hypertensive drugs | |||
| No | 1.00 | ||
| Yes | 1.07 | (1.00–1.13) | 0.04 |
| Anti‐diabetic drugs | |||
| No | 1.00 | ||
| Yes | 1.25 | (1.11–1.41) | 0.0002 |
| Antidepressants | |||
| No | 1.00 | ||
| Yes | 1.65 | (1.57–1.74) | <0.0001 |
| Non‐steroidal anti‐inflammatory drugs | |||
| No | 1.00 | ||
| Yes | 1.38 | (1.31–1.45) | <0.0001 |
| Weight‐loss drugs | |||
| No | 1.00 | ||
| Yes | 98.96 | (94.38–103.77) | <0.0001 |
Within 12 months before or on the index date except as noted.
Logistic regression was conducted with the inclusion of the variables for demographic and clinical characteristics at baseline, including BMI categories at index (≥27 to <30 with hypertension, dyslipidemia, or type 2 diabetes, ≥30 to <35, ≥35 to <40, ≥40 kg m−2), age at index (18–34, 35–49, 50–64, ≥65 years), gender (male, female, unknown), race (white, black or African American, Hispanic, Asian, American Indian/multi/other, unknown/undetermined/not entered/missing), region (Midwest, Northeast, South, West), insurance (commercial, Medicare, Medicare [others], Medicaid, self‐pay, Tricare/Railroad/United Mine Workers, unknown/missing), smoking status (no, yes), hypertension (no, yes), dyslipidemia (no, yes), type 2 diabetes (no, yes), osteoarthritis (no, yes), coronary heart disease (no, yes), congestive heart failure (no, yes), cardiac dysrhythmia (no, yes), stroke (no, yes), chronic kidney disease (no, yes), depression (no, yes), anxiety (no, yes), sleep apnea (no, yes), gastroesophageal reflux disease (no, yes), chronic obstructive pulmonary disease (no, yes), asthma (no, yes), anti‐diabetic drugs (no, yes), anti‐hypertensive drugs (no, yes), lipid‐lowering drugs (no, yes), antidepressants (no, yes), non‐steroidal anti‐inflammatory drugs (no, yes) and weight‐loss drugs (no, yes). A backward stepwise selection procedure was used to identify the variables for the final multivariable model, and the variables with P values of > 0.05 were excluded from the model. Use of pharmacotherapy for weight loss within 12 months after the index date (no, yes) was the outcome variable.
Including Medicare part A, part C, private, or supplemental insurance.
Any time before or on the index date
BMI, body mass index.
Discussion
In patients with overweight and ≥1 obesity‐associated comorbidity or with obesity (who were therefore potentially eligible for pharmacotherapy for weight loss) in the primary care setting in the USA, comorbidities were common; however, pharmacotherapy use for weight loss within 12 months after the index date was infrequent (0.7%). In this study, patients who received pharmacotherapy were heavier, younger, predominantly female and more commercially insured at baseline compared with those who did not receive pharmacotherapy. Among the comedications evaluated, patients who received pharmacotherapy for weight loss were more commonly on antidepressants, NSAIDs, or weight‐loss drugs, but were less frequently to have a personal history of cardiovascular disease or chronic kidney disease at baseline. Phentermine was the most frequently prescribed weight‐loss drug (62.9%) among those who were prescribed weight‐loss medications. Prior use of weight‐loss drugs was the strongest predictor of future weight‐loss drug use as measured within 12 months after the index date.
Data on the characteristics of real‐world patients eligible for weight‐loss drugs have been limited. Consistent with the present study using prescription data in a US primary care setting, data from two US national surveys have also indicated that the use of pharmacotherapy for weight loss among eligible patients is low 8, 9. In a retrospective cross‐sectional analysis of pharmacy data from the 2002–2007 US Medical Expenditure Panel Survey, only 0.61% of eligible patients used weight‐loss drugs 8. In another retrospective cross‐sectional analysis of self‐reported data from the 2007–2008 National Health and Nutrition Examination Survey, only 2.2% of eligible patients reported the use of prescription weight‐loss drugs, and 3.7% reported the use of non‐prescription weight‐loss drugs in the past year 9. Similarly, an analysis of US outpatient weight‐loss drug use using the Intercontinental Marketing Services (IMS) databases has shown that only approximately 2.74 million patients used weight‐loss drugs in the USA in 2011, with the majority of patients receiving phentermine (2.43 million; 89%) 10.
The low utilization of weight‐loss drugs among patients eligible for pharmacotherapy for weight loss in the USA could be ascribed to a number of factors, such as moderate weight‐loss effects, costs and limited insurance coverage for weight‐loss drugs and safety concerns. In clinical trials, when used with lifestyle interventions, weight‐loss drugs provided additional weight loss that ranged from approximately 3% to 9% of their initial weight at 1 year compared with placebo 6. However, the expectation for weight loss effects in patients is often higher 11. Although weight‐loss drugs significantly improve cardiovascular risk factors such as insulin sensitivity, glycemic control, dyslipidemia, hypertension and chronic inflammation in patients with overweight or obesity 12, 13, 14, 15, 16, these health benefits may not be immediately obvious to patients. Also, no weight‐loss drug has been demonstrated to decrease cardiovascular morbidity or mortality 6. Additionally, patients often prefer self‐management or over‐the‐counter options for weight control such as dietary changes, exercise, diet, or exercise weight‐loss programmes and dietary and herbal weight‐loss supplements 11. As mentioned previously, more patients who were eligible for pharmacotherapy reported the use of non‐prescription weight‐loss drugs (3.7%) than prescription weight‐loss drugs (2.2%) in the past year in the USA 9. Costs may also be a barrier, as most health plans in the USA provide limited or no coverage for weight‐loss drugs. The Medicare prescription drug programme, for example, does not cover weight‐loss drugs 17. An analysis by Hampp et al., found that weight‐loss drugs were mainly paid for with cash 10. As shown in this study and in the Hampp study 10, phentermine was the most prescribed weight‐loss medication in the USA. This may be due, at least in part, to its low cost and long clinical experience compared with other weight‐loss drugs 6, 10. Another contributing factor to the low utilization of pharmacotherapy for weight loss may be safety concerns, including the historical safety issues with weight‐loss drugs such as fenfluramine (part of the fen‐phen combination) 18.
This real‐world study in the primary care setting, along with randomized clinical trials 12, 13, 14, 15, 16 and other observational studies 8, 9, 10, have indicated that most users of prescription weight‐loss drugs were predominantly women of a relatively younger age than non‐users. This may be due, at least in part, to the fact that women, especially younger women, are more conscious of body weight, size and self‐image 19, 20, 21. The lower likelihood of pharmacotherapy use for weight loss in the elderly population might also be related to costs and the lack of Medicare coverage for weight‐loss drugs. This hypothesis is supported by the finding in this study, which showed that patients enrolled in Medicare were less likely to use pharmacotherapy for weight loss compared with patients who were commercially insured.
The relationship between obesity and depression has been suggested to be bidirectional – obesity leads to depression, and conversely, depression results in obesity 22. The present study has shown that antidepressant use was not uncommon in patients with overweight or obesity and those patients who used antidepressants or had depression were also more likely to use pharmacotherapy for weight loss. These findings further suggest that there is a complex relationship between obesity and depression.
Obesity and chronic pain often co‐exist 23. NSAIDs are commonly used for the management of chronic pain. Obesity has been shown to be associated with an increased risk of chronic pain, including low back pain, joint pain, headaches, fibromyalgia, widespread pain, abdominal pain, pelvic pain and neuropathic pain 23. Obesity is a risk factor of osteoarthritis and is also associated with the severity and progression of the disease 23, 24. Studies have shown that the frequency of chronic pain and osteoarthritis increases with increasing BMI 23, 24. In this study, the finding that patients with overweight or obesity who took NSAIDs were more likely to use pharmacotherapy for weight loss suggests that patients with chronic pain conditions might be more motivated to lose weight for reducing obesity‐associated chronic pain.
Obesity is strongly associated with an increased prevalence of sleep apnea 25, 26. Sleep apnea severely impairs health‐related quality of life 26. Weight loss has been shown to reduce the severity of sleep apnea 25, 26. The present study has shown that patients with overweight or obesity who had sleep apnea were more likely to use pharmacotherapy for weight loss, suggesting that patients with sleep apnea might be more motivated to lose weight to help control sleep apnea.
This study has several strengths, including a large sample size and the utilization of real‐world data from electronic medical records in the primary care setting. Additionally, there were little or no missing data on gender and age, two key covariates. However, this retrospective observational study also has some limitations. Although a multivariable analysis was performed to control for potential confounding of measured covariates, the residual confounding from confounders with measurement errors and the potential confounding by unmeasured covariates such as socioeconomic factors, use of non‐prescription weight‐loss medications and participation in dietary and physical activity programmes or time‐dependent covariates cannot be excluded. The missing‐indicator method was used for those covariates with missing data. The possibility that missing data in covariates might potentially influence the patterns of patient characteristics also cannot be excluded.
In summary, the findings from this large study suggest that few eligible patients in the primary care setting in the USA receive pharmacotherapy for weight loss. Patients who received pharmacotherapy tended to be heavier, younger, predominantly female, more commercially insured and used more antidepressants and NSAIDs than those who did not receive pharmacotherapy.
Conflict of Interest Statement
None
Funding
This study was supported by Takeda.
Disclosure
S. Z., S. M. and J. Y. are employees of Takeda. J. L. was an employee of Takeda at the time of the study.
Author contributions
S. Z. drafted the manuscript and designed the study. J. Y. conducted data analysis and contributed to study design. S. M. and J. L. contributed to data analysis. All authors contributed to data interpretation and had final approval of the submitted versions.
Supporting information
TABLE S1. Operational definitions of comorbid conditions
Supporting info item
Acknowledgements
Rx Communications provided medical writing assistance for the abstract and poster that were presented at ObesityWeek 2014.
Zhang, S. , Manne, S. , Lin, J. , and Yang, J. (2016) Characteristics of patients potentially eligible for pharmacotherapy for weight loss in primary care practice in the United States. Obesity Science & Practice, 2: 104–114. doi: 10.1002/osp4.46.
References
- 1. Ogden CL, Carroll MD, Kit BK, Flegal KM. Prevalence of childhood and adult obesity in the United States, 2011–2012. JAMA 2014; 311: 806–14. [DOI] [PMC free article] [PubMed] [Google Scholar]
- 2. Jensen MD, Ryan DH, Apovian CM, et al. 2013 AHA/ACC/TOS guideline for the management of overweight and obesity in adults: a report of the American College of Cardiology/American Heart Association Task Force on Practice Guidelines and The Obesity Society. Circulation 2014; 129: S102–38. [DOI] [PMC free article] [PubMed] [Google Scholar]
- 3. Byers T, Sedjo RL. Body fatness as a cause of cancer: epidemiologic clues to biologic mechanisms. Endocr Relat Cancer 2015; 22: R125–34. [DOI] [PubMed] [Google Scholar]
- 4. Finkelstein EA, Trogdon JG, Cohen JW, Dietz W. Annual medical spending attributable to obesity: payer‐and service‐specific estimates. Health Aff (Millwood) 2009; 28: w822–31. [DOI] [PubMed] [Google Scholar]
- 5. Patel D. Pharmacotherapy for the management of obesity. Metabolism 2015; 64: 1376–85. [DOI] [PubMed] [Google Scholar]
- 6. Yanovski SZ, Yanovski JA. Long‐term drug treatment for obesity: a systematic and clinical review. JAMA 2014; 311: 74–86. [DOI] [PMC free article] [PubMed] [Google Scholar]
- 7. Tsai AG, Wadden TA. Treatment of obesity in primary care practice in the United States: a systematic review. J Gen Intern Med 2009; 24: 1073–9. [DOI] [PMC free article] [PubMed] [Google Scholar]
- 8. Mehta HB, Rajan SS, Aparasu RR, Johnson ML. Application of the nonlinear Blinder–Oaxaca decomposition to study racial/ethnic disparities in antiobesity medication use in the United States. Res Social Adm Pharm 2013; 9: 13–26. [DOI] [PubMed] [Google Scholar]
- 9. Samaranayake NR, Ong KL, Leung RY, Cheung BM. Management of obesity in the National Health and Nutrition Examination Survey (NHANES), 2007–2008. Ann Epidemiol 2012; 22: 349–53. [DOI] [PubMed] [Google Scholar]
- 10. Hampp C, Kang EM, Borders‐Hemphill V. Use of prescription antiobesity drugs in the United States. Pharmacotherapy 2013; 33: 1299–307. [DOI] [PMC free article] [PubMed] [Google Scholar]
- 11. Baum C, Andino K, Wittbrodt E, Stewart S, Szymanski K, Turpin R. The challenges and opportunities associated with reimbursement for obesity pharmacotherapy in the USA. Pharmacoeconomics 2015; 33: 643–53. [DOI] [PMC free article] [PubMed] [Google Scholar]
- 12. Smith SR, Weissman NJ, Anderson CM, et al. Multicenter, placebo‐controlled trial of lorcaserin for weight management. N Engl J Med 2010; 363: 245–56. [DOI] [PubMed] [Google Scholar]
- 13. Greenway FL, Fujioka K, Plodkowski RA, et al. Effect of naltrexone plus bupropion on weight loss in overweight and obese adults (COR‐I): a multicentre, randomised, double‐blind, placebo‐controlled, phase 3 trial. Lancet 2010; 376: 595–605. [DOI] [PubMed] [Google Scholar]
- 14. Wadden TA, Foreyt JP, Foster GD, et al. Weight loss with naltrexone SR/bupropion SR combination therapy as an adjunct to behavior modification: the COR‐BMOD trial. Obesity (Silver Spring) 2011; 19: 110–20. [DOI] [PMC free article] [PubMed] [Google Scholar]
- 15. Garvey WT, Ryan DH, Look M, et al. Two‐year sustained weight loss and metabolic benefits with controlled‐release phentermine/topiramate in obese and overweight adults (SEQUEL): a randomized, placebo‐controlled, phase 3 extension study. Am J Clin Nutr 2012; 95: 297–308. [DOI] [PMC free article] [PubMed] [Google Scholar]
- 16. Apovian CM, Aronne L, Rubino D, et al. A randomized, phase 3 trial of naltrexone SR/bupropion SR on weight and obesity‐related risk factors (COR‐II). Obesity (Silver Spring) 2013;21:935–43. [DOI] [PMC free article] [PubMed] [Google Scholar]
- 17. Part D / Prescription Drug Benefits . Center for Medicare Advocacy. http://www.medicareadvocacy.org/medicare‐info/medicare‐part‐d/#covered drugs. Accessed 11 September 2015.
- 18. U.S. Food and Drug Administration . FDA announces withdrawal fenfluramine and dexfenfluramine (fen‐phen). In: Postmarket Drug Safety Information for Patients and Providers. Date created: September 15, 1997; last update: July 7, 2005. http://www.fda.gov/Drugs/DrugSafety/PostmarketDrugSafetyInformationforPatientsandProviders/ucm179871.htm. Accessed 26 July 2015.
- 19. Blake CE, Hebert JR, Lee DC, et al. Adults with greater weight satisfaction report more positive health behaviors and have better health status regardless of BMI. J Obes 2013; 2013: 291371. [DOI] [PMC free article] [PubMed] [Google Scholar]
- 20. Schwartz MB, Brownell KD. Obesity and body image. Body Image 2004; 1: 43–56. [DOI] [PubMed] [Google Scholar]
- 21. Anderson LA, Eyler AA, Galuska DA, Brown DR, Brownson RC. Relationship of satisfaction with body size and trying to lose weight in a national survey of overweight and obese women aged 40 and older, United States. Prev Med 2002; 35: 390–6. [DOI] [PubMed] [Google Scholar]
- 22. Preiss K, Brennan L, Clarke D. A systematic review of variables associated with the relationship between obesity and depression. Obes Rev 2013; 14: 906–18. [DOI] [PubMed] [Google Scholar]
- 23. Okifuji A, Hare BD. The association between chronic pain and obesity. J Pain Res 2015; 8: 399–408. [DOI] [PMC free article] [PubMed] [Google Scholar]
- 24. Sowers MR, Karvonen‐Gutierrez CA. The evolving role of obesity in knee osteoarthritis. Curr Opin Rheumatol 2010; 22: 533–7. [DOI] [PMC free article] [PubMed] [Google Scholar]
- 25. Schwartz AR, Patil SP, Laffan AM, Polotsky V, Schneider H, Smith PL. Obesity and obstructive sleep apnea: pathogenic mechanisms and therapeutic approaches. Proc Am Thorac Soc 2008; 5: 185–92. [DOI] [PMC free article] [PubMed] [Google Scholar]
- 26. Lurie A. Obstructive sleep apnea in adults: epidemiology, clinical presentation, and treatment options. Adv Cardiol 2011; 46: 1–42. [DOI] [PubMed] [Google Scholar]
Associated Data
This section collects any data citations, data availability statements, or supplementary materials included in this article.
Supplementary Materials
TABLE S1. Operational definitions of comorbid conditions
Supporting info item