

Abstract
We report Co‐free, Li‐rich Li1+xNi0.5Mn1.5O4 (0<x<1) compounds as high‐voltage and high‐capacity cathode materials for Li‐ion cells. Their tailored morphology allows high density and facile processability for electrode development. In the potential range 2.4–4.9 V, the cathode material of composition Li1.5Ni0.5Mn1.5O4 shows excellent performance in terms of capacity and cycling stability in half‐cells. In addition, for the first time, we demonstrate the application of the high‐voltage and high‐capacity cathode in full Li‐ion cells with graphite anodes with very high cycling stability. The electrochemical performance and low cost of the cathode material, together with the feasibility of a chemical method to obtain Li‐rich Li1+xNi0.5Mn1.5O4 (0<x<1), make practical applications of high‐energy density Li‐ion batteries possible.
Keywords: electrochemistry, energy transfer, lithium-ion battery, manganese, synthesis design
Introduction
The development of reasonable‐cost power sources for large‐scale electric transportation is becoming increasingly important for economic and ecological reasons. Li‐ion batteries (LiBs) are the most promising energy‐storage systems for electric vehicles (EVs) and hybrid plug‐in electric vehicles (HPEVs).1, 2 However, further improvements to the currently available LiB technology are needed to meet the requirements for automotive applications. Enhanced energy density, increased safety and reduced cost are key requirements. In state‐of‐the‐art LiBs, the main limiting factor in terms of energy density is the active cathode material. Both the cathode operating voltage (V) and capacity (A h kg−1) determine the energy density (W h kg−1) of the cell. Standard cathodes [LiNi1−x−yMnxCoyO2 (NMC), LiNi1−x−yCoxAlyO2 (NCA), LiFePO4 (LFP)] operate at potentials below 4.2 V versus Li+/Li with limited capacity. Moreover, at the full Li‐ion cell level, the cathode capacity is further reduced due to the formation of the solid electrolyte interface (SEI) on standard graphite‐based anodes. This leads to irreversible Li consumption during the first cycle. Therefore, cathode materials with either increased specific capacity or increased working potential with respect to those of the currently used active materials are necessary to improve energy density.3, 4, 5 Additionally, the cathode materials currently proposed for high‐energy‐density applications contain cobalt, which is highly toxic and expensive. The substitution of Co with more accessible elements is the key to the cost reduction required for large‐scale applications.
Here, we describe a series of Co‐free, Li‐rich Li1+xNi0.5Mn1.5O4 cathode materials with high operating voltage and high capacity for LiB applications. To date, such structures have been obtained by discharging LiNi0.5Mn1.5O4 versus metallic Li at potentials below 3 V.6, 7, 8, 9, 10, 11 The Ni‐substituted spinel LiNi0.5Mn1.5O4 (LNMO) has been investigated widely as a cathode material for high‐voltage applications and showed very promising performance in the potential range 3.5–5 V. Intensive research efforts have been devoted to the study of the influence of the morphology and transition‐metal order on the electrochemical performance.12, 13, 14, 15, 16 The LNMO cathode shows a potential plateau at 4.7 V versus Li+/Li, which corresponds to the Ni2+/Ni4+ redox reaction, whereas Mn remains in the original 4+ oxidation state. The reversible extraction of one Li ion per formula unit leads to a theoretical specific capacity of 147 mA h g−1. Theoretically, further Li insertion is possible through the reduction of the Mn oxidation state from 4+ to 3+. The reduction of all Mn ions into the trivalent state would lead to a final composition of Li2.5NiII 0.5MnIII 1.5O4 with a theoretical specific capacity of 347 mA h g−1 and a specific energy higher than 1100 W h kg−1 versus Li+/Li. This value is far beyond those reported to date for layered oxides and Li–Mn‐rich materials. Nevertheless, the feasibility of Li1+xNi0.5Mn1.5O4 for practical applications in LiBs remains unexplored. One of the main limitations arises from the poor cycling stability observed if extra Li is inserted electrochemically in the LNMO structure at potentials below 3 V.6, 7, 8, 9, 10, 11 Only a few reports deal with the electrochemical behavior of Li1+xNi0.5Mn1.5O4 through the exploitation of both Ni and Mn redox activity. From a structural point of view, phase transitions from a cubic to tetragonal structure during lithiation to 2 V are commonly reported. The reversibility of those phase transitions depends on different factors including the final Li content, the cation ordering of the pristine spinel structure, and its morphology.6, 7, 8, 9, 10, 11 Generally, the specific capacity can be increased significantly by expanding the voltage operative window to low potentials but this is associated with rapid capacity fading.
Furthermore, to make Li1+xNi0.5Mn1.5O4 structures of technological interest, it is necessary to develop a suitable synthesis method. So far, the electrochemical insertion of Li into LNMO remains the only route to obtain Li1+xNi0.5Mn1.5O4. In this case, the anode provides the Li ions that are inserted into the original cathode structure during the reduction process. Although the electrochemical method allows relatively easy control of the amount of Li in Li1+xNi0.5Mn1.5O4, this approach is clearly not useful for practical applications in full Li‐ion cells. A full cell is assembled with a Li‐containing cathode and a Li‐free anode, and extra Li sources, such as metallic Li, are not available. The cathode provides all of the Li for reversible Li insertion/extraction reactions and irreversible SEI formation and should contain the maximum amount of Li in the pristine state for full capacity utilization. Therefore, the high specific capacity of Li‐rich Li1+xNi0.5Mn1.5O4 phases would be very attractive from a practical point of view if the active material could be prepared chemically. To date, synthesis routes for materials with Li1+xNi0.5Mn1.5O4 composition and suitable properties for large‐scale processing have not been reported. Amine et al. obtained Li2Ni0.5Mn1.5O4 through the chemical intercalation of a second Li ion into LiNi0.5Mn1.5O4 by using LiI in acetonitrile.17 However, the cycling behavior and stability involving the Ni and Mn redox reactions were not provided. To the best of our knowledge, the cycling of a chemically synthesized Li1+xNi0.5Mn1.5O4 over a wide capacity range has not been reported.
In the present work, we describe a series of Li‐rich phases with Li1+xNi0.5Mn1.5O4 (0<x<1) composition, which were obtained through a scalable, low‐temperature synthetic method. The material characteristics such as tap density, particle architecture, and size distribution are tailored to meet the requirements for large‐scale applications and allow easy processability during standard electrode manufacturing processes. The Li content is optimized to allow very stable cycling behavior in half‐cells with high‐voltage and high‐capacity performance. In the potential range 2.4 to 4.9 V, the cathode material with Li1.5Ni0.5Mn1.5O4 operates at two different potential plateaus with a specific capacity of 200 mA h g−1. Additionally, we demonstrate the first practical application of a Li‐rich Li1+xNi0.5Mn1.5O4 (0<x<1) cathode in full cells versus graphite anodes, and the cells show very promising stability for the development of next‐generation high‐energy Li‐ion batteries.
Results and Discussion
Li1+xNi0.5Mn1.5O4 samples, with x ranging between 0 and 1, were obtained successfully by the chemical method described in the Experimental Section. The Li content was adjusted by varying the ratio of the educts. The chemical lithiation method reported here allows the synthesis of the limit composition of Li2Ni0.5Mn1.5O4, in which the average Mn oxidation state is 3.3+. For all of the obtained samples, the experimental Li/Mn/Ni ratios obtained from chemical analysis are in good agreement with the nominal compositions.
The particle architecture of the synthetized materials was optimized to reach a tap density of 2.4 g cm−3. High tap densities are beneficial for obtaining close packing of the active material in the electrodes. SEM analysis of all samples was performed to investigate the influence of the lithiation process on the particle morphology. The insertion of Li is expected to produce volume expansion and lattice distortion, because the formation of MnIII ions and consequent Jahn–Teller distortion may lead to the formation of cracks or rupture the particles. SEM images of selected samples with different Li content, namely, LiNi0.5Mn1.5O4, Li1.44Ni0.5Mn1.5O4, Li1.88Ni0.5Mn1.5O4, and Li2Ni0.5Mn1.5O4 are shown in Figure 1. All of the materials present similar morphologies with spherical particles made of densely packed nanosized primary crystallites. No significant morphological differences between the samples were observed through SEM analysis. These images also reveal that the lithiation process does not affect the integrity of the particles. This suggests that the network of grain boundaries in the particles can buffer the volume expansion that occurs during Li insertion and prevent the formation of cracks. In this tailored particle architecture, the random orientation of the crystallites in the spheres allows anisotropic expansion to occur at the crystal level without affecting the grains. Therefore, such features are beneficial for high particle density and, at the same time, provide material integrity upon mechanical stress owing the high amount of Li ions inserted.
Figure 1.
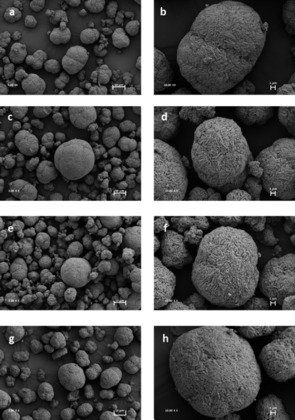
SEM images of samples of composition (a, b) LiNi0.5Mn1.5O4, (c, d) Li1.44Ni0.5Mn1.5O4, (e, f) Li1.88Ni0.5Mn1.5O4, and (g, h) Li2Ni0.5Mn1.5O4 at 3000× and 10 000× magnification.
The structures of the two end‐members of the series, LiNi0.5Mn1.5O4 and Li2Ni0.5Mn1.5O4, were investigated by selected‐area diffraction. The selected‐area electron diffraction patterns obtained from the LiNi0.5Mn1.5O4 and Li2Ni0.5Mn1.5O4 samples are shown in Figure 2 a and b, respectively. The diffraction patterns were indexed to the [1 0 0] orientation of the ordered cubic P4332 space group and the [0 1 0] zone axis of the tetragonal I41/amd, respectively. The superstructure of the ordered P4332 space group is apparent from the satellite spots in the diffraction pattern in Figure 2 a. The simulated electron diffraction patterns are displayed in Figure 2 c and d for the [1 0 0] ordered cubic and [0 1 0] tetragonal phases, respectively.
Figure 2.
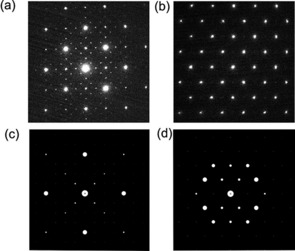
(a) Selected‐area electron diffraction pattern of LiNi0.5Mn1.5O4 in the [1 0 0] orientation as indexed to ordered cubic P4332. (b) Diffraction pattern of Li2Ni0.5Mn1.5O4. The pattern is indexed to the [0 1 0] zone axis of the tetragonal I41/amd. (c) Calculated electron diffraction patterns for the [1 0 0] orientation of the ordered cubic P4332. (d) Calculated electron diffraction pattern for the [0 1 0] zone axis of the tetragonal I41/amd.
The XRD patterns of the samples described above with different Li contents are shown in Figure 3. In good agreement with the TEM results, the sample with one Li ion per formula unit crystallizes in the cubic spinel structure. Two types of LiNi0.5Mn1.5O4 structures are possible: (1) an ordered structure with cubic primitive crystal symmetry (space group P4332), in which the Ni2+ and Mn4+ ions occupy 4b and 12d sites, respectively, and (2) a cation‐disordered structure with face‐centered cubic symmetry (space group Fd3m), in which the Ni2+ and Mn4+ ions occupy 16d positions randomly.18, 19
Figure 3.
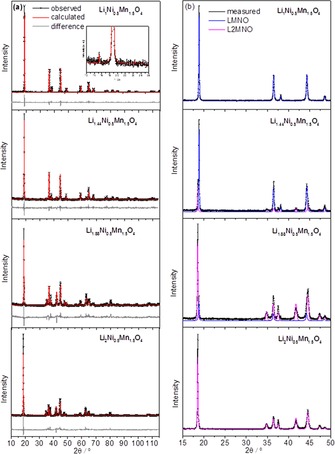
(a) XRD Rietveld refinement results and (b) phase identification of LiNi0.5Mn1.5O4, Li1.44Ni0.5Mn1.5O4, Li1.88Ni0.5Mn1.5O4, and Li2Ni0.5Mn1.5O4 samples.
The XRD analysis of the LiNi0.5Mn1.5O4 sample reported in Figure 3 shows superstructure reflections (the most pronounced at 2θ=15.3°, see inset in Figure 3 a) typical for highly ordered materials (space group P4332). The refinement indicates the presence of a single phase with no crystalline impurities, and the lattice parameter a=8.168 Å is in good agreement with the results reported previously.9, 18, 20 The XRD peaks of the Li2Ni0.5Mn1.5O4 sample were indexed to a tetragonal phase with I41/amd space group, and no evidence of the original cubic phase was observed. The diffractograms of the intermediate compositions show the presence of cubic and tetragonal phases. The reflections of the cubic phase become weaker with increasing Li content, and the relative intensity of the tetragonal phase increases (Figure 3 b). Therefore, the XRD analysis suggests that Li insertion by the chemical method leads to a structural conversion from the original cubic‐phase LiNi0.5Mn1.5O4 to tetragonal‐phase Li2Ni0.5Mn1.5O4 upon lithiation. No evidence of intermediate phases was observed.
The Rietveld refinement of the XRD data was performed to determine the formed phases, c/a ratios, and lattice parameters. The results, reported in Table 1, are consistent with the TEM results described above.
Table 1.
Structural evaluation and lattice parameters of samples with composition Li1+xNi0.5Mn1.5O4 (0≤x≤1).
| 1+x | R wp [a] | R b [b] | Crystalline phases | Space group | a [Å] | c [Å] |
|---|---|---|---|---|---|---|
| 1.00 | 19.1 | 4.3 | LiNi0.5Mn1.5O4 | P4332 | 8.168(2) | – |
| 1.44 | 23.9 | 5.6 7.5 | LiNi0.5Mn1.5O4 Li2Ni0.5Mn1.5O4 | P4332 I41/amd | 8.171(3) 5.742(2) | – 8.642(4) |
| 1.88 | 26.6 | 19.6 15.7 | LiNi0.5Mn1.5O4 Li2Ni0.5Mn1.5O4 | P4332 I41/amd | 8.175(3) 5.741(2) | – 8.632(5) |
| 2.00 | 26.1 | 8.8 | Li2Ni0.5Mn1.5O4 | I41/amd | 5.749(3) | 8.641(4) |
[a] R wp=weighted profile residue. [b] R b=Bragg residue.
The particles are micron‐sized spheres composed of grains with substructures of domains. The domain sizes, as calculated from XRD analysis, are (105±15) and (85±25) nm for LiNi0.5Mn1.5O4 and Li2Ni0.5Mn1.5O4, respectively. The values were obtained through integral‐breadth‐based LVol calculations (volume‐averaged column height from integral breadth; LVol‐IB) assuming intermediate crystallite size broadening modeled by a Voigt function.
Amine et al. reported Li2Ni0.5Mn1.5O4 obtained by chemical methods.17 However, they observed no structural differences between the pristine LNMO and the lithiated phase, both of which were identified as pure cubic spinel from XRD analysis. This result disagrees with the commonly reported evidence of structural changes upon electrochemical Li insertion, which is expected to produce lattice strain owing to the accommodation of the Li ions and the consequent structural expansions associated with the formation of the larger MnIII ions and the Jahn–Teller effect.
Our findings on the structural characterization of the Li‐rich phases Li1+xNi0.5Mn1.5O4 (0<x<1) are in good agreement with the phase evolution from cubic to tetragonal (I4 1/amd) reported in for the electrochemical lithiation of LNMO at low potentials.6, 7, 8, 9
To design Li1+xNi0.5Mn1.5O4 (0<x<1) compounds with optimized Li content for practical applications and to define the best operative conditions, the electrochemical behavior at low potentials was first studied through galvanostatic Li insertion into LiNi0.5Mn1.5O4. The discharge profile from 4.9 to 1.5 V versus Li is shown in Figure 4. The amount of inserted Li is calculated on the basis of the specific capacity of LiNi0.5Mn1.5O4.
Figure 4.
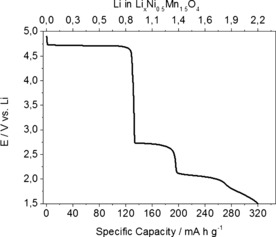
Galvanostatic discharge curve of LNMO‐based electrodes.
The low‐voltage region of the galvanostatic discharge curve exhibits two different voltage plateaus at approximately 2.7 and 2.1 V. This indicates that two electrochemical processes may occur during galvanostatic lithiation, the mechanism for which could be explained if it is assumed that two different phase transitions occur. However, the structural analysis of the Li‐rich phases Li1+xNi0.5Mn1.5O4 (0<x<1) did not reveal the formation of any intermediate phase. The XRD results show a single phase transition from cubic to tetragonal, and intermediate compositions are indexed as mixtures of the two phases, the relative amounts of which depend on the Li content. The two voltage plateaus at 2.7 and 2.1 V have been reported by several authors, although the electrochemical mechanism is not fully understood.8, 9 Further studies on the Li insertion/extraction mechanism at low potentials and on the appearance of the two low‐voltage plateaus will be the subject of a later communication.
In addition to the high‐voltage capacity of 135 mA h g−1 associated with the plateau at 4.7 V, the previously described plateaus at 2.7 and 2.1 V deliver 65 and 70 mA h g−1, respectively. A further 50 mA h g−1 can be obtained between 1.9 and 1.5 V. The total capacity gained between 1.5 and 4.9 V reaches a very high value of 320 mA h g−1. Nevertheless, the accommodation of high amounts of Li is expected to produce strain in the lattice and, thus, decrease the cycling stability upon continuous charge/discharge.8 The use of the first of the low‐voltage plateaus at 2.7 V with the lower‐potential cut‐off limited to 2.4 V would lead to a final capacity of approximately 200 mA h g−1. This in turn would minimize lattice distortions due to the Li insertion. Unexpectedly, the impact of the Li1+xNi0.5Mn1.5O4 cathode capacity on the overall energy density at a full‐cell level is comparably low, as shown in Table 2.
Table 2.
Theoretical energy density of Li1+xNi0.5Mn1.5O4 in half‐cells versus metallic Li and in full cells versus a graphite anode.[a]
| Potential window [V] | Average voltage [V] | Specific capacity [mA h gc −1] | Specific energy [W h kgc −1] | Percentage[b] [%] |
|---|---|---|---|---|
| Li1+xNi0.5Mn1.5O4 versus Li | ||||
| 4.9–1.5 | 3.23 | 320 | 1033 | 100 |
| 4.9–1.9 | 3.50 | 270 | 945 | 92 |
| 4.9–2.4 | 4.04 | 195 | 788 | 76 |
| HE‐NMC versus Li | ||||
| 4.8–2.0 | 3.55 | 250 | 880 | – |
| Li1+xNi0.5Mn1.5O4 versus graphite | ||||
| 4.9–1.5 | 3.03 | 167 | 506 | 100 |
| 4.9–1.9 | 3.30 | 152 | 503 | 99 |
| 4.9–2.4 | 3.84 | 125 | 480 | 95 |
| HE‐NMC versus graphite | ||||
| 4.8–2.0 | 3.35 | 250 | 489 | – |
[a] A reversible capacity of 350 mA h g−1 and a working potential of 0.2 V were assumed for the graphite anode. All potentials are versus Li+/Li. The calculations of the theoretical energy density for half‐cells and full cells of HE‐NMC are also reported for comparison. [b] Percentage of the specific energy assuming the value obtained in the full potential range cycling (1.5–4.9 V vs. Li/Li+) as 100%.
The capacity of Li1+xNi0.5Mn1.5O4 was calculated on the basis of the results reported in Figure 4, and the values obtained after each of the low‐voltage plateaus are also listed in Table 2. The average voltage was calculated as the ratio between the overall specific energy (W h kg−1) and the overall specific capacity (A h kg−1).
It is worth noting that the Li‐rich Li1+xNi0.5Mn1.5O4 cathode material can reach energy densities as high as those of high‐energy NMC (HE‐NMC). However, unlike HE‐NMC, it does not require an activation cycle and is Co‐free. This translates into lower cost, higher safety, and easier application in LiBs. From the capacity point of view, our calculations indicate that Li1+xNi0.5Mn1.5O4 cathode capacities beyond 200 mA h g−1, accessible by increasing the potential window, would not contribute significantly to increasing the overall energy density of the full cell. Therefore, the working potential window used to investigate the electrochemical performance of the synthetized Li‐rich samples was set as 2.4–4.9 V. As shown in Figure 4, the amount of Li inserted in this potential window is approximatively 1.5 ions per formula unit. Accordingly, we selected and tested the sample with a composition close to this value, namely, Li1.44Ni0.5Mn1.5O4. However, further Li can be provided in the pristine cathode structure as a charge reservoir to compensate the irreversible capacity loss (ICL) at the graphite anode for use in full cells. For this purpose, we additionally investigated a second Li‐rich phase with composition Li1.88Ni0.5Mn1.5O4. The cycling stability of electrodes made with these two materials was tested at a charge/discharge rate of 30 mA g−1 in the potential range 2.4–4.9 V. The recorded galvanostatic curves are reported in Figure 5. The capacities obtained during the first charges were 220 and 262 mA h g−1 for Li1.44Ni0.5Mn1.5O4 and Li1.88Ni0.5Mn1.5O4, respectively, on the basis of the weights of the nominal compositions. For both samples, the amount of Li extracted during the first oxidation corresponds to the value determined through chemical analysis. This confirms that all of the Li in the structure is electrochemically active. In good agreement with the previous results, Li extraction/insertion occurs at two different potential plateaus. The first one is the high‐voltage plateau at 4.7 V related to the NiII/NiIV redox reaction, which provides 130 mA h g−1 for all samples. The second voltage plateau occurs at 2.9 and 2.7 V in charge and discharge, respectively. The associated capacity depends on the amount of MnIII ions and, thus, of Li ions present in the structure. Indeed, the low‐voltage capacities are 43 and 98 mA h g−1 for Li1.44Ni0.5Mn1.5O4 and Li1.88Ni0.5Mn1.5O4, respectively. The sample of composition Li1.88Ni0.5Mn1.5O4 shows an irreversible capacity loss of 50 mA h g−1 during the first cycle. This excess of Li, which is not reinserted in the next discharge, can be utilized to compensate the ICL of the graphite. In the second cycle, both samples reached a reversible specific capacity of 220 mA h g−1 and high coulombic efficiency close to 100 %. No significant potential shifts owing to polarization effects were observed upon cycling. The cycling stability of Li1.44Ni0.5Mn1.5O4‐based electrodes is shown in Figure 6. These values are significantly beyond those reported previously. The higher stability can be ascribed mainly to the particle morphology, which is beneficial in the high‐voltage region by limiting the side reactions with the electrolyte.12, 13 Furthermore, the network of grain boundaries in the particles can buffer the volume changes in the low‐potential region and allow good contact to be maintained among the electrode components during cycling. The cathode material presented here offers a unique combination of characteristics in terms of morphology, particle size, and density as well as high‐capacity and high‐voltage performance.
Figure 5.
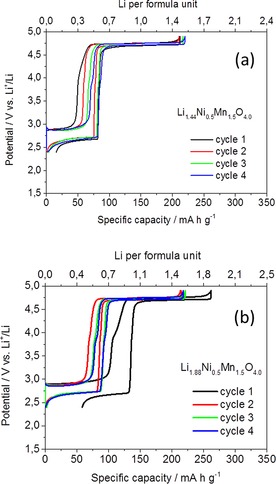
Galvanostatic charge/discharge profiles of electrodes based on Li‐rich compounds (a) Li1.44Ni0.5Mn1.5O4 and (b) Li1.88Ni0.5Mn1.5O4 (b). Charge/discharge current density 30 mA g−1.
Figure 6.
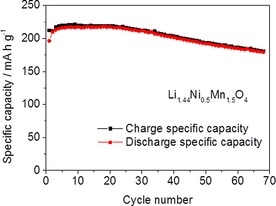
Charge/discharge specific capacity versus number of cycles for electrodes based on Li1.44Ni0.5Mn1.5O4 cycled between 2.4 and 4.9 V at 30 mA g−1.
The feasibility of the Li‐rich Li1+xNi0.5Mn1.5O4 structures as cathode materials versus graphite in full cells was also investigated. For this purpose, electrodes based on the Li‐rich material with composition Li1.5Ni0.5Mn1.5O4 were assembled versus a standard graphite‐based anode. It is worth noting that the electrode mass loadings are comparable to those of commercial electrodes for LiBs. The full cell was tested by continuous charge/discharge at a constant current density of 30 mA gcathode −1 in the voltage range 1.50–4.78 V. The evolution of the cathode capacity versus the number of cycles is shown in Figure 7. The SEI formation at the graphite anode consumes part of the initial charge available in the cathode. After SEI formation, a stable reversible specific capacity of 160 mA h gcathode −1 was obtained.
Figure 7.
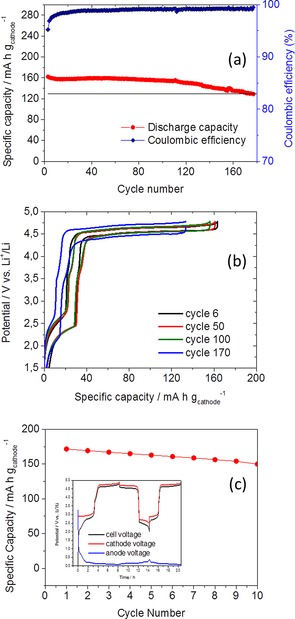
(a) Cycling performance and (b) charge/discharge profiles of a full cell with cathode composition Li1.5Ni0.5Mn1.5O4. (c) Cycling performance and charge/discharge profiles (inset) of a full cell with a cathode composition of Li1.88Ni0.5Mn1.5O4 versus graphite. Charge/discharge current density 30 mA gcathode −1.
As already mentioned, the chemical method proposed here allows the amount of Li in the cathode structure to be tuned to compensate for the ICL of the graphite and increase the reversible capacity of the full cell. Therefore, we further assembled cells based on Li1.88Ni0.5Mn1.5O4 with graphite. The obtained results are reported in Figure 7 c. The potential curves versus a Li reference for the first cycle clearly show the SEI formation of the graphite. After the first three cycles, the cathode delivers 170 mA h g−1. This indicates that it is possible to increase the cell capacity by optimizing the cell balance, that is, by estimating the optimum cathode/anode ratio and Li content in the cathode to fully compensate the ICL of the graphite. However, the optimization of the cell balance is beyond the scope of this work, and further experiments are needed to achieve the best performance in full cells. Regardless of possible further cell‐balance optimization, the cathode materials presented here offer a unique combination of characteristics in terms of morphology, particle size, and density and show high‐capacity and high‐voltage performance. The very promising cyclability versus graphite in full cells has not been reported previously and is highly encouraging in view of practical applications for Li‐ion batteries.
Conclusions
We successfully synthetized Li‐rich phases with composition Li1+xNi0.5Mn1.5O4 (0<x<1), which showed high‐capacity and high‐voltage performance as cathode active materials for Li‐ion batteries (LiBs). The structural and morphological parameters were optimized to obtain the maximum energy density in cell applications. The optimized architecture in combination with the high density leads to fewer surface side reactions at high potentials. Moreover, the polycrystalline architecture of the grains with random orientation of the primary crystallites may help to accommodate the changes to the anisotropic lattice parameters that occur at low potentials. Our findings confirm that the chemical lithiation leads to the same Li‐rich phases as those obtained through electrochemical lithiation. Furthermore, we demonstrated the first application of Li‐rich Li1+xNi0.5Mn1.5O4 (0<x<1) cathodes in full cells versus graphite anodes, and the cells had a capacity of 160 mA h g−1 and a coulombic efficiency of nearly 100 %. The high capacity and high potential make the chemical lithiation approach feasible for practical applications.
Experimental Section
The Li1+xNi0.5Mn1.5O4 materials were synthesized by a coprecipitation process followed by two thermal treatments: the first one in an oxidative atmosphere and the second one under reductive conditions to obtain the final Li‐rich stoichiometry. The precursors were obtained by combining aqueous solutions of ammonia, nickel, and manganese nitrates in an alkaline environment. The molar ratio of ammonia/nickel+manganese ions was adjusted to approximately 0.5. The pH of the solution was in the range 9–11. The relative amount of nickel and manganese in the solution was adjusted to obtain a ratio of 1:3 in the final precipitate. The precipitation step was performed in a continuous stirred‐tank reactor. Lithium hydroxide (Li/Ni=2) was used to lithiate the precursors. The thermal treatment was performed under air with a final annealing step at 700 °C. The obtained product was then mixed with a Li source under reductive conditions without any solvent to obtain the desired Li‐rich phase. The temperature of the second thermal step was kept below 600 °C for a dwell time of 4 h. A series of products with different compositions were synthesized, and the Li content was varied by adjusting the ratio of the reactants.
The chemical analysis was performed by inductively coupled plasma optical emission spectrometry (ICP‐OES) with an Arcos SOP instrument. The structural properties were investigated by powder XRD (CuKα radiation, λ=0.154 nm) with a Siemens D5000 diffractometer in the 2θ range 10 to 120°. The XRD patterns were analyzed by the TOPAS 2.1 program from Bruker. The SEM images were recorded with a LEO 1530 VP instrument. The tap densities were determined with a JEL Stampfvolumeter STAV 2003 instrument.
The structures of LiNi0.5Mn1.5O4 and Li2Ni0.5Mn1.5O4 were analyzed by TEM, for which powder samples were dispersed in DMC and transferred onto holey carbon grids without crushing to reduce artefacts that may be formed from the crushing process. Electron diffraction experiments were conducted at 80 kV with a Titan 80–300 kV transmission electron microscope to reduce electron‐beam‐induced damage.
The electrodes for electrochemical measurements were manufactured by preparing slurries of active material/carbon SuperP (Timcal)/polyvinylidene fluoride in the ratio 88:8:4 wt %. N‐Methylpyrrolidone (Aldrich) was used as the solvent. The slurries were coated on Al foil by the “doctor blade” technique and then dried at 40 °C. The electrodes were punched from the obtained coatings, pressed, and dried under vacuum. The half‐cell tests were performed with two‐electrode coin cells (CR2032, MTI Al‐Clad) with metallic Li as the counter electrode or three‐electrode cells (EL‐Cell Germany) with metallic Li as the counter and reference electrodes. Glass microfiber (Whatman, GF/A) was used as a separator. The cells were assembled in an argon‐filled glovebox. Full‐cell measurements were performed with two‐electrode coin cells (CR2032, MTI Al‐Clad). The anode composition was 90 wt % graphite (Hitachi SMG) and 10 wt % polyvinylidene fluoride. Anode and cathode pairs were first assembled in a three‐electrode configuration to follow the individual potential profiles versus Li. This allowed the cell cut‐off potentials to be defined. Subsequently, the same anode and cathode were reassembled in a two‐electrode coin cell and cycled for long‐term stability tests. Cathode/anode active‐material mass ratios in the range 1.04–1.98 were used for full‐cell balancing. The electrolyte was a solution containing 0.98 m LiPF6 (BASF) and 0.02 m lithium bis(oxalato)borate (LiBOB, Rockwood Lithium) in EC/DMC (1:1 w/w, UBE Industry, Japan; EC=ethylene carbonate).
All tested electrodes had the same composition and active‐material loading of approximately 15 mg cm−2. All measurements were performed at room temperature with a VMP2/Z electrochemical workstation by BioLogic Science Instruments. All potentials are given versus Li+/Li.
Acknowledgements
This work was supported by the German Federal Ministry of Education and Research (BMBF) in the project Li‐EcoSafe (03X4636A). The authors would like to thank Wolfgang Weirather, Gisela Arnold, and Claudia Pfeifer from ZSW for their contribution to the synthesis and characterization of the compounds.
M. Mancini, P. Axmann, G. Gabrielli, M. Kinyanjui, U. Kaiser, M. Wohlfahrt-Mehrens, ChemSusChem 2016, 9, 1843.
References
- 1. Tollefson J., Nature 2008, 456, 436–440. [DOI] [PubMed] [Google Scholar]
- 2. Armand M., Tarascon J., Nature 2008, 451, 652–657. [DOI] [PubMed] [Google Scholar]
- 3. Amine K., Tukamoto H., Yasuda H., Fujita Y., J. Power Sources 1997, 68, 604–608. [Google Scholar]
- 4. Thackeray M. M., Kang S.-H., Johnson C. S., Vaughey J. T., Benedek R., Hackney S. A. J., Mater. Chem. 2007, 17, 3112–3125. [Google Scholar]
- 5. Johnson C. S., Kim J. S., Lefief C., Li N., Vaughey J. Z., Thackeray M. M., Electrochem. Commun. 2004, 6, 1085–1091. [Google Scholar]
- 6. Park S.-H., Oh S.-W., Kang S. H., Belharouak I., Amine K., Sun Y.-K., Electrochim. Acta 2007, 52, 7226–7230. [Google Scholar]
- 7. Park S.-H., Oh S.-W., Yoon C.-S., Myung S.-T., Sun Y.-K., Electrochem. Solid-State Lett. 2005, 8, A163–A167. [Google Scholar]
- 8. Lee E.-S., Nam K.-W., Hu E., Manthiram A., Chem. Mater. 2012, 24, 6310–6320. [Google Scholar]
- 9. Ariyoshi K., Iwakoshi Y., Nakayama N., Ohzuku T., J. Electrochem. Soc. 2004, 151, A296–A303. [Google Scholar]
- 10. Chemelewski K. R., Lee E.-S., Li W., Manthiram A., Chem. Mater. 2013, 25, 2890–2897. [Google Scholar]
- 11. Shimoda K., Murakami M., Komatsu H., Arai H., Uchimoto Y., Ogumi Z., J. Phys. Chem. C 2015, 119, 13472–13480. [Google Scholar]
- 12. Gabrielli G., Axmann P., Wohlfahrt-Mehrens M., J. Electrochem. Soc. 2016, 163, A470–A476. [Google Scholar]
- 13. Axmann P., Gabrielli G., Wohlfahrt-Mehrens M., J. Power Sources 2016, 301, 151–159. [Google Scholar]
- 14. Idemoto Y., Narai H., Koura N., J. Power Sources 2003, 125, 119–121. [Google Scholar]
- 15. Kim J.-H., Yoon C. S., Myung S.-T., Prakash J., Sun Y.-K., Electrochem. Solid-State Lett. 2004, 7, A216–A220. [Google Scholar]
- 16. Wang L., Li H., Huang X., Baudrin E., Solid State Ionics 2011, 193, 32–38. [Google Scholar]
- 17. Amine K., Tukamoto H., Yasuda H., Fujita Y., J. Electrochem. Soc. 1996, 143, 1607–1613. [Google Scholar]
- 18. Kim J.-H., Myung S.-T., Yoon C. S., Kang S. G., Sun Y.-K., Chem. Mater. 2004, 16, 906–914. [Google Scholar]
- 19. Manthiram A., Chemelewski K., Lee E.-S., Energy Environ. Sci. 2014, 7, 1339–1350. [Google Scholar]
- 20. Hong S.-K., Mho S.-I., Yeo I.-H., Kang Y., Kim D.-W., Electrochim. Acta 2015, 156, 29–37. [Google Scholar]