

Abstract
Major long-range white matter pathways (cingulum, fornix, uncinate fasciculus [UF], inferior fronto-occipital fasciculus [IFOF], inferior longitudinal fasciculus [ILF], thalamocortical [TC], and corpus callosal [CC] pathways) were identified in eighty-three healthy humans ranging from newborn to adult ages. We tracked developmental changes using high-angular resolution diffusion MR tractography. Fractional anisotropy (FA), apparent diffusion coefficient, number, length, and volume were measured in pathways in each subject. Newborns had fewer, and more sparse, pathways than those of the older subjects. FA, number, length, and volume of pathways gradually increased with age and reached a plateau between 3 and 5 years of age. Data were further analyzed by normalizing with mean adult values as well as with each subject’s whole brain values. Comparing subjects of 3 years old and under to those over 3 years old, the studied pathways showed differential growth patterns. The CC, bilateral cingulum, bilateral TC, and the left IFOF pathways showed significant growth both in volume and length, while the bilateral fornix, bilateral ILF and bilateral UF showed significant growth only in volume. The TC and CC took similar growth patterns with the whole brain. FA values of the cingulum and IFOF, and the length of ILF showed leftward asymmetry. The fornix, ILF and UF occupied decreased space compared to the whole brain during development with higher FA values, likely corresponding to extensive maturation of the pathways compared to the mean whole brain maturation. We believe that the outcome of this study will provide an important database for future reference.
Keywords: Development, White matter, Newborn, Diffusion imaging, Tractography
1. Introduction
Long-range white matter tracts play different functions by linking various brain regions, and this emergence of normal hemispheric asymmetry of the brain is important to many cognitive functions (Mesulam, 1990; Gazzaniga, 1995; Gotts et al., 2013). It is known that such white matter tracts take different courses of maturation during normal brain development. For example, studies have shown that the last pathways to become myelinated are the frontal and temporal association regions (Kinney et al., 1988). There has been growing awareness of the fact that abnormal white matter development is linked to altered brain connectivity in various neural developmental disorders such as autism, Asperger syndrome, attention deficit hyperactivity disorder (ADHD), idiopathic developmental delays, multiple sclerosis, schizophrenia, sensory processing disorders, and Tourette syndrome (e.g., Nowell et al., 1988; Rapoport et al., 2001; Widjaja et al., 2008; Neuner et al., 2010; Clark et al., 2012; Owen et al., 2013; Roine et al., 2013; Abdel Razek et al., 2014). It is therefore essential to develop a clear picture of the normal patterns and timing of development of brain pathways to accurately assess and diagnose brain disorders during development.
Abnormal hemispheric asymmetry is also found in many neural developmental disorders such as autism (Chiron et al., 1995) and mental disorders such as depression (Bruder et al., 2012) and schizophrenia (Andreasen et al., 1982). Typical asymmetries in the human brain have been noted through differences in the morphometry of brain surface starting from fetal stages (Hochestetter, 1929; Fontes, 1944; Chi et al., 1977; Heilbroner and Holloway, 1988; Gilmore et al., 2007; Hill et al., 2010; Kasprian et al., 2011) and asymmetric differences in white matter tract pathways in children and adults (Lebel and Beaulieu, 2009). For example, in children (>5 years old) and adults, the right inferior fronto-occipital fasciculus (IFOF) and the left inferior longitudinal fasciculus (ILF) (Thiebaut de Schotten et al., 2011) revealed early lateralized development, suggesting that asymmetry probably emerges in association pathways earlier than 5 years of age. In fact, significant neuroanatomical changes in the cerebral white matter occur even earlier (Provenzale et al., 2007). For example, leftward asymmetry beginning as early as 15 gestational weeks in the ILF was observed in our previous study (Song et al., 2015). However, there is a lack of consensus about detailed spatio-temporal courses of development of connectivity and emerging asymmetry of white matter pathways in the human brain from development to adult ages (Mukherjee et al., 2002; Neil et al., 2002; Huang et al., 2006; Hasan et al., 2009; Gao et al., 2009; Peng et al., 2009; Geng et al., 2012; Peters et al., 2012; Cancelliere et al., 2013).
High-angular resolution diffusion MR imaging (HARDI) tractography enables identification of complex crossing tissue coherence in the brain (Tuch et al., 2003), even in immature fetal brains (Takahashi et al., 2011, 2012), which are typically more challenging to segment due to a surplus of unmyelinated fibers. HARDI tractography allows for the reconstruction of water diffusivity in many different directions in each imaging voxel. This technique, theoretically, provides an advantage over diffusion tensor imaging (DTI) (Frank, 2002; Tournier et al., 2004), because there are many places throughout the brain where white matter tracks cross and going many different directions (Tournier et al., 2007). Although there have been several techniques to assess white matter development without doing diffusion MR tractography (e.g., O’Muircheartaigh et al., 2014; Ball et al., 2013), advantages of diffusion tractography includes the detection of three-dimensional courses of fiber bundles. Many research studies have investigated white matter pathways in adults using diffusion tractography (Chao et al., 2009; Jin et al., 2011; Cercignani et al., 2012; Trojsi et al., 2013; Racine et al., 2014; Thong et al., 2014; Varentsova et al., 2014). However, there have been much fewer studies on the development of pathways from birth to adult ages. A few studies (e.g., Cancelliere et al., 2013; Uda et al., 2015) investigated white matter pathways from infant to adult ages by studying growth curves of pathways, but neglected to study laterality.
The objective of this research study is to investigate significant developmental changes, including emergence of asymmetry, that occur in various major pathways in the brain using HARDI tractography. The white matter tracts identified include projection (thalamocortical [TC]), limbic (cingulum bundle and fornix) and association (uncinate fasciculus [UF], IFOF, IFL, and corpus callosal [CC]) pathways.
Research has shown that the human brain develops significantly during the first few years of life (Thompson, 2001 Lippé et al., 2009; Gredebäck and Kochukhova, 2010; Berchicci et al., 2011), even going as far as saying that the brain of a 3 year old goes through enough developmental changes that it closely resembles that of an adult brain (Howes, 1983; Schimdt and Beauchamp, 1988; Eckerman and Didow, 1989; Berthier et al., 2000; Whiten et al., 2006; Keen and Shutts, 2007; Keitel et al., 2013; Smith et al., 2015). Piaget’s stages of cognitive development states that, at the age of 3, the child starts to integrate the use of symbols as his or her language skills, memory skills and imaginative thinking increases in complexity (Berthier et al., 2000; Hood et al., 2000; Keen and Shutts, 2007). This is further supported by the major developmental milestones for a 3 year old checklist provided by the Centers for Disease Control and Prevention, which indicates that increased language skills, communication skills and cognitive abilities are usually seen in children 3 years of age (American Academy of Pediatrics, 2009; Carlson 2005; Schimdt and Beauchamp, 1988; Smith et al., 2015; Williamson et al., 2011; Williamson and Meltzoff, 2011). By the age of 3, most major white matter tracts are well defined while the brain, itself, has gone through rapid myelination and its water content decreased quite significantly (Dobbing and Sands, 1973; Holland et al., 1986; Penn et al., 1980). Lipid content, protein content and cholesterol levels also increase rapidly during the first 3 years (Brant-Zawadzki and Enzmann, 1981; Dobbing and Sands, 1973; Holland et al., 1986). Thus, it is possible to form two groups of subjects, one group filled with those 3 years and younger while the other group is filled with anyone older than 3 years as the 3 years and younger group can be considered “before the first significant brain development” and the plus 3 years old group to be “after the first significant brain development.” Therefore, in the current study, we focused on the difference between the two groups: 3 years old and under, and over 3 years old. We believe that t-tests comparing these age groups accounted for the age factor.
2. Materials and methods
2.1. Subjects and MR imaging acquisition
The Institutional Review Board at Boston Children’s Hospital deemed this an exempt project because the research is retrospective and involved existing data with no risk to patient confidentiality. Initially, we selected 90 subjects with our inclusion criteria. These patients had no neurological/psychiatric history and no MRI-based abnormalities. Newborns and infants were scanned during sleep, some with, and some without, sedation. Since this is a retrospective study, detailed information whether or not the subjects were sedated was not available. Regarding subjects’ motion, no motion-correction preprocessing was performed, but we obtained the information on the degree of motion, and excluded subjects that moved more than at least 2 mm in one of the three directions (x, y, z). We did not apply motion correction because it sometimes causes erroneous tractography pathways. Seven subjects were excluded based on motion artifacts (four newborns/infants under 1 year old, one 3 years old, one 6 years old, and one 9 years old subjects). The age distribution was as follows: 6 months and under, 10; 6–12 months, 9; 1–3 years, 5; 4–5 years, 7; 6–10 years, 20; 11–15 years, 16; 16–20 years, 13; 21 years and over, 3. For the eighty-three apparently healthy subjects ranging from newborn to 28 years old, we performed T1-weighted MPRAGE imaging, T2-weighted turbo spin-echo imaging, and an isotropic diffusion-weighted spin-echo echo-planar imaging. Thirty diffusion-weighted measurements (b = 1000 s/mm2) and five non-diffusion-weighted measurements (b = 0 s/mm2) were acquired on a 3T MR system (Skyra, Siemens Medical Systems, Erlangen. Germany) with TR = 10 s; TE = 88 msec; δ = 12.0 m s; Δ= 24.2 m s; field of view = 22 × 22 cm; matrix size = 128 × 128, iPAT = 2. Spatial resolution was 2 mm isotropic. These parameters have been used in our work previously for in vivo HARDI tractography on newborn clinical data (Xu et al., 2014).
2.2. Diffusion data reconstruction for tractography
Freely available software packages, DiffusionToolkit and TrackVis (trackvis.org) were used to reconstruct and visualize tractography pathways. Tractography pathways were reconstructed using a HARDI Q-ball model with a streamline/FACT algorithm and a 45° angle threshold. We have experienced that using 30° or 35° in the dataset used in this study produces many fragmented tractography pathways. This is possibly because the number of diffusion directions (30) used. However, even with 60 diffusion-weighted directions, our former studies often used 45° (e.g., Takahashi et al., 2013), and even a wider angle (60°) (Edlow et al., 2012), because those angles produced best known neurologic pathways in the brain.
No threshold of fractional anisotropy (FA) was used for the fiber reconstruction. Brain mask volumes automatically created by DiffusionToolkit were used to terminate tractography structures within the brain surface, instead of the standard fractional anisotropy (FA) threshold (Takahashi et al., 2010, 2011, 2012, 2014; Schmahmann et al., 2007; Wedeen et al., 2008; Song et al., 2015), because progressive myelination and crossing fibers in the developing brain can result in low FA values that may potentially incorrectly terminate tractography tracing in brain regions with low FA values.
2.3. Tract delineation
Projection (TC), limbic (cingulum bundle and fornix), and association (UF, IFOF, IFL, and CC) pathways were identified in each subject as described below, and the track number, volume, length, fractional anisotropy (FA), and apparent diffusion coefficient (ADC) were measured in each pathway. Anatomic and tractography atlases (Catani and Thiebaut de Schotten, 2008; Thiebaut de Schotten et al., 2011; Mori and Tournier, 2013) were used to guide regions of interest (ROIs) placements on non-diffusion-weighted (b0) images and color FA maps in order to delineate the pathways of interest (Fig. 1A). A trained research assistant identified all tracts studied through manual ROI placement. A neuroscientist and two radiologists assessed the results confirming the ROI placements and resulting courses of fiber pathways. For the cingulum and fornix pathways, several hand-drawn ROIs were placed along the white matter regions for each pathway shown in the atlases. For the TC pathways, ROIs were placed in the thalami, cerebral cortex, and internal capsule regions. For the CC pathways, an ROI was drawn in the corpus callosum in a median sagittal plane. For the ILF, IFOF, and UF pathways, two ROIs were used for each pathway in their destinations: anterior temporal and occipital regions for the ILF, inferior frontal and occipital regions for the IFOF, and inferior frontal and anterior temporal regions for the UF. The size of all the ROIs were carefully optimized to not include other white matter pathways, as well as not to miss the arcuate pathways, by changing the size and location several times. We also, occasionally, used additional ROIs to exclude clearly different pathways from the pathways of interest.
Fig. 1.

Example HARDI tractography pathways of the cingulum, fornix, corpus callosal, thalamocortical, inferior longitudinal fasciculus, inferior frontooccipital fasciculus, and uncinated fasciculus (A) with placements of regions of interest in adult brains and (B) in different ages (40 gestational weeks newborn, 3 years old, and 20 years old subjects). See also Supplementary Figs. S1–S7 for all ages.
For each subject, a “whole-brain” track group was created, (used for normalizing results; see below) which was identified as the sum of all streamlines identified within the entire intra-cranial brain space. The arcuate fasciculus was not included in this study because we are studying it in another ongoing research study.
2.4. Quantification
FA, apparent diffusion coefficient (ADC), track number, length, and volume were measured on reconstructed tractography pathways corresponding to the cingulum, fornix, UF, IFOF, ILF, and CC pathways in each subject. Quantification of each parameter (raw data and mean/standard deviation) can be done automatically by TrackVis (trackvis.org). Volume was calculated as a sum of voxels that touched tractography pathways. Fiber tracking was initiated from the center of each voxel, and no interpolation was made, i.e., one vector does not change the direction within a voxel, although there were multiple vectors using HARDI. The direction of a vector changes only at the border of the next voxel, following one of the vectors with the least angle difference.
Raw data of each type of measurement were further normalized using two schemes: an “18Y+” normalization and a “whole-brain” (WB) normalization. In the 18Y+ normalization, individual subjects’ data was compared to the average value in all subjects 18 years or older, separately in the left and right hemispheres except for the CC pathway. For the 18+ normalization, values of each tract from each subject were divided by the averaged value of the tract from the subjects aged 18 years old and over. The intent of this normalization was to compare an individual’s tracks to those of a mature adult. Since t-tests from raw and 18+ normalized data mathematically produce the same results, we did not report t-test results for the 18+ normalized data, but described them only qualitatively. This normalization process could indicate the speed and degree of development of specific pathways compared to mean adult values. In the WB normalization, we combined left and right hemispheric data into a single mean value for each pathway except for the CC pathway. The single mean value of the left and right data of each tract from each subject was divided by the averaged value of the whole brain tracts of the same subject. (i.e., the WB trackgroup described above). The purpose of our WB normalization was to see developmental changes of measured indices compared to the averaged whole brain development. This normalization could be informative of the speed and degree of development of specific pathways compared to the rest of the brain. In addition, the use of a mean whole brain value to normalize indices of a specific pathway is beneficial in accounting for tractography-specific inter-individual variations.
Left and right hemispheric data (L and R) for each pathway was used to calculate laterality index (LI). LIs were calculated as follows: LI = (L − R)/{0.5 × (L + R)}. LIs range from −2 to 2, and positive and negative LI values correspond to left- and rightward asymmetry, respectively (Caviness et al., 1996; Thiebaut de Schotten et al., 2011).
2.5. Statistical analysis
Subject data were divided into two groups: 3 years old and under (24 subjects) and over 3 years old (59 subjects). T-tests were performed on average values of tested parameters. Statistical significance was set to p = 1.28 × 10⁻⁴ (p < 0.01/78; (Bonferroni correction for multiple comparisons with (13 pathways in both hemispheres for raw data + 7 pathways for the whole brain normalization + 6 pathways for laterality test) × 3 types of t-tests). The laterality tests were done by comparing LIs to zero.
3. Results
3.1. Raw data, and normalized data using adult values
Seven types of pathways were identified across age (Fig. 1B; Supplementary Figs. S1–S7). The mean and standard deviation of the track count, volume, length, FA, and ADC for all tracts studied are shown in Table 1. Examples of scatter plots of raw data and normalized data from the cingulum pathways using adult values are shown in Figs. 2 and 3, and all plots are found in Supplementary Figs. S8–S21 (S8–S14: original plots, S15–S21: age in a log-scale). All values except for ADC showed a gradual increase and seemed to reach a plateau around 3–5 years old, depending on the measurement.
Table 1.
Mean and standard deviation of studied tracks.
| Track Count | Volume (ml) | Length (mm) | FA | ADC (mm2/s for Mean ± SD) | ||
|---|---|---|---|---|---|---|
| Cingulum | ||||||
| Left | 320.0 ± 91.5 | 7.2 ± 2.2 | 39.6 ± 11.1 | 0.48 ± 0.086 | 8.2 ± 0.16 | |
| Right | 306.7 ± 83.7 | 6.7 ± 1.9 | 37.0 ± 10.4 | 0.46 ± 0.082 | 8.2 ± 0.16 | |
| Fornix | ||||||
| Left | 292.4 ± 81.9 | 6.1 ± 1.8 | 37.0 ± 11.0 | 0.40 ± 0.074 | 1.1 ± 0.25 | |
| Right | 295.3 ± 85.4 | 6.1 ± 1.9 | 34.8 ± 10.7 | 0.40 ± 0.076 | 1.1 ± 0.26 | |
| Corpus Callosum | ||||||
| 5557.6 ± 2336.6 | 102.0 ± 39.2 | 67.6 ± 14.7 | 0.55 ± 0.069 | 8.5 ± 0.19 | ||
| Thalamocortical | ||||||
| Left | 1088.7 ± 400.5 | 32.0 ± 11.3 | 48.8 ± 6.8 | 0.48 ± 0.064 | 7.6 ± 0.13 | |
| Right | 1117.6 ± 409.5 | 32.3 ± 11.0 | 48.9 ± 6.8 | 0.48 ± 0.064 | 7.7 ± 0.12 | |
| Inferior Longitudinal Fasciculus | ||||||
| Left | 421.8 ± 155.7 | 9.6 ± 3.0 | 46.3 ± 9.0 | 5.0 × 10⁻¹ ± 8.7 × 10⁻² | 8.6 ± 0.20 | |
| Right | 392.7 ± 118.9 | 9.0 ± 2.3 | 42.4 ± 7.6 | 4.9 × 10⁻¹ ± 8.5 × 10⁻² | 8.6 ± 0.19 | |
| Inferior Fronto-Occipital Fasciculus | ||||||
| Left | 567.1 ± 221.9 | 14.4 ± 4.7 | 62.5 ± 13.3 | 0.51 ± 0.090 | 8.3 ± 0.18 | |
| Right | 596.5 ± 224.0 | 14.8 ± 4.7 | 62.7 ± 12.0 | 0.50 ± 0.083 | 8.3 ± 0.18 | |
| Uncinate Fasciculus | ||||||
| Left | 286.8 ± 90.2 | 6.9 ± 1.9 | 36.1 ± 8.0 | 0.42 ± 0.074 | 8.3 ± 0.15 | |
| Right | 314.8 ± 103.1 | 7.1 ± 2.1 | 40.0 ± 10.0 | 0.42 ± 0.073 | 8.4 ± 0.16 |
Fig. 2.
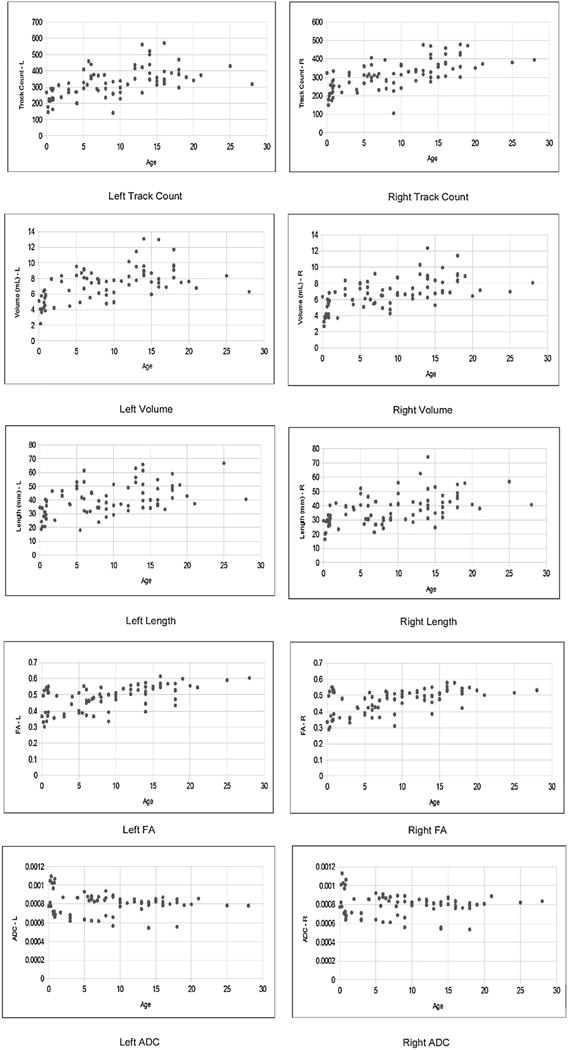
Example scatterplots for the raw data from the cingulum pathways. See also Supplementary Figs. S8–S21 for the other pathways. See also Table 2.
Fig. 3.
Example scatterplots for the 18+ normalized data from the cingulum pathways. See also Supplementary Figs. S8–S21 for the other pathways. See also Table 3.
Raw data (Table 2) demonstrated that the CC, bilateral cingulum, bilateral TC pathways, and the bilateral IFOF showed significant growth in all track count, volume, and length, while the bilateral fornix, bilateral ILF and bilateral UF showed significant growth only in track count and volume, and not in length. FA and ADC values showed almost no significant changes across age but, with a more lenient, standard threshold without multiple comparisons correction (e.g., p = 0.05 or 0.001), there were many pathways that showed significant differences in FA and ADC across age.
Table 2.
P values, mean and standard deviation from comparisons of 3 years old and younger to over 3 years old (raw data).
| Track Count | Volume (ml for Mea ± SD) | Length (mm for Mean ± SD) | FA | ADC (mm2/s for Mean ± SD) | ||
|---|---|---|---|---|---|---|
| Cingulum | ||||||
| p-values (under vs. over 3YO) | Left | 1.00 × 10⁻¹¹ | 9.35 × 10⁻¹¹ | 1.19 × 10⁻⁷ | 5.16 × 10⁻³ | 3.07 × 10⁻² |
| p-values (under vs. over 3YO) | Right | 5.66 × 10⁻⁹ | 1.10 × 10⁻⁹ | 6.93 × 10⁻⁸ | 2.63 × 10⁻² | 3.27 × 10⁻² |
| Under 3YO – Mean ± SD | Left | 235.67 ± 50.65 | 5.21 ± 1.63 | 31.80 ± 8.44 | 0.42 ± 0.10 | 8.2 ± 0.25 |
| Right | 233.17 ± 60.21 | 4.98 ± 1.57 | 29.67 ± 6.45 | 0.41 ± 0.11 | 8.86 ± 0.25 | |
| Over 3YO – Mean ± SD | Left | 354.31 ± 81.67 | 7.94 ± 1.81 | 42.81 ± 10.47 | 0.50 ± 0.07 | 7.94 ± 0.09 |
| Right | 336.63 ± 72.99 | 7.37 ± 1.59 | 39.92 ± 10.28 | 0.48 ± 0.06 | 7.91 ± 0.09 | |
| Fornix | ||||||
| p-values (under vs. over 3YO) | Left | 9.49 × 10⁻⁵ | 5.18 × 10⁻⁶ | 9.52 × 10⁻³ | 6.20 × 10⁻¹ | 1.90 × 10⁻¹ |
| p-values (under vs. over 3YO) | Right | 9.98 × 10⁻⁵ | 1.97 × 10⁻⁵ | 1.25 × 10⁻² | 2.70 × 10⁻¹ | 4.79 × 10⁻² |
| Under 3YO – Mean ± SD | Left | 248.54 ± 61.39 | 4.98 ± 1.60 | 32.70 ± 10.70 | 0.40 ± 0.11 | 10.2 ± 0.31 |
| Right | 250.58 ± 66.50 | 4.97 ± 1.70 | 31.00 ± 10.03 | 0.40 ± 0.11 | 10.1 ± 0.29 | |
| Over 3YO – Mean ± SD | Left | 311.73 ± 82.75 | 6.63 ± 1.62 | 38.84 ± 10.53 | 0.40 ± 0.05 | 11.7 ± 0.21 |
| Right | 315.00 ± 85.88 | 6.56 ± 1.77 | 36.52 ± 10.58 | 0.39 ± 0.05 | 12.0 ± 0.22 | |
| Corpus Callosum | ||||||
| p-values (under vs. over 3YO) | 6.11 × 10⁻¹² | 3.98 × 10⁻¹⁰ | 9.48 × 10⁻⁷ | 2.31 × 10⁻⁴ | 5.45 × 10⁻² | |
| Under 3YO – Mean ± SD | 3088.39 ± 1698.19 | 62.29 ± 35.41 | 56.13 ± 14.23 | 0.49 ± 0.07 | 9.15 ± 0.29 | |
| Over 3YO – Mean ± SD | 6571.76 ± 1729.87 | 118.301 ± 27.3 | 72.31 ± 12.22 | 0.58 ± 0.05 | 8.33 ± 0.13 | |
| Thalamocortical | ||||||
| p-values (under vs. over 3YO) | Left | 3.46 × 10⁻¹⁴ | 5.39 × 10⁻¹¹ | 3.83 × 10⁻⁷ | 2.60 × 10⁻¹ | 2.64 × 10⁻¹ |
| p-values (under vs. over 3YO) | Right | 4.51 × 10⁻¹⁴ | 5.74 × 10⁻¹³ | 7.82 × 10⁻⁸ | 1.78 × 10⁻¹ | 3.12 × 10⁻¹ |
| Under 3YO – Mean ± SD | Left | 679.36 ± 194.06 | 20.60 ± 7.71 | 42.95 ± 5.27 | 0.45 ± 0.09 | 7.83 ± 0.15 |
| Right | 687.68 ± 210.73 | 20.55 ± 7.20 | 42.38 ± 5.08 | 0.45 ± 0.09 | 7.87 ± 0.15 | |
| Over 3YO – Mean ± SD | Left | 1246.74 ± 343.64 | 36.35 ± 9.24 | 51.11 ± 5.94 | 0.49 ± 0.05 | 7.67 ± 0.12 |
| Right | 1283.54 ± 341.07 | 36.76 ± 8.61 | 51.35 ± 5.64 | 0.49 ± 0.05 | 7.62 ± 0.12 | |
| Inferior Longitudinal Fasciculus | ||||||
| p-values (under vs. over 3YO) | Left | 3.59 × 10⁻¹² | 9.33 × 10⁻¹¹ | 8.37 × 10⁻² | 2.40 × 10⁻⁴ | 1.09 × 10⁻² |
| p-values (under vs. over 3YO) | Right | 2.78 × 10⁻⁸ | 9.29 × 10⁻⁷ | 1.76 × 10⁻² | 2.08 × 10⁻⁴ | 1.45 × 10⁻² |
| Under 3YO – Mean ± SD | Left | 287.00 ± 67.71 | 6.68 ± 2.07 | 41.79 ± 10.58 | 0.41 ± 0.10 | 9.63 ± 0.31 |
| Right | 297.39 ± 58.57 | 6.83 ± 2.00 | 38.24 ± 7.62 | 0.41 ± 0.10 | 9.64 ± 0.30 | |
| Over 3YO – Mean ± SD | Left | 474.41 ± 148.58 | 10.76 ± 2.54 | 48.01 ± 7.71 | 0.53 ± 0.05 | 8.27 ± 0.11 |
| Right | 429.90 ± 115.86 | 9.80 ± 1.88 | 43.98 ± 7.08 | 0.52 ± 0.05 | 8.35 ± 0.11 | |
| Inferior Fronto-Occipital Fasciculus | ||||||
| p-values (under vs. over 3YO) | Left | 1.73 × 10⁻¹² | 2.14 × 10⁻¹¹ | 4.16 × 10⁻⁵ | 1.76 × 10⁻¹¹ | 4.79 × 10⁻¹² |
| p-values (under vs. over 3YO) | Right | 6.33 × 10⁻¹⁰ | 3.21 × 10⁻⁵ | 1.68 × 10⁻² | 1.32 × 10⁻⁴ | 2.07 × 10⁻² |
| Under 3YO – Mean ± SD | Left | 351.75 ± 108.66 | 9.79 ± 3.54 | 53.67 ± 12.94 | 0.42 ± 0.09 | 9.12 ± 0.28 |
| Right | 382.58 ± 109.08 | 9.97 ± 3.13 | 55.61 ± 10.88 | 0.42 ± 0.09 | 9.13 ± 0.28 | |
| Over 3YO – Mean ± SD | Left | 654.69 ± 194.74 | 16.34 ± 3.69 | 66.01 ± 11.75 | 0.55 ± 0.06 | 7.91 ± 0.10 |
| Right | 683.44 ± 199.02 | 16.76 ± 3.66 | 65.51 ± 11.24 | 0.53 ± 0.05 | 8.09 ± 0.10 | |
| Uncinate Fasciculus | ||||||
| p-values (under vs. over 3YO) | Left | 3.38 × 10⁻⁶ | 2.97 × 10⁻¹⁰ | 2.92 × 10⁻¹ | 2.46 × 10⁻¹ | 2.87 × 10⁻² |
| p-values (under vs. over 3YO) | Right | 3.42 × 10⁻⁸ | 2.44 × 10⁻⁹ | 9.05 × 10⁻¹ | 3.65 × 10⁻¹ | 4.23 × 10⁻² |
| Under 3YO – Mean ± SD | Left | 217.35 ± 55.59 | 5.03 ± 1.19 | 34.56 ± 9.03 | 0.39 ± 0.11 | 9.04 ± 0.25 |
| Right | 218.52 ± 65.43 | 5.08 ± 1.56 | 40.51 ± 12.37 | 0.39 ± 0.11 | 9.06 ± 0.25 | |
| Over 3YO – Mean ± SD | Left | 314.29 ± 86.65 | 7.64 ± 1.64 | 36.76 ± 7.50 | 0.43 ± 0.05 | 8.11 ± 0.09 |
| Right | 352.97 ± 89.69 | 7.91 ± 1.65 | 39.75 ± 9.00 | 0.43 ± 0.05 | 8.29 ± 0.09 |
3.2. Whole brain normalization
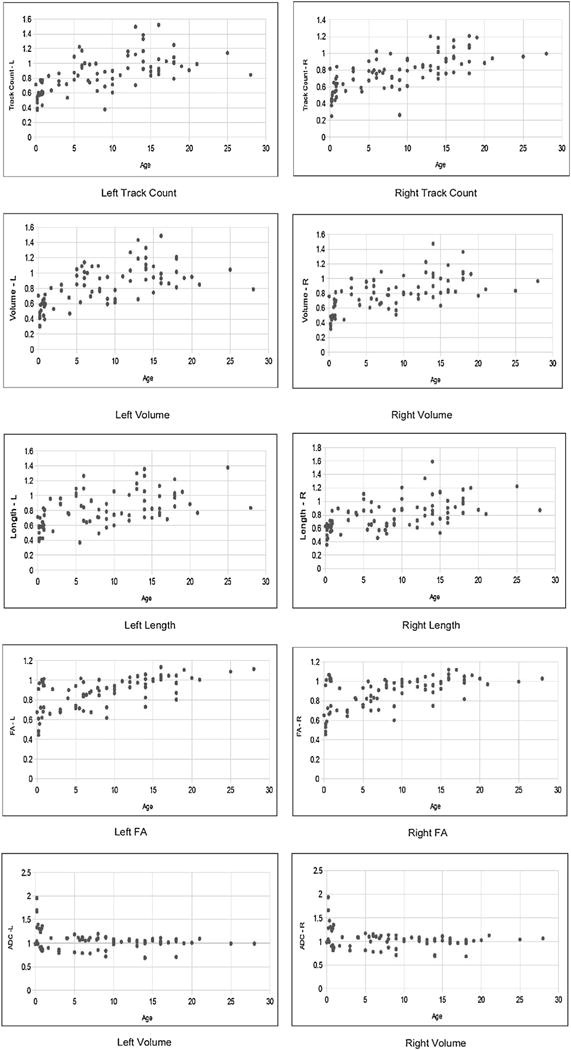
We next examined normalized data by whole brain values. Examples of scatter plots from the cingulum pathways are shown in Fig. 4, and all plots are found in Supplementary Figs. S8–S21. In general, normalized volume, voxel count, and track count showed a gradual decrease, and normalized FA showed a gradual increase, and reached a plateau around 3–5 years old. Length and ADC showed a less obvious pattern without a clear age range when it reached a plateau.
Fig. 4.

Example scatterplots for the whole-brain normalized data from the cingulum pathways. See also Supplementary Figs. S8–S21 for the other pathways. See also Table 4.
We then compared normalized values of each pathway from 3 years old and under to those over 3 years old (Table 3). The CC and TC pathways did not show any significant differences between the two groups except for the length of the CC. Fornix, ILF, and UF pathways showed significant decrease in both track count and volume but not in length. Most of them also showed increased FA values. Length was not significantly different, except for the cingulum. In contrast to raw data, FA and ADC values normalized by whole brain values showed significant difference across age in many pathways (Fig. 5).
Table 3.
P values, mean and standard deviation from comparisons of 3 years old and younger to over 3 years old (WB normalization, no unit).
| Track Count | Volume | Length | FA | ADC | |
|---|---|---|---|---|---|
| Cingulum | |||||
| p-values (under vs. over 3YO) | 6.69 × 10⁻⁷ | 6.71 × 10⁻⁶ | 5.25 × 10⁻⁹ | 4.53 × 10⁻⁹ | 9.09 × 10⁻³ |
| Under 3YO – Mean ± SD | 1.89 × 10⁻³ | 6.07 × 10⁻³ | 2.26 | 1.17 | 0.98 |
| ±5.8 × 10⁻⁴ | ±1.38 × 10⁻³ | ±0.42 | ±0.15 | ±0.068 | |
| Over 3YO – Mean ± SD | 1.2 × 10⁻³ | 4.5 × 10⁻³ | 2.68 | 1.44 | 0.93 |
| ±2.9 × 10⁻⁴ | ±8.4 × 10⁴ | ±0.57 | ±0.12 | ±0.061 | |
| Fornix | |||||
| p-values (under vs. over 3YO) | 1.14 × 10⁻⁵ | 9.61 × 10⁻⁶ | 2.64 × 10⁻¹ | 1.01 × 10⁻¹ | 4.01 × 10⁻¹¹ |
| Under 3YO – Mean ± SD | 2.1 × 10⁻³ | 6.11 × 10⁻³ | 2.34 | 1.12 | 1.13 |
| ±9.3 × 10⁻⁴ | ±2.05 × 10⁻³ | ±0.64 | ±0.11 | ±0.011 | |
| Over 3YO – Mean ± SD | 1.11 × 10⁻³ | 3.89 × 10⁻³ | 2.44 | 1.16 | 1.36 |
| ±3.5 × 10⁻⁴ | ± 9.4 × 10⁻⁴ | ±0.59 | ±0.09 | ±0.013 | |
| Corpus Callosum | |||||
| p-values (under vs. over 3YO) | 7.80 × 10⁻¹ | 4.44 × 10⁻¹ | 6.83 × 10⁻⁵ | 1.35 × 10⁻³ | 2.27 × 10⁻³ |
| Under 3YO – Mean ± SD | 2.2 × 10⁻² | 6.62 × 10⁻² | 6.62 × 10⁻² | 1.45 | 1.01 |
| ±7.96 × 10⁻³ | ±1.7 × 10⁻² | ±1.7 × 10⁻² | ±0.33 | ±0.056 | |
| Over 3YO – Mean ± SD | 2.3 × 10⁻² | 6.9 × 10⁻² | 4.69 | 1.68 | 0.97 |
| ±6.68 × 10⁻³ | ±1.3 × 10⁻² | ±0.67 | ±0.10 | ±0.055 | |
| Thalamocortical | |||||
| p-values (under vs. over 3YO) | 2.47 × 10⁻² | 1.03 × 10⁻¹ | 2.23 × 10⁻¹ | 4.18 × 10⁻¹ | 6.77 × 10⁻¹ |
| Under 3YO – Mean ± SD | 5.32 × 10⁻³ | 2.44 × 10⁻² | 2.4 × 10⁻² | 1.37 | 0.97 |
| ±2.08 × 10⁻³ | ±9.14 × 10⁻³ | ±9.14 × 10⁻³ | ±0.53 | ±0.030 | |
| Over 3YO – Mean ± SD | 4.49 × 10⁻³ | 2.18 × 10⁻² | 3.36 | 1.44 | 0.91 |
| ±1.66 × 10⁻³ | ±5.96 × 10⁻³ | ±0.52 | ±0.20 | ±0.019 | |
| Inferior Longitudinal Fasciculus | |||||
| p-values (under vs. over 3YO) | 3.42 × 10⁻⁵ | 2.12 × 10⁻⁶ | 5.84 × 10⁻¹ | 1.80 × 10⁻⁸ | 5.97 × 10⁻⁴ |
| Under 3YO – Mean ± SD | 2.38 × 10⁻³ | 8.31 × 10⁻³ | 2.99 | 1.22 | 1.02 |
| ±8.7 × 10⁻⁴ | ±2.25 × 10⁻³ | ±0.66 | ±0.20 | ±0.063 | |
| Over 3YO – Mean ± SD | 1.6 × 10⁻³ | 6.07 × 10⁻³ | 2.99 | 1.54 | 0.96 |
| ±5.7 × 10⁻⁴ | ±1.24 × 10⁻³ | ±0.50 | ±0.12 | ±0.051 | |
| Inferior Fronto-Occipital Fasciculus | |||||
| p-values (under vs. over 3YO) | 7.51 × 10⁻⁴ | 2.49 × 10⁻⁴ | 3.14 × 10⁻² | 1.06 × 10⁻⁸ | 3.82 × 10⁻³ |
| Under 3YO – Mean ± SD | 2.93 × 10⁻³ | 1.2 × 10⁻² | 4.04 | 1.24 | 0.98 |
| ±1.04 × 10⁻³ | ±3.11 × 10⁻³ | ±0.63 | ±0.20 | ±0.060 | |
| Over 3YO – Mean ± SD | 2.3 × 10⁻³ | 9.72 × 10⁻³ | 4.27 | 1.57 | 0.92 |
| ±5.9 × 10⁻⁴ | ±1.79 × 10⁻³ | ±0.57 | ±0.11 | ±0.063 | |
| Uncinate Fasciculus | |||||
| p-values (under vs. over 3YO) | 9.75 × 10⁻⁵ | 3.37 × 10⁻⁶ | 1.97 × 10⁻¹ | 2.04 × 10⁻⁸ | 1.02 × 10⁻² |
| Under 3YO – Mean ± SD | 1.85 × 10⁻³ | 6.24 × 10⁻³ | 2.73 | 1.09 | 1.01 |
| ±8.9 × 10⁻⁴ | ±1.83 × 10⁻³ | ±0.57 | ±0.11 | ±0.068 | |
| Over 3YO – Mean ± SD | 1.14 × 10⁻³ | 4.53 × 10⁻³ | 2.49 | 1.26 | 0.95 |
| ±3.2 × 10⁻⁴ | ±8.1 × 10⁻⁴ | ±0.49 | 0.1 | ±0.069 |
Fig. 5.

Example scatterplots for the laterality index from the cingulum pathways. See also Supplementary Figs. S8–S21 for the other pathways. See also Table 5.
3.3. Hemispheric asymmetry
Combining all ages, only cingulum FA, IFOF FA, and ILF length showed leftward hemispheric asymmetry (Table 4). All LI plots are found in Supplementary Figs. S8–S21. No significant change was found in laterality across age in all measurements studied (Table 5).
Table 4.
P values, mean, and standard deviation for Laterality Index.
| Track Count | Volume | Length | FA | ADC | |
|---|---|---|---|---|---|
| Cingulum | |||||
| p-values (under vs. over 3YO) | 7.49 × 10⁻² | 1.45 × 10⁻³ | 2.53 × 10⁻³ | 1.77 × 10⁻⁷ (L) | 3.82 × 10⁻¹ |
| Mean ± SD | 0.04 ± 0.19 | 0.06 ± 0.18 | 0.07 ± 0.20 | 0.04 ± 0.06 | 0.0032 ± 0.0302 |
| Fornix | |||||
| p-values (under vs. over 3YO) | 3.76 × 10⁻¹ | 8.85 × 10⁻¹ | 1.42 × 10⁻² | 3.85 × 10⁻² | 8.78 × 10⁻³ |
| Mean ± SD | −2.6 × 10⁻³± 0.22 | 0.02 ± 0.18 | 0.06 ± 0.22 | 0.02 ± 0.06 | −0.0139 ± 0.0697 |
| Thalamocortical | |||||
| p-values (under vs. over 3YO) | 3.11 × 10⁻¹ | 4.48 × 10⁻¹ | 9.74 × 10⁻¹ | 2.69 × 10⁻¹ | 6.07 × 10⁻¹ |
| Mean ± SD | −0.03 ± 0.23 | −0.02 ± 0.17 | −3 × 10⁻⁴ ± 0.08 | 0.01 ± 0.04 | 0.0013 ± 0.0224 |
| Inferior Longitudinal Fasciculus | |||||
| p-values (under vs. over 3YO) | 1.06 × 10⁻¹ | 1.58 × 10⁻² | 1.27 × 10⁻⁵ (L) | 1.57 × 10⁻² | 1.45 × 10⁻¹ |
| Mean ± SD | 0.04 ± 0.24 | 0.05 ± 0.18 | 0.08 ± 0.16 | 0.01 ± 0.05 | −0.0056 ± 0.0368 |
| Inferior Fronto-Occipital Fasciculus | |||||
| p-values (under vs. over 3YO) | 3.12 × 10⁻² | 1.38 × 10⁻¹ | 8.03 × 10⁻¹ | 1.47 × 10⁻⁷ (L) | 3.43 × 10⁻³ |
| Mean ± SD | −0.06 ± 0.23 | −0.03 ± 0.20 | −0.01 ± 0.17 | 0.02 ± 0.04 | −0.0076 ± 0.0239 |
| Uncinate Fasciculus | |||||
| 1.72 × 10⁻³ | 3.17 × 10⁻¹ | 1.03 × 10⁻⁴ | 8.38 × 10⁻¹ | 2.31 × 10⁻³ | |
| Mean ± SD | −0.08 ± 0.23 | −0.02 ± 0.19 | −0.10 ± 0.21 | −0.0013 ± 0.05 | −0.0101 ± 0.0286 |
L: leftward asymmetry.
Table 5.
P-values for laterality changes before and after 3YO.
| Track Count | Volume | Length | FA | ADC | |
|---|---|---|---|---|---|
| Cingulum | 0.77 | 0.51 | 0.55 | 0.03 | 0.67 |
| Fornix | 0.92 | 0.89 | 0.75 | 0.01 | 0.02 |
| Thalamocortical | 0.80 | 0.83 | 0.45 | 0.58 | 0.42 |
| Inferior Longitudinal Fasciculus | 0.01 | 0.32 | 0.88 | 0.39 | 0.08 |
| Inferior Fronto-Occipital Fasciculus | 0.27 | 0.43 | 0.17 | 0.01 | 0.36 |
| Uncinate Fasciculus | 0.02 | 0.22 | 0.34 | 0.19 | 0.04 |
3.4. Inter-rater reliability
To assess inter-rater reliability, the data from 6 subjects (3 newborns and 3 adults) were re-analyzed by a trained, new researcher, using the same ROI approach. All originally studied pathways were re-identified, and Track Count, Volume, Length, FA, and ADC values were extracted. For each measure (Track Count etc.), values from all identified pathways in 6 subjects were tested for correlation across the 2 individual ways of pathway identification. Inter-rater reliabilities were: for Track Count, 95.0%, for Volume, 94.7%, for Length, 80.7%, for FA, 79.0%, and for ADC, 80.9%.
4. Discussion
Major cerebral pathways, including projection, limbic, and association pathways, were identified in 83 healthy subjects ranging from newborn to adult ages, using high angular diffusion MR tractography. The growth of the pathways and laterality patterns were investigated by using track count, volume, length, fractional anisotropy (FA), and apparent diffusion coefficient (ADC) values of each pathway. Comparing subjects of 3 years old and under to those over 3 years old, the studied pathways showed a differential growth pattern. The CC, bilateral cingulum, bilateral TC pathways, and the left IFOF showed significant growth both in volume and length, while the bilateral fornix, bilateral ILF and bilateral UF showed significant growth only in volume, but not in length. The TC and CC pathways had similar growth patterns with the whole brain. FA values of the cingulum and IFOF, and the length of ILF showed leftward hemispheric asymmetry. The fornix, ILF and UF occupied less space compared to the whole brain during development, with higher FA values likely corresponding to extensive maturation of the pathways compared to the mean whole brain maturation.
4.1. Raw data
The CC, bilateral cingulum, bilateral TC pathways, and the left IFOF showed significant growth both in volume and length, while the bilateral fornix, bilateral ILF and bilateral UF showed significant growth only in volume and not in length. This suggests that the thickness of the tract diameter increased in the latter pathways without changing length. Potential causes of the increase in tract diameter could be an increase in the number of axonal fibers, an increase in the diameter of axons, and an increase in the degree of myelination of these tracts. Although the increase in the axonal numbers likely occurred mostly before birth, MRI methods to differentiate biological mechanisms, such as axonal diameter and myelination process, are limited (Barazany et al., 2009). Dell’Acqua et al. (2013) proposed that hindrance modulated orientational anisotropy (HMOA) can be useful to identify such differences in tissue properties, and future applications of this kind of technique will be promising in the study of normal and clinical populations.
4.2. Whole brain (WB) normalization
The CC and TC pathways almost did not show any significant differences, suggesting those tracts matured proportionally to the mean of whole brain pathways. The CC and TC pathways play relatively basic roles in the brain when compared to the other tracts studied and, therefore, it is possible that such pathways represent a general pattern of the whole brain development. However, it is also possible that the volumes of the CC and TC pathways are larger than the other pathways and are dominant in the brain, and the whole brain developmental trend was affected more by such pathways than by the other pathways with relatively small volumes.
After the WB normalization, observed significant differences were “decreases” in track count and volume, and “increases” in length, FA, and ADC values. Significant decreases in track number and volume were found in the cingulum, fornix, and ILF pathways. The UF pathways also showed decreased volume, but the track count was just above the threshold for statistical significance. The cingulum, ILF, and UF pathways showed increases in FA values. This result suggests that the cingulum, ILF and UF (although UF track count just showed a trend of difference) occupied disproportionally decreased space in the brain during development, with higher FA values likely corresponding to extensive maturation of the pathways compared to the mean whole brain maturation. Length did not show any significant change except for the cingulum pathways, suggesting that the length of the other pathways proportionally elongated compared to whole brain pathways.
A possible reason why most of the pathways did not show differences in FA and ADC but started showing differences after the WB normalization is inter-subjects variability. Comparing cross-sectional data without the WB normalization, subtle variation of the developmental speed across subjects might have not been detected. FA and ADC values, themselves, do not necessarily indicate the degree of maturation or the speed of maturation of each pathway since the adult values vary across pathways. However, the whole brain normalization revealed that the degree of maturation indicated by FA and ADC changes, possibly myelination processes, is greater in some pathways before and after 3 years old.
4.3. Hemispheric asymmetry
FA values of the cingulum and IFOF, and the length of ILF, showed leftward hemispheric asymmetry. The leftward asymmetry of the ILF agrees with our previous study of under 3 years old’s (Song et al., 2015) and others of older age (Thiebaut de Schotten et al., 2011), but the cingulum did not show asymmetry in our previous study. Thiebaut de Schotten et al. (2011) studied white matter development between 18 and 22 years old and the cingulum showed symmetrical left-right volume and FA. It is, however, possible that the younger ages contributed to the leftward development, as a previous study (Gong et al., 2005) showed leftward asymmetry in the anterior and middle parts of the cingulum.
The IFOF was found to have rightward asymmetry for tract volume in the study of Thiebaut de Schotten et al. (2011) while, in the current study, we found leftward asymmetry for FA values. It is possible that the laterality shifts from one side to the other over the developmental periods and, potentially, the left side of the IFOF becomes more myelinated early in life but the right side catches up by maturating in later developmental stages and becomes larger in adults. However, in this study, no significant change was found in laterality across age in all measurements studied, suggesting that the degree of laterality of these pathways does not change across age. Future studies are necessary to reconcile this discrepancy.
4.4. Limitations of the current study and future directions
In this study, we focused on comparisons between the groups of 3 years and under and over 3 years old to take into account the developmental changes between before and after the first major brain growth before 3 years old. Although our total sample size is 83, it is important in future studies to collect more number of subjects in each age group to more reliably describe developmental changes of white matter pathways as well as to properly assess inter-individual variation. As a tentative solution, the WB normalization was performed to account for tractography-specific inter-individual variations (see also the methods section regarding the motivation of the WB normalization). In regards to white matter development, there may be other growth patterns that occur throughout the lifespan or at different stages of development, other than around 3 years old. Given that there have been evidences that the maturation of the human brain is continuous through adolescence (Giorgio et al., 2010; Peters et al., 2012; Chavarria et al., 2014) and even over 20 years old (Li et al., 2014), more complex growth patterns of the white matter pathways should be studied with other age groups in the future. Additional diffusion properties can be taken into account as well.
There could be some interactions between the measurements that were analyzed in this study. For example, the length of the pathway could affect the track count as the number of voxels increases with the length of the pathway. This would lead to a higher calculation of the amount of pathways initiated from each voxel, although this factor can be canceled in our laterality analyses. The results of this study showed that the significant growth in length and track count were not always coincident, which is a supportive evidence that the effect of the interactions between these measurements are less significant.
Using the same spatial resolution under the same MR coil across subjects with different ages, smaller brains would likely be more affected by partial volume errors compared to larger brains. It would be possible that, for example, the number of tracts be less in a smaller brain than in a larger brain. However, the use of a higher spatial resolution with the same number of repetition of the scan reduces the signal to noise ratio, and it is not obvious that it produces more number of tracts in the small brain. The use of size-optimized MR coils would better solve this problem, and we have added this in the discussion section. In addition, we believe that the WB normalization used in this study controls, to some extent, such inter-subjects issues.
Eluvathingal et al. (2007) used DTI tractography to study the effects of age, sex differences and lateral asymmetries on white matter pathways (arcuate fasciculus, inferior longitudinal fasciculus, inferior fronto-occipital fasciculus, ucinate fasciculus, corticospinal tract and somatosensory pathway). They used the FACT/streamline algorithm with a FA threshold of 0.15 (except for the ILF and IFOF tracts which was 0.20) and angle threshold 60° (50° for ILF and IFOF). They concluded that FA increased significantly with age with decreases in all 3 diffusivities (left IFOF); significant decreases in all three diffusivities with age with no significant changes in FA (left CST); and no significant age-related changes in FA or diffusivity (SS). There was little to no sex differences while many pathways showed lateral asymmetries. Kamali et al. (2014) used DTI to study the trajectory of the superior longitudinal fasciculus (SLF) pathways in five male subjects. They used the fiber assignment by FACT/streamline algorithm and had a FA threshold of 0.22 and an angle threshold of 60°. This study observed the anatomy and microstructural neural pathways of five subcomponents of the SLF fibers. They also noted the superior parietal lobule connections of the language pathways along with the anatomical landmarks, ROIs for delineation, the macrostructural volumetric and corresponding microstructural attributes of the subcomponents. As these examples show, there are a variety of combinations of different tractography parameters, and we should be aware that different results across studies may be caused by the specific parameters used in each study.
Although the WB normalization could control some variabilities across subjects, given that the relatively limited number of subjects in each developmental stage, we are aware that the current results are still preliminary, and future studies including more number of subjects is necessary to conclude a better picture of the development of white matter pathways.
Jin et al. (2014) describe the technical problems that arise when using tractography. Since there are multiple programs, ways to measure data, and ways to select ROIs, the variability between tractography results, even when the same person is selecting the same ROIs in the same way, can be high. Even the use of automatic methods can result in inclusion of fibers that belong to a different tract or exclusion of fibers from the specified tract. The tractography algorithm used by Jin et al. (2014), multi-level fiber clustering, aimed to find the fiber shapes that were similar among the subjects. This kind of method will be useful in future studies in order to obtain the most accurate results. Differences in methods include the use of eddy current corrections in the post-processing of the data. No eddy current corrections were used in this research; not only our former studies (e.g., Takahashi et al., 2012; Song et al., 2015), many other researchers have chosen not to use eddy current corrections in their post-processing methods (Jbabdi et al., 2012; Pyles et al., 2013; Taoka et al., 2014). Establishing normal developmental time courses of various white matter pathways throughout brain development will provide a basis for studies of cognitive development and vulnerable periods of white matter pathway development.
Supplementary Material
Acknowledgments
This work was supported by Boston Children’s Hospital (BCH), NICHD (R01HD078561, R21HD069001) (ET), and NINDS (R03NS091587) (ET). Hui Xue and Thomas J. Re provided technical, and Priya Kabaria provided editorial assistance.
Appendix A. Supplementary data
Supplementary data associated with this article can be found, in the online version, at http://dx.doi.org/10.1016/j.ijdevneu.2016.02.002.
References
- Abdel Razek A, Mazroa J, Baz H. Assessment of white matter integrity of autistic preschool children with diffusion weighted MR imaging. Brain Dev. 2014;36:28–34. doi: 10.1016/j.braindev.2013.01.003. [DOI] [PubMed] [Google Scholar]
- Shelov S, Altmann TR, editors. American Academy of Pediatrics. Caring for Your Baby and Young Child: Birth to Age 5. fifth. Bantam Books; New York, NY: 2009. [Google Scholar]
- Andreasen NC, Dennert JW, Olsen SA, Damasio AR. Hemispheric asymmetries and schizophrenia. Am J Psychiatry. 1982;139:427–430. doi: 10.1176/ajp.139.4.427. [DOI] [PubMed] [Google Scholar]
- Ball G, Boardman JP, Arichi T, Merchant N, Rueckert D, Edwards AD, Counsell SJ. Testing the sensitivity of tract-based spatial statistics to simulated treatment effects in preterm neonates. PLoS One. 2013;8:e6770. doi: 10.1371/journal.pone.0067706. [DOI] [PMC free article] [PubMed] [Google Scholar]
- Barazany D, Basser PJ, Assaf Y. In vivo measurement of axon diameter distribution in the corpus callosum of rat brain. Brain. 2009;132:1210–1220. doi: 10.1093/brain/awp042. [DOI] [PMC free article] [PubMed] [Google Scholar]
- Berchicci M, Zhang T, Romero L, Peters A, Annett R, Teuscher U, Bertollo M, Okada Y, Stephen J, Comani S. Development of mu rhythm in infants and preschool children. Dev Neurosci. 2011;33:130–143. doi: 10.1159/000329095. [DOI] [PMC free article] [PubMed] [Google Scholar]
- Berthier NE, DeBlois S, Poirier CR, Novak MA, Clifton RK. Where’s the Ball? Two- and three-year-olds reason about unseen events. Dev Psychol. 2000;36:394–401. doi: 10.1037//0012-1649.36.3.394. [DOI] [PubMed] [Google Scholar]
- Brant-Zawadzki M, Enzmann DR. Using computed tomography of the brain to correlate low white-matter attenuation with early gestational age in neonates. Radiology. 1981;139:105–108. doi: 10.1148/radiology.139.1.7208910. [DOI] [PubMed] [Google Scholar]
- Bruder GE, Stewart JW, Hellerstein D, Alvarenga JE, Alschuler D, McGrath PJ. Abnormal functional brain asymmetry in depression: evidence of biologic commonality between major depression and dysthymia. Psychiatry Res. 2012;196:250–254. doi: 10.1016/j.psychres.2011.11.019. [DOI] [PMC free article] [PubMed] [Google Scholar]
- Cancelliere A, Mangano FT, Air EL, Jones BV, Altaye M, Rajagopal A, Holland SK, Hertzler DA, II, Yuan W. DTI values in key white matter tracts from infancy through adolescence. AJNR. 2013;34:1443–1449. doi: 10.3174/ajnr.A3350. [DOI] [PMC free article] [PubMed] [Google Scholar]
- Carlson SM. Developmentally sensitive measures of executive function in preschool children. Dev Neuropsychol. 2005;28:595–616. doi: 10.1207/s15326942dn2802_3. [DOI] [PubMed] [Google Scholar]
- Catani M, Thiebaut de Schotten M. A diffusion tensor imaging tractography atlas for virtual in vivo dissections. Cortex. 2008;44:1105–1132. doi: 10.1016/j.cortex.2008.05.004. [DOI] [PubMed] [Google Scholar]
- Caviness VS, Jr, Kennedy DN, Richelme C, Rademacher J, Filipek PA. The human brain age 7–11 years: a volumetric analysis based on magnetic resonance images. Cereb Cortex. 1996;6:726–736. doi: 10.1093/cercor/6.5.726. [DOI] [PubMed] [Google Scholar]
- Cercignani M, Embleton K, Parker GJ, Bozzali M. Group-averaged anatomical connectivity mapping for improved human white matter pathways visualization. NBM. 2012;25:1224–1233. doi: 10.1002/nbm.2793. [DOI] [PubMed] [Google Scholar]
- Chao YP, Cho KH, Yeh CH, Chou KH, Chen JH, Lin CP. Probabilistic topography of human corpus callosum using cytoarchitectural parcellation and high angular resolution diffusion imaging tractography. Hum Brain Mapp. 2009;30:3172–3287. doi: 10.1002/hbm.20739. [DOI] [PMC free article] [PubMed] [Google Scholar]
- Chavarria MC, Sánchez FJ, Chou Y, Thompson PM, Luders E. Puberty in the corpus callosum. Neuroscience. 2014;18:1–8. doi: 10.1016/j.neuroscience.2014.01.030. [DOI] [PMC free article] [PubMed] [Google Scholar]
- Chi JG, Dooling EC, Gilles FH. Left-right asymmetries of the temporal speech areas of the human fetus. Arch Neurol. 1977;34:346–348. doi: 10.1001/archneur.1977.00500180040008. [DOI] [PubMed] [Google Scholar]
- Chiron C, Leboyer M, Leon F, Jambaque L, Nuttin C, Syrota A. SPECT of the brain in childhood autism: evidence for a lack of normal hemispheric asymmetry. Dev Med Child Neurol. 1995;37:849–860. doi: 10.1111/j.1469-8749.1995.tb11938.x. [DOI] [PubMed] [Google Scholar]
- Clark K, Narr KL, ONeill J, Levitt J, Siddarth P, Phillips O, Toga A, Caplan R. White matter integrity, language, and childhood onset schizophrenia. Schizophr Res. 2012;138:150–156. doi: 10.1016/j.schres.2012.02.016. [DOI] [PMC free article] [PubMed] [Google Scholar]
- Dell’Acqua F, Simmons A, Williams SC, Catani M. Can spherical deconvolution provide more information than fiber orientations? Hindrance modulated orientational anisotropy, a true-tract specific index to characterize white matter diffusion. Hum Brain Mapp. 2013;34:2464–2483. doi: 10.1002/hbm.22080. [DOI] [PMC free article] [PubMed] [Google Scholar]
- Dobbing J, Sands J. Quantitative growth and development of human brain. Arch Dis Child. 1973;48:757–767. doi: 10.1136/adc.48.10.757. [DOI] [PMC free article] [PubMed] [Google Scholar]
- Eckerman CO, Didow SM. Toddlers social coordinations: changing responses to another’s invitation to play. Dev Psychol. 1989;25:794. [Google Scholar]
- Edlow BL, Takahashi E, Wu O, Benner T, Dai G, Bu L, Grant PE, Greer DM, Greenberg SM, Kinney HC, Folkerth RD. Neuroanatomic connectivity of the human ascending arousal system critical to consciousness and its disorders. J Neuropathol Exp Neurol. 2012;71:531–546. doi: 10.1097/NEN.0b013e3182588293. [DOI] [PMC free article] [PubMed] [Google Scholar]
- Eluvathingal TJ, Hasan KM, Kramer L, Fletcher JM, Ewing-Cobbs L. Quantitative diffusion tensor tractography of association and projection fibers in normally developing children and adolescents. Cereb Cortex. 2007;17:2760–2768. doi: 10.1093/cercor/bhm003. [DOI] [PMC free article] [PubMed] [Google Scholar]
- Fontes V. Estudos De Anatomia Macroscópica Do Sistema Nervoso Central Nas Crianças Portuguesas. Instituto de Antonio Aurelio de Costa Ferreira; Lisbon, Portugal: 1944. [Google Scholar]
- Frank LR. Characterization of anisotropy in high angular resolution diffusion-weighted MRI. Magn Reson Med. 2002;47:1083–1099. doi: 10.1002/mrm.10156. [DOI] [PubMed] [Google Scholar]
- Gao W, Lin W, Chen Y, Gerig G, Smith JK, Jewells V, Gilmore JH. Temporal and spatial development of axonal maturation and myelination of white matter in the developing brain. AJNR. 2009;30:290–296. doi: 10.3174/ajnr.A1363. [DOI] [PMC free article] [PubMed] [Google Scholar]
- Gazzaniga MS. Principles of human brain organization derived from split-brain studies. Neuron. 1995;14:217–228. doi: 10.1016/0896-6273(95)90280-5. [DOI] [PubMed] [Google Scholar]
- Geng X, Gouttard S, Sharma A, Gu H, Styner M, Lin W, Gerig G, Gilmore JH. Quantitative tract-based white matter development from birth to age 2 years. Neuroimage. 2012;2:542–557. doi: 10.1016/j.neuroimage.2012.03.057. [DOI] [PMC free article] [PubMed] [Google Scholar]
- Gilmore JH, Lin W, Corouge I, Vetsa YS, Smith JK, Kang C, Gu H, Hamer RM, Lieberman JA, Gerig G. Early postnatal development of corpus callosum and corticospinal white matter assessed with quantitative tractography. AJNR. 2007;28:1789–1795. doi: 10.3174/ajnr.A0751. [DOI] [PMC free article] [PubMed] [Google Scholar]
- Giorgio A, Watkins KE, Chadwick M, James S, Winmill L, Douaud G, De Stefano N, Matthews PM, Smith SM, Johansen-Berg H, James AC. Longitudinal changes in grey and white matter during adolescence. Neuroimage. 2010;49:94–103. doi: 10.1016/j.neuroimage.2009.08.003. [DOI] [PubMed] [Google Scholar]
- Gong G, Jiang T, Zhu C, Zang Y, Wang F, Xie S, Xiao J, Guo X. Asymmetry analysis of cingulum based on scale-invariant parameterization by diffusion tensor imaging. Hum Brain Mapp. 2005;24:92–98. doi: 10.1002/hbm.20072. [DOI] [PMC free article] [PubMed] [Google Scholar]
- Gotts SJ, Jo HJ, Wallace GL, Saad ZS, Cox RW, Martin A. Two distinct forms of functional lateralization in the human brain. Proc Natl Acad Sci U S A. 2013;110:3435–3444. doi: 10.1073/pnas.1302581110. [DOI] [PMC free article] [PubMed] [Google Scholar]
- Gredebäck G, Kochukhova O. Goal anticipating during action observation is influenced by synonymous action capabilities, a puzzling development study. Exp Brain Res. 2010;202:493–497. doi: 10.1007/s00221-009-2138-1. [DOI] [PubMed] [Google Scholar]
- Hasan KM, Kamali A, Iftikhar A, Kramer LA, Papanicolaou AC, Fletcher JM, Ewing-Cobbs L. Diffusion tensor tractography quantification of the human corpus callosum fiber pathways across the lifespan. Brain Res. 2009;1249:91–100. doi: 10.1016/j.brainres.2008.10.026. [DOI] [PMC free article] [PubMed] [Google Scholar]
- Heilbroner PL, Holloway RL. Anatomical brain asymmetries in new world and old world monkeys: stages of temporal lobe development in primate evolution. Am J Phys Anthropol. 1988;76:39–48. doi: 10.1002/ajpa.1330760105. [DOI] [PubMed] [Google Scholar]
- Hill J, Dierker D, Neil J, Inder T, Knutsen A, Harwell J, Coalson T, van Essen D. A surface-based analysis of hemispheric asymmetries and folding of cerebral cortex in term-born human infants. J Neurosci. 2010;30:2268–2276. doi: 10.1523/JNEUROSCI.4682-09.2010. [DOI] [PMC free article] [PubMed] [Google Scholar]
- Hochestetter F. Beitrage zur Entwicklungsgeschichte des Menschlichen Gehirns. Deuticke; Leipzig Wien: 1929. [Google Scholar]
- Holland BA, Haas DK, Norman D, rant-Zawadzki M, Newton TH. MRI of normal brain maturation. Am J Neuroradiol. 1986;7:201–208. [PMC free article] [PubMed] [Google Scholar]
- Hood B, Carey S, Prasada S. Predicting the outcomes of physical events: two-year-olds fail to reveal knowledge of solidity and support. Child Dev. 2000;71:1540–1554. doi: 10.1111/1467-8624.00247. [DOI] [PubMed] [Google Scholar]
- Howes C. Patterns of friendship. Child Dev. 1983;54:1041–1053. [Google Scholar]
- Huang H, Zhang J, Wakana S, Zhang W, Ren T, Richards LJ, Yarowsky P, Donohue P, Graham E, zan Zijl PCM, Mori S. White and gray matter development in human fetal, newborn and pediatric brains. Neuroimage. 2006;33:27–38. doi: 10.1016/j.neuroimage.2006.06.009. [DOI] [PubMed] [Google Scholar]
- Jbabdi S, Sotiropoulos SN, Savio AM, Graña M, Behrens TEJ. Model-based analysis of multishell diffusion MR data for tractography: how to get over fitting problems. Magn Reson Med. 2012;68:1846–1855. doi: 10.1002/mrm.24204. [DOI] [PMC free article] [PubMed] [Google Scholar]
- Jin Y, Shi Y, Joshi SH, Jahanshad N, Zhan L, de Zubicaray GI, McMahon KL, Martin NG, Wright MJ, Toga AW, Thompson PM. Heritability of white matter fiber tract shapes: a HARDI study of 198 twins. Multimodal Brain Image Anal. 2011:35–43. doi: 10.1007/978-3-642-24446-9_5. [DOI] [PMC free article] [PubMed] [Google Scholar]
- Jin Y, Shi Y, Zhan L, Gutman BA, de Zubicaray GI, McMahon KL, Wright MJ, Toga AW, Thompson PM. Automatic clustering of white matter fibers in brain diffusion MRI with an application to genetics. Neuroimage. 2014;100:75–90. doi: 10.1016/j.neuroimage.2014.04.048. [DOI] [PMC free article] [PubMed] [Google Scholar]
- Kamali A, Flanders AE, Brody J, Hunter JV, Hasan KM. Tracing superior longitudinal fasciculus connectivity in the human brain using high resolution diffusion tensor tractography. Brain Struct Funct. 2014;219:269–281. doi: 10.1007/s00429-012-0498-y. [DOI] [PMC free article] [PubMed] [Google Scholar]
- Kasprian G, Langs G, Brugger PC, Bittner M, Weber M, Arantes M, Prayer D. The prenatal origin of hemispheric asymmetry: an in utero neuroimaging study. Cereb Cortex. 2011;21:1076–1083. doi: 10.1093/cercor/bhq179. [DOI] [PubMed] [Google Scholar]
- Keen R, Shutts K. Object and event representation in toddlers. Prog Brain Res. 2007;164:227–235. doi: 10.1016/S0079-6123(07)64012-6. [DOI] [PMC free article] [PubMed] [Google Scholar]
- Keitel A, Prinz W, Friederici AD, von Hofsten C, Daum MM. Perception of conversations: the importance of semantics and intonation in children’s development. J Exp Child Psychol. 2013;116:264–277. doi: 10.1016/j.jecp.2013.06.005. [DOI] [PubMed] [Google Scholar]
- Kinney HC, Brody BA, Kloman AS, Gilles FH. Sequence of central nervous system myelination in human infancy. II. Patterns of myelination in autopsied infants. J Neuropathol Exp Neurol. 1988;47:217–234. doi: 10.1097/00005072-198805000-00003. [DOI] [PubMed] [Google Scholar]
- Lebel C, Beaulieu C. Lateralization of the arcuate fasciculus from childhood to adulthood and its relation to cognitive abilities in children. Hum Brain Mapp. 2009;30:3563–3573. doi: 10.1002/hbm.20779. [DOI] [PMC free article] [PubMed] [Google Scholar]
- Li W, Wu B, Batrachenko A, Bancroft-Wu V, Morey RA, Shashi V, Langkammer C, De Bellis MD, Ropele S, Song AW, Liu C. Differential developmental trajectories of magnetic susceptibility in human brain gray and white matter over the lifespan. Hum Brain Mapp. 2014;35:2698–2713. doi: 10.1002/hbm.22360. [DOI] [PMC free article] [PubMed] [Google Scholar]
- Lippé S, Martinez-Montes E, Arcand C, Lassonde M. Electrophysiological study of auditory development. Neuroscience. 2009;164:1108–1118. doi: 10.1016/j.neuroscience.2009.07.066. [DOI] [PubMed] [Google Scholar]
- Mesulam MM. Large-scale neurocognitive networks and distributed processing for attention, language, and memory. Ann Neurol. 1990;28:597–613. doi: 10.1002/ana.410280502. [DOI] [PubMed] [Google Scholar]
- Mori S, Tournier JD. Introduction to Diffusion Tensor Imaging. 1st. Academic Press; California: 2013. p. 140. [Google Scholar]
- Mukherjee P, Miller JH, Shimony JS, Phillip JV, Nehra D, Snyder AZ, Conturo TE, Neil JJ, McKinstry RC. Diffusion-tensor MR imaging of gray and white matter development during normal human brain maturation. AJNR. 2002;23:1445–1456. [PMC free article] [PubMed] [Google Scholar]
- Neil J, Miller J, Mukherjee P, Hüppi S. Diffusion tensor imaging of normal and injured developing human brain—a technical review. NBM. 2002;15:543–552. doi: 10.1002/nbm.784. [DOI] [PubMed] [Google Scholar]
- Neuner I, Kupriyanova Y, Stöcker T, Huang R, Posnansky O, Schneider F, Tittgemeyer M, Shah NJ. White-matter abnormalities in Tourette syndrome extend beyond motor pathways. Neuroimage. 2010;51:1184–1193. doi: 10.1016/j.neuroimage.2010.02.049. [DOI] [PubMed] [Google Scholar]
- Nowell MA, Grossman RI, Hackney DB, Zimmerman RA, Goldberg HI, Bilaniuk LT. MR imaging of white matter disease in children. AJR. 1988;151:359–365. doi: 10.2214/ajr.151.2.359. [DOI] [PubMed] [Google Scholar]
- O’Muircheartaigh J, Dean DC, III, Ginestet CE, Walker L, Waskiewicz N, Lehman K, Dirks H, Piryatinsky I, Deoni SCL. White matter development and early cognition in babies and toddlers. Hum Brain Mapp. 2014;35:4475–4487. doi: 10.1002/hbm.22488. [DOI] [PMC free article] [PubMed] [Google Scholar]
- Owen JP, Marco EJ, Desai S, Fourie E, Harris J, Hill SS, Arnett AB, Mukherjee P. Abnormal white matter microstructure in children with sensory processing disorders. Neuroimage Clin. 2013;2:844–853. doi: 10.1016/j.nicl.2013.06.009. [DOI] [PMC free article] [PubMed] [Google Scholar]
- Peng H, Orlichenko A, Dawe RJ, Agam G, Zhang S, Konstantinos A. Development of a human brain diffusion tensor template. Neuroimage. 2009;46:967–980. doi: 10.1016/j.neuroimage.2009.03.046. [DOI] [PMC free article] [PubMed] [Google Scholar]
- Penn RD, Trenko B, Baldwin L. Brain maturation followed by computed tomography. J Comput Assist Tomogr. 1980;4:614–616. doi: 10.1097/00004728-198010000-00007. [DOI] [PubMed] [Google Scholar]
- Peters BD, Szeszko PR, Radua J, Ikuta T, Gruner P, DeRosse P, Zhang JP, Giorgio A, Qiu D, Tapert SF, Brauer J, Asato MR, Khong PL, James AC, Gallego JA, Malhotra AK. White matter development in adolescence: diffusion tensor imaging and meta-analytic results. Schizophr Bull. 2012;38:1308–1317. doi: 10.1093/schbul/sbs054. [DOI] [PMC free article] [PubMed] [Google Scholar]
- Provenzale JM, Liang L, DeLong D, White LE. Diffusion tensor imaging assessment of brain white matter maturation during the first postnatal year. AJR. 2007;189:476–486. doi: 10.2214/AJR.07.2132. [DOI] [PubMed] [Google Scholar]
- Pyles JA, Verstynen TD, Schneider W, Tarr MJ. Explication the face perception network with white matter connectivity. PLoS One. 2013;8:e61611. doi: 10.1371/journal.pone.0061611. [DOI] [PMC free article] [PubMed] [Google Scholar]
- Racine AM, Adluru N, Alexander AL, Christian BT, Okonkwo OC, Oh J, Cleary CA, Birdsill A, Hillmer AT, Murali D, Barnhart TE, Gallagher CL, Carlsson CM, Rowley HA, Dowling NM, Asthana S, Sager M, Bendlin BB, Johnson SC. Associations between white matter microstrucutre and amyloid burden in preclinical Alzheimer’s disease: a multimodal imaging investigation. Neuroimage Clin. 2014;4:604–614. doi: 10.1016/j.nicl.2014.02.001. [DOI] [PMC free article] [PubMed] [Google Scholar]
- Rapoport JL, Castellanos FX, Gogate N, Janson K, Kohler S, Nelson P. Imaging normal and abnormal brain development: new perspectives for child psychiatry. Aust N Z J Psychiatry. 2001;35:272–281. doi: 10.1046/j.1440-1614.2001.00900.x. [DOI] [PubMed] [Google Scholar]
- Roine U, Roine T, Salmi J, Nieminen-Von Wendt T, Leppämäki S, Rintahaka P, Tani P, Leemans A, Sams M. Increased coherence of white matter fiber tract organization in adults with Asperger syndrome: a diffusion tensor imaging study. Autism Res. 2013;6:642–650. doi: 10.1002/aur.1332. [DOI] [PubMed] [Google Scholar]
- Schimdt HJ, Beauchamp GK. Adult-like odor preferences and aversions in three-year-old children. Child Dev. 1988;59:1136–1143. [PubMed] [Google Scholar]
- Schmahmann JD, Pandya DN, Wang R, Dai G, DArceuil HE, de Crespigny AJ, Wedeen VJ. Association fibre pathways of the brain: parallel observations from diffusion spectrum imaging and autoradiography. Brain. 2007;130:630–653. doi: 10.1093/brain/awl359. [DOI] [PubMed] [Google Scholar]
- Smith JP, Glass DJ, Fireman G. The understanding and experience of mixed motions in 3–5-year-old children. J Genet Psychol. 2015;176:65–81. doi: 10.1080/00221325.2014.1002750. [DOI] [PubMed] [Google Scholar]
- Song JW, Mitchell PD, Kolasinski J, Ellen Grant P, Galaburda AM, Takahashi E. Asymmetry of white matter pathways in developing human brains. Cereb Cortex. 2015;25:2883–2893. doi: 10.1093/cercor/bhu084. [DOI] [PMC free article] [PubMed] [Google Scholar]
- Takahashi E, Dai G, Wang R, Ohki K, Rosen GD, Galaburda AM, Grant PE, Wedeen VJ. Development of cerebral fiber pathways in cats revealed by diffusion spectrum imaging. Neuroimage. 2010;49:1231–1240. doi: 10.1016/j.neuroimage.2009.09.002. [DOI] [PMC free article] [PubMed] [Google Scholar]
- Takahashi E, Dai G, Rosen GD, Wang R, Ohki K, Folkerth RD, Galaburda AM, Wedeen VJ, Ellen Grant P. Developing neocortex organization and connectivity in cats revealed by direct correlation of diffusion tractography and histology. Cereb Cortex. 2011;21:200–211. doi: 10.1093/cercor/bhq084. [DOI] [PMC free article] [PubMed] [Google Scholar]
- Takahashi E, Folkerth RD, Galaburda AM, Grant PE. Emerging cerebral connectivity in the human fetal brain: an MR tractography study. Cereb Cortex. 2012;22:455–464. doi: 10.1093/cercor/bhr126. [DOI] [PMC free article] [PubMed] [Google Scholar]
- Takahashi E, Song JW, Folkerth RD, Grant PE, Schmahmann JD. Detection of cerebellar cortex and white matter pathways using high angular resolution diffusion tractography. Neuroimage. 2013;68:105–111. doi: 10.1016/j.neuroimage.2012.11.042. [DOI] [PMC free article] [PubMed] [Google Scholar]
- Takahashi E, Hayashi E, Schmahmann JD, Grant PE. Development of cerebellar connectivity in human fetal brains revealed by high angular resolution diffusion tractography. Neuroimage. 2014;96:326–333. doi: 10.1016/j.neuroimage.2014.03.022. [DOI] [PMC free article] [PubMed] [Google Scholar]
- Taoka T, Fujioka M, Sakamoto M, Miyasaka T, Akashi T, Ochi T, Hori S, Uchikoshi M, Xu J, Kichikawa K. Time course of axial and radial diffusion kurtosis of white matter infarctions: period of pseudonormalization. AJNR. 2014;35:1509–1514. doi: 10.3174/ajnr.A3908. [DOI] [PMC free article] [PubMed] [Google Scholar]
- Thiebaut de Schotten M, Ffytche DH, Bizzi A, Dell’Acqua F, Allin M, Walshe M, Murray R, Williams SC, Murphy DGM, Catani M. Atlasing location, asymmetry and inter-subject variability of white matter tracts in the human brain with MR diffusion tractography. Neuroimage. 2011;54:49–59. doi: 10.1016/j.neuroimage.2010.07.055. [DOI] [PubMed] [Google Scholar]
- Thompson RA. Development in the first years of life. Future Child. 2001;11:20–33. [PubMed] [Google Scholar]
- Thong JY, Du J, Ratnarajah N, Dong Y, Soon HW, Saini M, Tan MZ, Ta AT, Chen C, Qiu A. Abnormalities of cortical thickness, subcortical shapes, and white matter integrity in subcortical vascular cognitive impairment. Hum Brain Mapp. 2014;35:2320–2332. doi: 10.1002/hbm.22330. [DOI] [PMC free article] [PubMed] [Google Scholar]
- Tournier JD, Calamante F, Gadian DG, Connelly A. Direct estimation of the fiber orientation density function from diffusion-weighted MRI data using spherical deconvolution. Neuroimage. 2004;23:1176–1185. doi: 10.1016/j.neuroimage.2004.07.037. [DOI] [PubMed] [Google Scholar]
- Tournier JD, Calamante F, Connelly A. Robust determination of the fibre orientation distribution in diffusion MRI: non-negativity constrained super-resolved spherical deconvolution. Neuroimage. 2007;35:1459–1472. doi: 10.1016/j.neuroimage.2007.02.016. [DOI] [PubMed] [Google Scholar]
- Trojsi F, Corbo D, Caiazzo G, Piccirillo G, Monsurrò MR, Cirillo S, Esposito F, Tedeschi G. Motor and extramotor neurodegeneration in amyotrophic lateral sclerosis: a 3T high angular resolution diffusion imaging (HARDI) study. Amyotroph Lateral Scler Frontotemporal Degener. 2013;14:553–561. doi: 10.3109/21678421.2013.785569. [DOI] [PubMed] [Google Scholar]
- Tuch DS, Reese TG, Wiegall MR, Wedeen VJ. Diffusion MRI of complex neural architecture. Neuron. 2003;40:885–895. doi: 10.1016/s0896-6273(03)00758-x. [DOI] [PubMed] [Google Scholar]
- Uda S, Matsui M, Tanaka C, Uematsu A, Miura K, Kawana I, Noguchi K. Normal development of human brain white matter from infancy to early adulthood: a diffusion tensor imaging study. Dev Neurosci. 2015;37(2):182–194. doi: 10.1159/000373885. http://dx.doi.org/10.1159/000373885 (Epub 2015 Mar. 17) [DOI] [PubMed] [Google Scholar]
- Varentsova A, Zhang S, Arfanakis K. Development of a high angular resolution diffusion imaging human brain template. Neuroimage. 2014;91:177–186. doi: 10.1016/j.neuroimage.2014.01.009. [DOI] [PMC free article] [PubMed] [Google Scholar]
- Wedeen VJ, Wang RP, Schmahmann JD, Benner T, Tseng WY, Dai G, Pandya DN, Hagmann P, DArceuil H, de Crespigny AJ. Diffusion spectrum magnetic resonance imaging (DSI) tractography of crossing fibers. Neuroimage. 2008;41:1267–1277. doi: 10.1016/j.neuroimage.2008.03.036. [DOI] [PubMed] [Google Scholar]
- Whiten A, Flynn E, Brown K, Lee T. Imitation of hierarchical action structure by young children. Dev Sci. 2006;9:574–582. doi: 10.1111/j.1467-7687.2006.00535.x. [DOI] [PubMed] [Google Scholar]
- Widjaja E, Nilsson D, Blaser S, Raybaud C. White matter abnormalities in children with idiopathic developmental delay. Acta Radiol. 2008;49:589–595. doi: 10.1080/02841850801950087. [DOI] [PubMed] [Google Scholar]
- Williamson RA, Meltzoff AN. Own and others prior experiences influence children’s imitation of causal acts. Cogn Dev. 2011;26:260–268. doi: 10.1016/j.cogdev.2011.04.002. [DOI] [PMC free article] [PubMed] [Google Scholar]
- Xu G, Takahashi E, Folkerth RD, Haynes RL, Volpe JJ, Grant PE, Kinney HC. Radial coherence of diffusion tractography in the cerebral white matter of the human fetus: neuroanatomic insights. Cereb Cortex. 2014;24:579–592. doi: 10.1093/cercor/bhs330. [DOI] [PMC free article] [PubMed] [Google Scholar]
Associated Data
This section collects any data citations, data availability statements, or supplementary materials included in this article.