Abstract
An application of ion exchange chromatography for C-peptide analysis is described here. At the stage of C-peptide isolation, a strong cation exchanger (SP HP or MonoS) was used to purify the analyte from ballast proteins and peptides. The conditions of ion-exchange chromatographic separations were optimized using theoretical modeling of the net surface electric charge of the peptide as a function of pH. The purified and concentrated sample was further subjected to LC-MS/MS. In order to improve the reliability of analysis, two fragment ions were monitored simultaneously both for native C-peptide and internal standard, isotopically labeled C-peptides analogues (fragments with m/z of 927.7 and 147.2). Using ion-exchange chromatography, it became possible to process larger sample volumes, important for testing patients with very low C peptide levels, compared to currently used solid phase extraction methods.
Keywords: C-peptide, Isotope Dilution Assay, Reference Material, Ion Exchange Chromatography, Methanol Precipitation
1. Introduction
C-peptide is often used as indicator of insulin secretion levels in patients with diabetes mellitus. Being produced in equimolar concentration with insulin, C-peptide undergoes little metabolism by the liver, so its concentration in plasma is three to five times higher compared to insulin. C-peptide has high urinary clearance that results in its considerably higher concentration range in urine (40-150ng/ml) compared to blood plasma (0.5-10ng/ml) [1-3]. Human C-peptide is a relatively small 31 residue peptide with Mw 3020 (average mass). Since equimolar amounts of insulin and C-peptide are released from endocytic vesicles within the pancreas upon proteolytic cleavage of proinsulin, C-peptide measurements also allow assessing the β-cell function in insulin treated diabetes [1-5]. The technique of isotope dilution assay (IDA) has been employed for C-peptide quantitation by several investigators. The first report showing serum peptide quantification by Kippen et. al. [6] was published in 1996; subsequent publications by Fierens et. al. [7-9] and Rogatsky et. al. [10,11] described different approaches for C-peptide quantitation with the aim of optimizing sensitivity and achieving maximal assay precision.
Despite some differences in Mass Spectrometry procedures, for example using a negative electrospray mode [7-9] versus a positive one[10-12], each group confronted the same problem of C-peptide isolation from biological fluid (plasma or urine) and its concentration prior to loading for MS. For C-peptide purification from serum, a general procedure was proposed, which included solid phase extraction using Sep-Pak cartridges [6]. With some modifications, that procedure has been adopted by other researchers [7-12].
LC-MS/MS operating in multiple reaction-monitoring mode provides high specificity and it has been successfully used for accurate C-peptide quantification. Thienpont's group monitored the transition 1507>1320 for the C-peptide (1514>1334, for the labeled analogue) using negative electrospray mode [7]. Rogatsky et.al. in a series of papers followed the 1007.7>147.2 fragmentation and for the labeled standard (m/z=1027) the transition providing the same small fragment, 147.2, was monitored [10,11,13].
Both groups observed a so-called negative “matrix effect”, which has been named as one of the main reasons for difficulties with ionization and poor fragmentation efficiency [9,10]. To address this problem, Rogatsky et.al. proposed their two-dimensional chromatographic method [10]. Their approach consisted of using sequential reverse-phase chromatography (C5 and C18 columns). A narrow fractionation, of approximately one minute duration, was diverted to a second column where it was subjected to further fractionation. According to the authors' observations, the approach they used considerably increased the sensitivity of analysis by reducing the noise to signal ratio.
In this work we introduce a method for C-peptide detection which can potentially increase the sensitivity level sufficiently to analyze biological samples with very low C-peptide levels. For this purpose, we employed ion exchange chromatography at the stage of peptide isolation from human serum, which seemed to be a logical approach given the specific amino acid composition of C-peptide, see next section. In order to achieve higher specificity, we monitored two transitions for C-peptide fragmentation simultaneously in the MRM mode. Some technological improvements were also made in order to reduce the cost of analysis and make it more robust.
2. Experimental
2.1. Reagents
C-peptide fragment 3–33, synthetic analogue of native peptide, unlabeled (Mr 3017) - was obtained from Sigma-Aldrich (St. Louis, MO); isotopically labeled [2H8-Val7,10] C-peptide was from Bachem (Bubendorf, Switzerland).
A laboratory synthesized peptide which contained 14 residues labeled with 13C and 15N, H3N-EA*EDL*QV*GQV*EL*G*G*G*PG**A*GSL*QPL*A*L*EGSLQ-COOH, was provided by Dr. Daniel Stein from Albert Einstein College of Medicine, Bronx, NY. All other chemicals were purchased from Sigma-Aldrich.
2.2. Instrumentation
LC-MS/MS quantitative analysis was performed using an API-4000 triple quadrupole mass spectrometer (AB Sciex, Foster City, CA) coupled to a Shimadzu Prominence LC system (Shimadzu Scientific Instruments, Columbia, MD). Reverse-phase chromatography was performed using a Varian Pursuit C18 column (50 × 2.1 mm, 300A, Varian Inc., Palo Alto, CA).
2.3. Sample pretreatment
Frozen plasma samples were mixed with methanol (up to 1 to 4 ratio, v/v), then subjected to centrifugation (5 min at 12g) to remove precipitated proteins. The supernatant was diluted 1:2 with eluent A (0.4% formic acid in water) in the case of direct injection.
Stock standard solutions (100 ng/μL) were made by dissolving non-labeled or labeled C-peptide in water. These preparations were further diluted to working standards containing 0.1 ng/μL immediately before analysis; for C-peptide quantification, one tenth (v/v) of standard solution was added to the sample prior to methanol precipitation. For purification using cation exchangers (HiTrap SP cartridges and MonoS, GE Healthcare), the pH of the sample was adjusted with formate ammonium buffer (50mM, pH3.7). Ultrafiltration was done with Centricon devices, Ultracel regenerated cellulose membranes, with nominal molecular mass cut-off values of 10000 and 3000Da (Millipore, Billerica, MA).
2.4. LC- MS/MS conditions
From the final purified material, up to 70 μl was directly injected into the LC system. The gradient started with 40% eluent B (0.4% formic acid in methanol), the content of B was then increased linearly to 70% at 15 minutes at a flow rate of 0.3 ml/minute. Under these chromatographic conditions, C-peptide eluted at approximately nine minutes. The column was then two cycles washed with eluent B gradient and re-equilibrated for ten minutes prior to the next injection. MS/MS measurements were performed in positive electrospray tandem mode following different transitions for C-peptide and its labeled analogue (two transitions were monitored for the prime component of naturally occurring C-peptide: m/z 1007.7–> 927.8 and 1007.7–> 147.2). At the same time the isoforms of C-peptide were monitored in SIM mode. Prior to the MRM transition experiments we acquired mass spectra for two commercially available synthesized C-peptides from Sigma-Aldrich and Bachem.
2.5. Theoretical simulation of the C-peptide net electric charge vs. pH
The method of estimation of the net electric charge of a protein molecule as a function of pH is a useful tool for many different applications in separation science [14-17]. More generally, the approach can be applied to any substance containing so-called ionogenic groups participating in acid-base equilbria. The details can be found elsewhere [14, 16, 18]. The method contains some intrinsic limitations primarily connected with the idealized dissociation scheme used [18], when the dissociation process assumed to be independent for any ionogenic group involved and the dissociation constant values are taken as they are reported for single amino acids. Here we used the data provided by Hirokawa [19].
3. Results and discussion
3.1. C-peptide isolation procedure using ion exchangers
For most protein and peptide isolations, different strategies can be employed potentially with equal success. Ion exchangers can used to adsorb the analyte on the charged matrix when an appropriate pH range is selected. Alternatively, the protein of interest can be allowed go through the column without interaction while the ballast proteins and peptides can be effectively retained. It is generally assumed that a charged protein is effectively retained by the ion exchanger of the opposite sign charge, however there is some experimental evidence of deviation from this simple rule (see [20], for example); this could be explained by electrostatic interactions of higher orders as well as possible hydrophobic interactions.
The charge versus pH curve, or so-called “titration curve” for the C-peptide is shown in Fig.1. The nature of C-peptide is quite specific: the sequence does not contain any amino acid residues with side chains capable of contributing to a positive charge. Of the total 31 amino acids, there are five residues with charged side chains, all of which are acidic and contribute thereby to a negative charge (four glutamic acids (pK4.2) and one aspartic acid (pK4.5)). The other groups that contribute to the net charge are the N-terminal and C-terminal group. Thus, there exists only one basic group in the peptide. To achieve balance between the total negative and positive charges, the pH should be relatively low so that all of the acidic groups are almost completely protonated. For this reason C-peptide has an isoelectric point around pH3.
Figure 1.
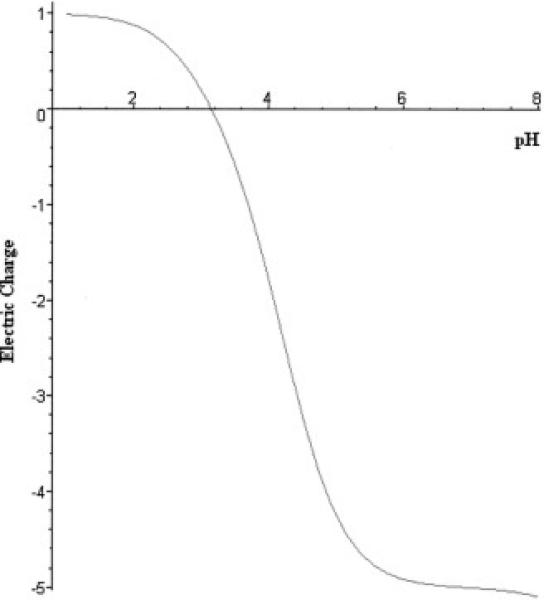
Theoretically calculated net electric charge versus pH for C-peptide. The lack of amino acids for which side groups contribute to a positive charge results in a low isoelectric point value (pI=3.15).
This specific property of C-peptide makes it possible to apply a very simple but effective purification scheme. Applying a starting solution with a pH slightly above the C-peptide isoelectric point to a cation exchanger will allow C-peptide to pass through the column while trapping most of impurities. This strategy was successfully realized with use of strong cation exchangers (disposable HiTrap SP cartridges or a MonoS column). For the ion exchange purification stage, the pH range 3.5-4 was initially selected based on the theoretical predictions. The first series of experiments were quite successful, despite the fact that the method of theoretical modeling in general can be considered only approximation [16].
The general scheme of C-peptide analysis included methanol precipitation as an initial stage to reduce the amount of ballast proteins. This was adopted for the general procedure using a 1:4 dilution. As mentioned before for plasma or serum samples, a high concentration of methanol used at that stage requires that the sample has to be diluted again before application to the LC. Still, one of the direct benefits of the procedure is the alcohol compatibility with dialysis membranes in the event that ultra-filtration is subsequently performed. Also, when methanol is used for gradient elution with reverse-phase chromatography, the sample preparation procedure for LC-MS involves only a simple dilution with eluent A to the corresponding concentration at the beginning of the gradient.
Total C-peptide recovery after methanol precipitation and chromatographic purification was evaluated by collecting the exact volume applied to the column plus extra 0.5mL (that roughly corresponds to the void volume of HiTrap SP cartridges). Using this procedure the recovery was 85%.
Figure 2 illustrates the effectiveness of the chromatographic purification with a strong cation exchanger. The figure represents the sample before it is concentrated. Here the total ion count is shown in selected ion monitoring mode for a sample treated with a cation exchanger and untreated (Figure 2A and Figure 2B, respectively). The samples (treated and untreated) were applied to LC -MS with the same conditions, except the treated sample was effectively depleted of ballast proteins. The ballast protein peaks seem to be effectively removed from the purified sample as it can be seen from the mass spectrogram comparison; C-peptide is hardly detectable before purification and the right part of the gradient on the mass spectrogram shows an extremely high nose level. Another illustration is the use of ultra-filtration (UF). We observed that it is impossible to perform the UF procedure for a non-treated sample as the dialysis membrane (10KD cutoff and lower) soon becomes clogged.
Figure 2.
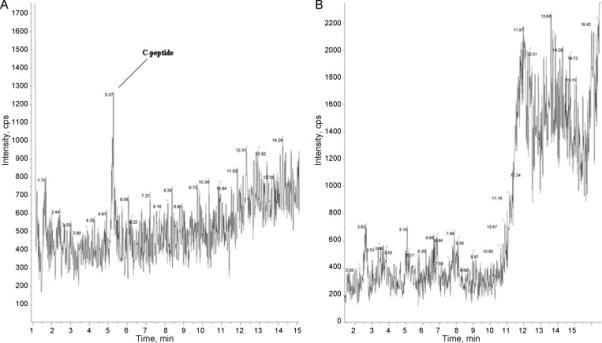
LC-MS of serum sample purified with cation exchange chromatography. Single ion monitoring for 1007.7 ion (unit resolution). Upper and low panels show initial and purified samples, respectively. Treated and untreated were applied to LC -MS by the same conditions. The content of ballast proteins is essentially reduced as can be seen from the right part of the chromatogram.
3.2 LC– Mass Spectrometry
The purification on an ion exchanger allowed us to perform sample concentration up to twenty times or more higher compared to previous studies [7]. For example, we can process several mL of plasma or serum and, after processing, the final sample volume can be brought to one hundred μL or lower by UF or by lyophilization followed by reconstitution. The same concentration factor could be achieved as easily in case of lyophilization only, but it would not be possible to apply the untreated sample to a chromatographic column without overloading due to the presence of ballast proteins. We also compared LC-MS analysis of C-peptide in a methanol vs. acetonitrile gradient. Higher signal levels were observed in methanol, but at low C-peptide concentrations signal intensity becomes low that, probably, connected with less effective ionization efficiency for the system considered.
The isotope dilution (ID) standards we used with equal success were two different labeled C-peptide analogues: [2H8-Val7,10] from Bachem and a laboratory synthesized peptide which contained 14 residues labeled with 13C and 15N. Both standards exhibit the same chromatographic retention times in experiments. These synthetic peptides were also used for optimization of the separation and MS conditions.
By the conditions specified in Materials and Methods (section 2.4), triple protonated ions (3+) were the most predominant, although 2+ and 4+ ions were clearly visible as well. Figure 3 shows an ESI MS spectrum for [2H8-Val7,10] labeled C-peptide analogue in the range m/z 700-1700; this interval covers species with 2, 3 and 4 degrees of ionization. Heterogeneity of the internal standard is clearly visible. This phenomenon can potentially prevent accurate quantitation and should be addressed in the future research.
Figure 3.
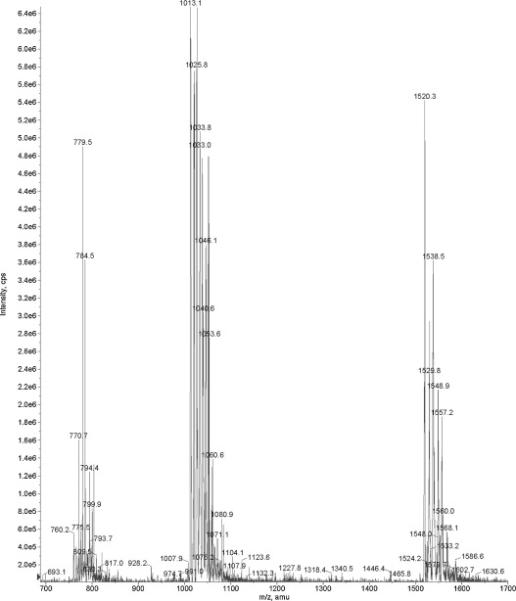
ESI MS spectrum for the C-peptide standard, [2H8-Val7,10] labeled (Bachem). Three plus ionization state is the predominate state for C-peptide by the conditions used. The heterogeneity of synthetic peptide is clearly visible.
In Figure 4, the mass spectra are shown for purified and concentrated C-peptide from a human serum sample. SIM shows a high intensity peak corresponding to the C-peptide (1007.7) in the first upper panel; the second panel shows the Bachem isotopically labeled synthesized analogue (1013.0).
Figure 4.
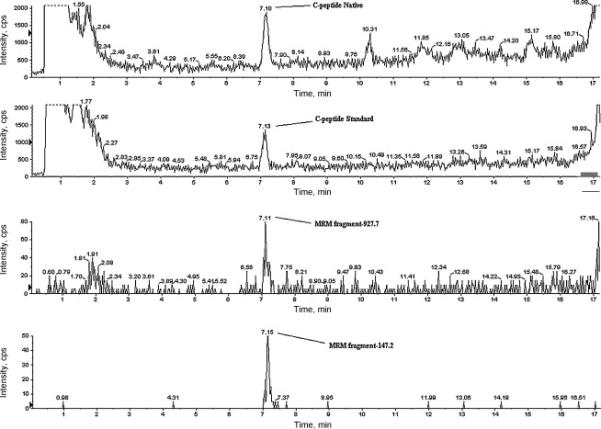
Purified and concentrated C-peptide from human serum sample analyzed in SIM and MRM. SIM shows a high intensity peak corresponding to the C-peptide (1007.7) in the first upper panel; the second panel represents the standard, deuterium labeled [2H8-Val7,10] synthesized analogue (1013.0). The two lower panels show the two MRM transitions for the native C-peptide: 1007.7-147.2 and 1007.7-927.8. In this experiment a concentration factor of twenty is achieved compared to sample purified with the cation exchanger.
To ensure the proper identification of C-peptide, we also monitored the MRM transition for two fragments (1007.7-147.2 and 1007.7-927.8). For the MRM, the collision energy was 36 eV and declusterizing potential was set at 62.
The first transition was used by Rogatsky and Stein in their work [10]; the authors observed only one transition suitable for monitoring [10,11]. In contrast, we found an additional fragment ion, 927.8, giving us a signal of comparable intensity (Figure 4 – third and fourth panels). This fragment corresponds to C-terminal nine residue peptide, PLALEGSLQ. Thus, native C-peptide allows detection with two transitions, both occurring with good efficiency. The same two fragments appears for the isotopically labeled [2H8-Val7,10] analogue, while M+30 labeled (13C, 15N) standard is capable of generating only one fragment with good efficiency (147.2), see Table 1.
Table 1.
MRM transitions used for native C-peptide and its labeled analogues analysis.
| Native C-peptide | 1007.7->927.8 | 1007.7->147.2 |
| Labeled [2H8-Val7,10] | 1013.0->927.8 | 1013.0->147.2 |
| Labeled (13C, 15N, M+30) | - | 1017.7->147.2 |
In our opinion, simultaneous monitoring of two transitions assists the differentiation of false-positive signals. We observed such a signal in SIM mode for 1007.8 ion, which further showed one of the above fragments in MRM transition, but not both. The probability of false-positive signals increases when complex samples are not adequately purified.
4. Method validation
Linearity
Being initially tested with the standard the method shown good linearity over a range of 0.010-3 ng. Figure 5A shows C-peptide signal area as the total load (volume) on the column progressively increases for standard solution of 10ng/mL (r2=.998; y=0.99+0.0013, in dimensionless form). For the experiments shown in Figure 5B, a series of progressive dilutions of an initial serum sample of fixed concentration (1nMol/L) was made and C-peptide concentration was determined. Fig. 5B represent a normalized signal intensity versus concentration, a unit corresponds to 1 nMol/L (r2=.9981; y=0.993x-0.007).
Figure 5.
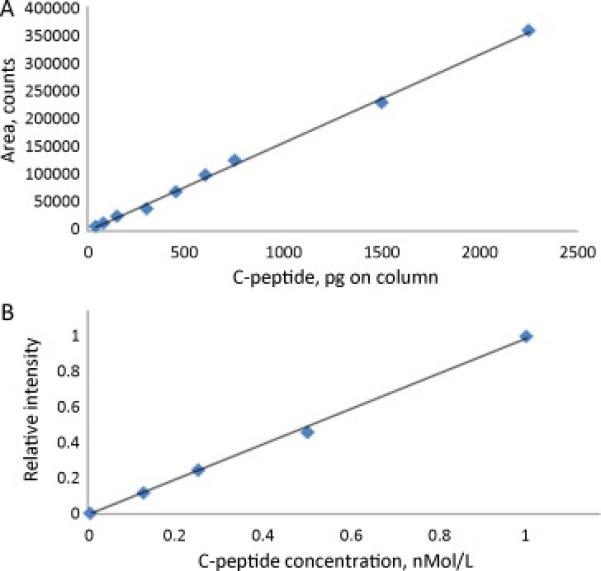
Linearity of C-peptide signal response in LC-MS.
A: C-peptide signal area versus the total load on column. Pure C-peptide standard is used, 10 ng/mL.
B: C-peptide concentration measured for a series of progressive dilutions of the initial serum sample of fixed concentration. Normalized signal intensity is shown.
Precision
Intra-assay CVs were found to be in the range 2.0-3.7%. For the total precision, the calculated CV was 4.5%.
Method Comparison
Fifty serum specimens, representing a range of C-peptide values 0.265-1.96 nMol/L and collected from healthy volunteers have been analyzed by ID MS. Additionally, for thirty samples the C-peptide concentration was determined by Immunoassay (AIA-600 II, Tosoh Bioscience, South San Francisco, CA). Compared to the immunoassay, the ID MS results were on average 32% lower. This may be due to the ability of immunoassay methods to recognize various isoforms of C-peptide different in their molecular mass, or due to crossreactivity.
5. Conclusions
An ion-exchange chromatographic method has been developed for C-peptide isolation and further analysis by LC-MS. The method utilizes one step cation exchange purification. The method allows processing high sample volumes that is important when the C-peptide concentration is low. For the MS/MS analysis, a simultaneous monitoring of two transitions (1007.7-147.2 and 1007.7-927.8) proposed here can potentially increase the specificity of analysis.
Highlights.
Due to specific nature of C-peptide (low Isoelectric Point), cation exchange chromatography allows very fast and efficient purification of C-peptide from serum
First time for C-peptide analysis, two MRM transition has been used simultaneously that increases the specificity o C-peptide detection
The approach allows proceeding much higher sample volumes compared to previous studies when only hydrophobic interactions are used
Acknowledgments
We gratefully acknowledge financial support by NIH/NIDDK (No. 200200409985).
Footnotes
Publisher's Disclaimer: This is a PDF file of an unedited manuscript that has been accepted for publication. As a service to our customers we are providing this early version of the manuscript. The manuscript will undergo copyediting, typesetting, and review of the resulting proof before it is published in its final citable form. Please note that during the production process errors may be discovered which could affect the content, and all legal disclaimers that apply to the journal pertain.
References
- 1.Kuzuya H, Blix PM, Horwitz DL, Rubinstein AH, Steiner DF, Binder C, Faber OK. Diabetes. 1978;27:184. doi: 10.2337/diab.27.1.s184. [DOI] [PubMed] [Google Scholar]
- 2.Steiner DF. New England Journal of Medicine. 1969;280:1106. doi: 10.1056/NEJM196905152802008. [DOI] [PubMed] [Google Scholar]
- 3.Rubinstein AH, Clark JL, Melani F, Steiner DF. Nature. 1969;224:697. doi:10.1038/224697a0. [Google Scholar]
- 4.Polonsky KS, Licinio-Paixao J, Given BD, Pugh W. J. Clin. Invest. 1986;77:98. doi: 10.1172/JCI112308. [DOI] [PMC free article] [PubMed] [Google Scholar]
- 5.Polonsky KS, Given BD, Hirsch L, Shapiro ET. J. Clin. Invest. 1988;81:435. doi: 10.1172/JCI113338. [DOI] [PMC free article] [PubMed] [Google Scholar]
- 6.Kippen AD, Cerini F, Vadas L, Stöcklin R, Vu L, Offord RE, Rose K. J. Biol. Chem. 1997;272:12513. doi: 10.1074/jbc.272.19.12513. doi: 10.1074/jbc.272.19.12513. [DOI] [PubMed] [Google Scholar]
- 7.Fierens C, Thienpont LM, Stockl D, Willekens E, De Leenheer AP. J. Chromatogr. A. 2000;896:275. doi: 10.1016/s0021-9673(00)00717-2. [DOI] [PubMed] [Google Scholar]
- 8.Fierens C, Stockl D, Baetens D, De Leenheer AP, Thienpont LM. J. Chromatogr. B Analyt. Technol. Biomed. Life Sci. 2003;792:249. doi: 10.1016/s1570-0232(03)00268-x. [DOI] [PubMed] [Google Scholar]
- 9.Fierens C, Stockl D, Baetens D, De Leenheer AP, Thienpont LM. Clin. Chem. 2003;49:992. doi: 10.1373/49.6.992. [DOI] [PubMed] [Google Scholar]
- 10.Rogatsky E, Balent B, Goswami G, Tomuta V, Stein D. Clin. Chem. 2006;52:872. doi: 10.1373/clinchem.2005.063081. [DOI] [PubMed] [Google Scholar]
- 11.Rogatsky E, Tomuta V, Cruikshank G, Vele L, Jayatillake H, Stein D. J. Sep. Sci. 2006;29:529. doi: 10.1002/jssc.200500369. [DOI] [PubMed] [Google Scholar]
- 12.Stockl D, Cabaleiro DR, Thienpont LM. Rapid Commun. Mass Spectrom. 2004;18:3140. doi: 10.1002/rcm.1716. [DOI] [PubMed] [Google Scholar]
- 13.Rogatsky E, Tomuta V, Cruikshank G, Jayatillake H, Vele L, Stein D. J. Sep. Sci. 2007;30:226. doi: 10.1002/jssc.200600250. [DOI] [PubMed] [Google Scholar]
- 14.Castagnola M, Messana I, Cassiano L, Rabino R, Rossetti DV, Giardina B. Electrophoresis. 1995;16:1492. doi: 10.1002/elps.11501601247. [DOI] [PubMed] [Google Scholar]
- 15.Edsall JT, Wyman J. Biophysical Chemistry I. Academic Press Inc; 1958. [Google Scholar]
- 16.Righetti PG, Stoyanov AV, Zhukov M. The Proteome Revisited: Theory and Practice of All Relevant Electrophoretic Steps. Elsevier; Amsterdam: 2001. [Google Scholar]
- 17.Baskin EM, Bukshpan S, Korol L. Phys. Biol. 2006;3:101. doi: 10.1088/1478-3975/3/2/002. [DOI] [PubMed] [Google Scholar]
- 18.Stoyanov AV, Righetti PG, Chromatogr J. A. 1999;853:35. doi: 10.1016/s0021-9673(99)00455-0. [DOI] [PubMed] [Google Scholar]
- 19.Hirokawa T, Suginoa R, Kisoa Y. J. Chromatogr. 1991;585:364. doi: 10.1016/0021-9673(91)85105-o. [DOI] [PubMed] [Google Scholar]
- 20.Kopaciewicz W, Rounds MA, Fausnaugh J, Regnier F. J. Chromatogr. 1983;266:3. [Google Scholar]


