
Figure 4. Non-phosphorylated NTD promotes xCPEB4 distribution in cytoplasmic granules.
(A, B) Representative image of (A) full-length eGFP-xCPEB4 or (B) the N-terminal domain, using the wild-type (WT) or phosphorylation mutants 12A or 12D (with the 12 phosphorylation sites mutated to alanine or aspartic acid, respectively), transfected in U2OS cells. As controls, eGFP and eGFP-RBD (RNA-binding domain) were used. Merge images show eGFP in green and DAPI in blue. Scale bar, 25 µm. (C, D) Quantification of the different expression patterns observed in Figure 4A (C) and Figure 4B (D). 100 cells were analysed and classified as having a granular (grey bars) or diffuse (white bars) expression pattern. The percentage of cells with each phenotype was calculated from three independent biological replicates. Results are shown as means and SEM. Significance was addressed with a Sidak’s multiple comparisons test. *p<0.05; ns, non-significant. (E, F) Average cell intensity (n = 100 cells) of the cells analysed in Figure 4C (E) and Figure 4D (F). Results are shown as means (SD). Significance was determined by the Student’s t-test. *p<0.05; ns, non-significant. See also Figure 4—figure supplement 1–2.

Figure 4—figure supplement 1. Expression of eGFP-xCPEB4 variants.
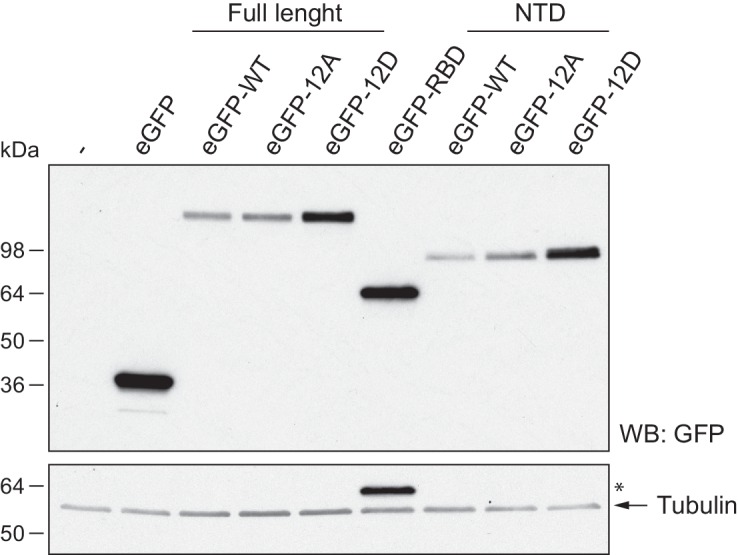
Figure 4—figure supplement 2. xCPEB4 cytoplasmic granules are distinct from P-bodies or stress granules.
