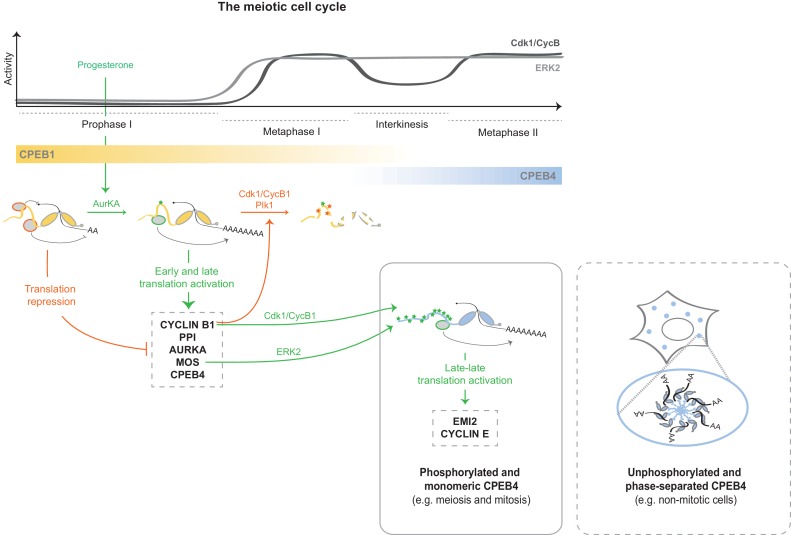
Figure 9. Model to illustrate the sequential and coordinated functions of CPEB1 and CPEB4 in the meiotic cell cycle.
The different meiotic phases, as well as the activity profiles of ERK2 (light grey) and Cdk1/cyclin B (dark grey) along meiosis, are shown at the top. The sequential expression and function of xCPEB1 (yellow) and xCPEB4 (blue) are shown below. Orange ovals represent CPEB repression complexes. Orange arrows and orange phosphorylation events (*) indicate inhibitory effects. Green ovals represent CPEB activation complexes. Green arrows and green phosphorylation events (*) indicate activating effects. mRNAs activated in the different waves of cytoplasmic polyadenylation are shown in grey boxes. The phase-separation and inactivation that unphosphorylated CPEB4 experiences in non-mitotic cells is represented in the dashed box.

