

Abstract
Background:
Among nondiabetic individuals, higher fasting blood glucose (FBG) independently predicts diabetes risk, cardiovascular disease, and dementia. Ambient PM2.5 (particulate matter with aerodynamic diameter ≤ 2.5 μm) is an emerging determinant of glucose dysregulation. PM2.5 effects and mechanisms are understudied among nondiabetic individuals.
Objectives:
Our goals were to investigate whether PM2.5 is associated with an increase in FBG and to explore potential mediating roles of epigenetic gene regulation.
Methods:
In 551 nondiabetic participants in the Normative Aging Study, we measured FBG, and DNA methylation of four inflammatory genes (IFN-γ, IL-6, ICAM-1, and TLR-2), up to four times between 2000 and 2011 (median = 2). We estimated short- and medium-term (1-, 7-, and 28-day preceding each clinical visit) ambient PM2.5 at each participant’s address using a validated hybrid land-use regression satellite-based model. We fitted covariate-adjusted regression models accounting for repeated measures.
Results:
Mean FBG was 99.8 mg/dL (SD = 10.7), 18% of the participants had impaired fasting glucose (IFG; i.e., 100–125 mg/dL FBG) at first visit. Interquartile increases in 1-, 7-, and 28-day PM2.5 were associated with 0.57 mg/dL (95% CI: 0.02, 1.11, p = 0.04), 1.02 mg/dL (95% CI: 0.41, 1.63, p = 0.001), and 0.89 mg/dL (95% CI: 0.32, 1.47, p = 0.003) higher FBG, respectively. The same PM2.5 metrics were associated with 13% (95% CI: –3%, 33%, p = 0.12), 27% (95% CI: 6%, 52%, p = 0.01) and 32% (95% CI: 10%, 58%, p = 0.003) higher odds of IFG, respectively. PM2.5 was negatively correlated with ICAM-1 methylation (p = 0.01), but not with other genes. Mediation analysis estimated that ICAM-1 methylation mediated 9% of the association of 28-day PM2.5 with FBG.
Conclusions:
Among nondiabetics, short- and medium-term PM2.5 were associated with higher FBG. Mediation analysis indicated that part of this association was mediated by ICAM-1 promoter methylation.
Citation:
Peng C, Bind MA, Colicino E, Kloog I, Byun HM, Cantone L, Trevisi L, Zhong J, Brennan K, Dereix AE, Vokonas PS, Coull BA, Schwartz JD, Baccarelli AA. 2016. Particulate air pollution and fasting blood glucose in nondiabetic individuals: associations and epigenetic mediation in the Normative Aging Study, 2000–2011. Environ Health Perspect 124:1715–1721; http://dx.doi.org/10.1289/EHP183
Introduction
Clinically diagnosed diabetes is preceded by a long latent period of abnormal glucose metabolism (American Diabetes Association 2012). In the asymptomatic, nondiabetic range of glycemia (< 126 mg/dL) (American Diabetes Association 2012), increased fasting blood glucose (FBG) levels are already independently associated with the development of diabetes (Tirosh et al. 2005), cardiovascular disease (Duckworth 2001; Levitan et al. 2004; Sarwar et al. 2010), and dementia (Crane et al. 2013). FBG variations in this range are often underappreciated and their potential determinants, especially those not directly related to lifestyle, are understudied. Ambient particulate matter (PM) pollution has recently been suggested as an emerging risk factor for metabolic disorders including impaired glucose regulation (Esposito et al. 2016; Rajagopalan and Brook 2012). Cross-sectional and longitudinal studies have revealed that PM is associated with increased risk of diabetes (Andersen et al. 2012; Brook et al. 2008; Puett et al. 2011) and with higher levels of markers of insulin resistance (Kelishadi et al. 2009). However, the relationship between PM and glycemia in the nondiabetic range has yet to be studied.
The underlying mechanisms linking PM and abnormal glucose regulation are also not fully understood. Inflammation is central in both PM-associated responses and the pathogenesis of glucose dysregulation. Evidence from previous studies has linked exposures to ambient PM with lower DNA methylation in inflammatory genes (Bind et al. 2012, 2014). DNA methylation, through the addition of a methyl group to the 5C position of cytosine in the CpG dinucleotide sequence, is a well-studied epigenetic modification that usually silences gene expression (Newell-Price et al. 2000). Conversely, lower or no methylation has been associated with upregulated gene expression. Lower global methylation content across the human epigenome has been associated with hyperglycemia and the up-regulation of inflammatory genes in peripheral leukocytes from patients with type 2 diabetes mellitus (T2DM) (Luttmer et al. 2013; Nilsson et al. 2014). Yet, the role of methylation of specific genes related to inflammation in mediating the effects of PM on FBG has not been investigated.
In a repeated measure study of older men in the Greater Boston Area, we investigated the association between ambient PM2.5 (PM with aerodynamic diameter ≤ 2.5 μm) concentrations at the participants’ addresses—estimated over different time windows up to 1 month before the visit—and FBG levels among nondiabetic participants. Using recently developed repeated measure mediation analysis, we further examined whether and to what extent PM2.5 increased FBG through changes in blood leukocyte methylation in candidate inflammatory genes. We examined methylation of inflammatory cytokines [interferon gamma (IFN-γ) and interleukin-6 (IL-6)], intercellular adhesion molecule-1 (ICAM-1), and Toll-like receptor 2 (TLR-2). We hypothesized that higher PM2.5 levels associated with increased FBG, and part of this association was mediated through methylation of inflammatory genes.
Materials and Methods
Study Population
The Normative Aging Study is a prospective longitudinal cohort established in 1963 by the U.S. Veterans Administration in the Greater Boston area (Power et al. 2011). Briefly, participants underwent examinations every 3–5 years. Self-administered questionnaires were collected at each visit providing information on sociodemographic characteristics, medical history, medications, and lifestyle. Blood samples were collected at each clinical visit, after an overnight fast and smoking abstinence (see Figure S2). Starting from year 2000, estimated concentrations of PM2.5 were obtained from a hybrid spatiotemporal prediction model, as described in the next section. A total of 656 participants had complete information on PM2.5 measurements from the prediction model, FBG, and blood leukocyte DNA methylation for at least one and up to four visits between 2000 and 2011 (median = 2, IQR = 1). We excluded 105 participants who, at their first visit, were clinically diabetic (FBG ≥ 126 mg/dL at the visit) and were taking diabetes medications. Therefore, our final study population included 551 participants. Fifty-two participants were diagnosed with diabetes during subsequent visits: For these individuals, we retained observations from the visit(s) before they were diagnosed with diabetes. One hundred and eighty-six participants came to just one clinical visit, 163 participants came to two clinical visits, and 202 participants came to three or more clinical visits. Participants provided signed informed consent at each visit. The study was approved by the Institutional Review Boards of the participating institutions.
Air Pollution and Temperature
We estimated PM2.5 concentrations at each participant’s residential address using a hybrid land use regression and satellite-based model (Kloog et al. 2012; Madrigano et al. 2013). In brief, we utilized MODIS (Moderate Resolution Imaging Spectroradiometer) satellite-derived aerosol optical depth (AOD) measurements to predict daily PM2.5 concentration levels at a 10 km spatial resolution. Daily AOD was calibrated using ground PM2.5 measurements from 78 monitoring stations, land use regression and meteorological variables. To estimate PM2.5 daily concentrations in each grid cell, we calibrated the AOD-PM2.5 relationship using data from grid cells with both monitor and AOD values, using mixed models with random slopes for day and nested regions. In a later stage, we estimated exposures on days when AOD measures were not available (e.g., due to cloud cover or snow). Model performance was good with high out-of-sample 10-fold cross-validated R 2 (mean out-of-sample R 2 = 0.83 and 0.81 for days with and without available AOD data, respectively) (Kloog et al. 2011).
Temperature values were obtained through the national climatic data center. Only continuous operating stations that collected data on a daily basis were used (26 stations). Grid cells were matched to the closest weather station for meteorological variables.
DNA Methylation Measurements
Gene-specific DNA methylation was quantified on buffy-coat DNA using bisulfite polymerase-chain-reaction pyrosequencing (Yang et al. 2004). In the Normative Aging Study, we generated pyrosequencing-based methylation data for nine genes across pathways related to oxidation, blood clotting, and inflammation (Bind et al. 2012; Lepeule et al. 2012, 2014). We chose to focus our analysis on the four inflammatory genes included in these genes, including two inflammatory cytokines (IFN-γ and IL-6), intercellular adhesion molecule 1 (ICAM-1), and Toll-like receptor 2 (TLR-2). The choice of these four inflammatory genes was aligned with previous literature on PM and inflammation, as well as subclinical inflammation and the risk of T2DM (Bind et al. 2012; Blüher et al. 2002; Herder et al. 2013; Madrigano et al. 2010; van Eeden et al. 2001; Vossoughi et al. 2014). Specifically, IFN-γ and IL-6 encode for inflammatory cytokines that facilitate cell-to-cell communications in the inflammatory cascade, ICAM-1 encodes for a glycoprotein that is often expressed on the cell surface of endothelial cells and leukocytes, ICAM-1 glycoproteins are important for cell surface adhesion, transmigration and homing of leukocytes from the circulation to the target tissue. TLR-2 encodes for a surface receptor protein, which recognizes conservative molecular patterns and serves as first-line defense in innate immunity. DNA methylation levels were measured for each of these genes at two to five CpG sites within the promoter region except for IL-6 methylation, which was measured within 500 base-pair downstream of the gene’s promoter region where nuclear respiratory factor-1 (NRF-1) binding sites are located (see Figure S1). The methylation of NRF-1 region is known to suppress IL-6 gene expression (Choi et al. 2004). We calculated and used the mean level of position-specific DNA methylation for each gene because they are highly correlated and are likely to share most of the same functional complexes and traits, and we assumed that mean methylation across the promoter region reflects regional epigenetic regulation (Bind et al. 2014).
Fasting Blood Glucose Measurement
Blood glucose levels were measured at each visit, after an overnight fast and were analyzed using the enzymatic hexokinase method. According to American Diabetes Association criteria, FBG less than 100 mg/dL corresponds to normal levels and the 100–125 mg/dL range to impaired fasting blood glucose (IFG), which in older individuals often progresses to diabetes over time. FBG larger than 125 mg/dL is defined as clinical diabetes (American Diabetes Association 2008, 2012).
Statistical Analysis of the Main Association of PM2.5 Levels with FBG
We evaluated the association between PM2.5 levels and FBG (modeled as a continuous dependent variable) using linear mixed-effects regression with subject-specific intercepts to account for the correlation among repeated FBG measurements within the same individual. Exposure variables included averages of PM2.5 concentrations for 1-, 7-, and 28-day preceding each clinical visit; we considered each moving average in a separate regression model. Model estimates are expressed per interquartile range (IQR) increase in PM2.5 concentration. In the models, we adjusted for the following covariates selected a priori: age (continuous), body mass index [BMI; weight (kg)/height (m)2, continuous], race (white or others), regular patterns of physical activity (< 12 hr/week, ≥ 12 and < 30 hr/week, ≥ 30 hr/week), smoking status (never, former, or current smoker), cumulative pack-years of smoking (continuous), alcohol consumption (< 2 or ≥ 2 drinks/day), education level (high school diploma or less, college degree, or graduate degree), statin use (nonuser, current user), temperature (continuous), and seasonality. Seasonality was modeled using Fourier series terms cos(2π * doy/365.25) and sin(2π * doy/365.25), where doy represents day of year. We checked the linearity assumptions of the continuous covariates using cubic splines and found no deviation from linear dose response.
In Equation 1, the main regression model took the general form:
Yij = β0 + ui + β1X1ij + … + βpXpij + βPM2.5PM2.5 + εij, [1]
where i corresponds to each participant, j to the visit; β0 to the intercept for the population mean; ui to the subject-specific random intercept. β1X1ij to βpXpij correspond to the covariates we selected a priori. βPM2.5PM2.5 corresponds to PM2.5 levels 1-, 7-, or 28-day prior to the clinical visits, depending on the moving average used in each set of models. εij is the within-subject error term.
In a secondary analysis, we considered a dichotomized FBG variable for impaired fasting glucose (IFG) (categorized using the 0–100 mg/dL and 100–125 mg/dL ranges) as the outcome and evaluated the association between PM2.5 and the odds of IFG using a logistic regression model with generalized estimating equations (GEE) and empirical variance estimates to account for repeated measurements per subject.
In Equation 2, the logistic regression model took the general form:
logit [Pr(Yij = 1)] = β0 + β1Xij + … + βpXij + βPM2.5PM2.5ij, [2]
where i corresponds to each participant, j to the visit; β0 to the intercept for the population mean. β1Xij to βpXij corresponds to the covariates we selected a priori. βPM2.5PM2.5ij corresponds to PM2.5 levels 1-, 7-, and 28-day prior to the clinical visits, respectively. Yij = 0 indicates subject i is not defined as IFG at visit j; Yij = 1 indicates subject i is IFG at visit j.
To account for potential selection bias due to loss of follow-up, we repeated our analyses using inverse probability weighting. Specifically, in a logistic regression, we predicted the probability of coming to a subsequent visit based on covariates from the previous one, including age, BMI, regular patterns of physical activity, smoking status, pack-year smoked, FEV1 and FVC ratio, medication (diuretics and beta blockers), and education level.
Statistical Analysis of DNA Methylation and Mediation Analysis
Selection of mediators. We hypothesized that associations of PM2.5 with FBG could be mediated through changes in gene-specific methylation of inflammatory biomarkers. We considered the four inflammation genes—IFN-γ, IL-6, ICAM-1 and TLR-2—separately in the mediation analysis. To approximate normality of the residuals, we used IFN-γ and IL-6 on their original scale and log-transformed ICAM-1 and TLR-2.
For DNA methylation of a specific gene to be considered as a potential mediator, we tested the following criteria a) if there was an association between exposure and mediator; and b) if there was an association between mediator and outcome (Baron and Kenny 1986; Valeri and Vanderweele 2013). We also examined the presence of PM-mediator interactions and found no evidence of interactions that changed FBG levels.
Underlying assumptions. To obtain valid estimates of the natural indirect effects, we adjusted for potential exposure–outcome confounders (denoted as C1), exposure–mediator confounders (denoted as C2), and mediator–outcome confounders (denoted as C3), which included age, BMI, race, regular patterns of physical activity, smoking status, cumulative pack-years smoked, alcohol consumption, education level, statin use, temperature, seasonality, batch of methylation measurement, percentages of lymphocytes, and percentage of neutrophils. We assumed no unmeasured confounding for a) PM2.5-FBG relation, b) methylation-FBG relation, c) PM2.5-methylation relation, after fitting the linear mixed-effects models with subject-specific intercepts and controlling for C1, C2, and C3. In addition, we also assumed that no methylation–FBG confounders would be affected by PM2.5 exposure.
Due to the longitudinal nature of the study, changes in FBG at one visit could potentially affect gene-specific methylation at the subsequent visit [Yij → Mij + 1 (dotted arrow in Figure 1)]. FBG at one visit therefore may serve as a potential mediator-outcome confounder for the subsequent visit and may introduce bias in our estimates (Diggle et al. 2013). Therefore, in Equation 3, we tested the presence of an association between Yij and Mij + 1, to check the assumption of time-varying confounding:
Figure 1.
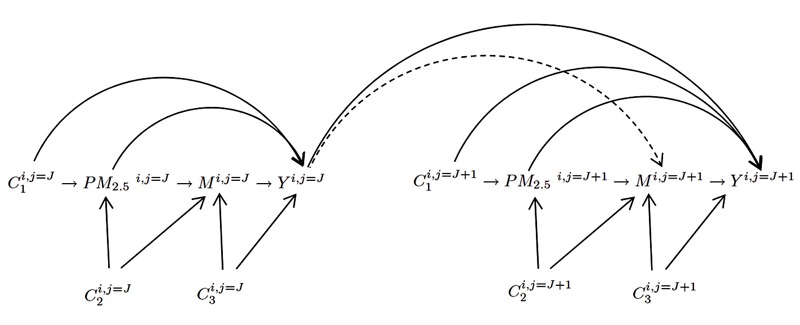
Directed acyclic graph (DAG) for mediation analysis. PM2.5 i,j = J represents air pollution exposure for ith subject prior to j = Jth visit; Mi,j = J represents gene-specific DNA methylation for ith subject at jth visit; Yi,j = J represents fasting blood glucose (FBG) concentrations for ith subject at jth visit. C1 i,j represents exposure outcome confounders; C2 i,j represents exposure mediator confounders; C3 i,j represents mediator outcome confounders. Note: to be simplified, correlations between repeated measures of exposures (i.e., PM2.5ij and PM2.5ij + 1), repeated measures of mediators (i.e., Mij and Mij + 1) and repeated measures of confounders (i.e., Cij and Cij + 1) are not shown in this DAG.
Mij + 1 = α0 + ui + α1Yij + … + αpXpij + αPM2.5PM2.5ij + εij, [3]
where i corresponds to each participant and j to the visit; α0 to the intercept for the population mean; ui to the subject-specific random intercept. Mij + 1 corresponds to DNA methylation at subsequent visit. Yij corresponds to FBG measurement. α1X1ij to αpXpij correspond to the covariates we selected a priori. αPM2.5PM2.5 corresponds to PM2.5 levels 1-, 7-, and 28-day prior to the clinical visits, respectively. εij is the within-subject error term.
Mediation analysis. We fitted two linear mixed-effects models with random intercepts simultaneously, one modeling the exposure–mediator association, and one modeling the mediator–outcome association (Bauer et al. 2006; Bind et al. 2016) (Equations 4 and 5):
Mij = β0 + ui + β1X1ij + … + βpXpij + βPM2.5PM2.5ij + εij, [4]
Yij = γ0 + g0i + γ 1X1ij + … + γ pXpij + γ PM2.5PM2.5ij + γ MMij + ηij, [5]
where i corresponds to each participant and j to the visit; β0 and γ0 to the intercept for the population mean; ui and g0i to the subject-specific random intercept. β1X1ij to βpXpij and γ pXpij to γ pXpij correspond to the covariates we selected a priori. Mij corresponds to DNA methylation and Yij corresponds to FBG measurement. βPM2.5PM2.5 corresponds to PM2.5 levels 1-, 7-, and 28-day prior to the clinical visits in the exposure–mediator association, and γ MMij corresponds to DNA methylation in the mediator-outcome association. εij and ηij are the within-subject error terms.
γ PM2.5 corresponds to the natural direct effect, and the natural indirect effect (also called “mediated” effect) is given by the product of βPM2.5 × γ M. The delta method was used to calculate the variance of the natural indirect effect, which corresponds to Var (γ M) βPM2.5 2 + 2Cov(βPM2.5, γ M) βPM2.5 γM + Var(βPM2.5) γ M 2. Proportion mediated is calculated as the percentage of natural indirect effect over the sum of natural direct and natural indirect effect (i.e., {[βPM2.5 × γ M/(βPM2.5 × γ M + γ PM2.5)]}).
In sensitivity analysis, we tested the robustness of the study findings to the no-unmeasured confounding assumptions: a) we excluded participants who were current smokers to better control for residual confounding by smoking; b) we additionally controlled for total calorie intake and glycemic index to reduce potential mediator–outcome confounding from diet; c) we also restricted the analysis to participants with a C-reactive protein (CRP) level < 10 mg/L to partially remove potential effects from acute inflammation.
All analyses were conducted with SAS (version 9.3; SAS Institute Inc.), using PROC MIXED to fit the linear mixed effect models and PROC GENMOD to fit the GEE models.
Results
Descriptive Statistics
A total of 1,152 FBG measurements were collected from the 551 nondiabetic participants in this study. Table 1 describes participant characteristics at their first visit. Mean FBG concentration at the first visit was 99.8 ± 10.7 mg/dL (mean ± SD) and 18% of participants at the first visit had IFG (i.e., blood glucose between 100 mg/dL and 125 mg/dL). Summary statistics of PM2.5 and temperature during the study period are presented in Table S1.
Table 1.
Characteristics of the Normative Aging Study participants included in the analysis, 2000–2011.
| Variable | Visit 1 | Visit 2 | Visit 3 | Visit 4 |
|---|---|---|---|---|
| Note: Cohort participants with diabetes were excluded. | ||||
| Age (years), mean ± SD | 73.3 ± 6.9 | 75.6 ± 6.4 | 77.9 ± 5.9 | 78.5 ± 5.8 |
| BMI (kg/m2), mean ± SD | 27.8 ± 3.7 | 27.4 ± 3.7 | 27.1 ± 3.6 | 27.5 ± 3.9 |
| Smoking status, n (%) | ||||
| Never | 165 (30%) | 112 (31%) | 71 (34%) | 14 (33%) |
| Former | 363 (66%) | 244 (67%) | 135 (64%) | 1 (2%) |
| Current | 23 (4%) | 7 (2%) | 5 (2%) | 28 (65%) |
| Pack-years, mean ± SD | 19.9 ± 24.7 | 18.7 ± 23.1 | 17.1 ± 21.3 | 16.0 ± 11.5 |
| Race, n (%) | ||||
| White | 543 (97%) | 354 (98%) | 203 (96%) | 42 (98%) |
| Other | 17 (3%) | 9 (2%) | 8 (4%) | 1 (2%) |
| Metabolic equivalent of task, n (%) | ||||
| Low (≤ 12 hr/week) | 353 (64%) | 222 (61%) | 129 (61%) | 26 (60%) |
| Medium (12–30 hr/week) | 111 (20%) | 89 (25%) | 47 (22%) | 10 (23%) |
| High (≥ 30 hr/week) | 87 (16%) | 52 (14%) | 35 (17%) | 7 (16%) |
| Two or more drinks per day, n (%) | 102 (19%) | 69 (19%) | 35 (17%) | 4 (9%) |
| Education, n (%) | ||||
| < 12 years | 181 (33%) | 119 (32%) | 63 (30%) | 11 (26%) |
| 13–16 years | 253 (46%) | 163 (45%) | 98 (46%) | 24 (56%) |
| > 16 years | 115 (21%) | 81 (22%) | 50 (24%) | 8 (19%) |
| Statin use, n (%) | 196 (36%) | 180 (50%) | 122 (58%) | 24 (56%) |
| Fasting blood glucose (mg/dL) | 99.8 ± 10.7 | 98.9 ± 10.0 | 99.0 ± 10.5 | 99.0 ± 11.5 |
| Impaired fasting blood glucose, n (%) | 100 (18%) | 54 (15%) | 38 (18%) | 7 (16%) |
| Blood IFN-γ methylation, mean ± SD | 84.3 ± 5.9 | 85.0 ± 4.8 | 85.3 ± 4.7 | 85.3 ± 5.5 |
| Blood IL-6 methylation, mean ± SD | 43.6 ± 10.3 | 43.5 ± 10.2 | 43.8 ± 10.3 | 42.8 ± 11.5 |
| Blood ICAM methylation, mean ± SD | 4.3 ± 1.8 | 3.9 ± 1.2 | 4.4 ± 1.2 | 4.8 ± 1.9 |
| Blood TLR2 methylation, mean ± SD | 3.1 ±1.3 | 3.0 ± 1.4 | 2.5 ± 1.4 | 1.9 ± 1.0 |
Main Association of PM2.5 Levels with FBG
PM2.5 levels were associated with increased FBG (Table 2). For an IQR increase in PM2.5 concentration in the previous 1-day (IQR = 5.73 μg/m3), 7-day (IQR = 4.25 μg/m3), and 28-day (IQR = 3.12 μg/m3), FBG increased 0.57 mg/dL [95% confidence inverval (CI): 0.02, 1.11, p-value = 0.04], 1.02 mg/dL (95% CI: 0.41, 1.63, p-value = 0.001), and 0.89 mg/dL (95% CI: 0.32, 1.47, p-value = 0.003), respectively. We also found associations of PM2.5 concentrations with IFG (i.e., FBG > 100 mg/dL), particularly for the longer moving averages of PM2.5 (Table 3). IQR increases in PM2.5 in the previous 1-day (IQR = 5.73 μg/m3), 7-day (IQR = 4.25 μg/m3) and 28-day (IQR = 3.12 μg/m3) exposure windows were associated with OR equal to 1.13 (95% CI: 0.97, 1.33, p-value = 0.12), 1.27 (95% CI: 1.06, 1.52, p-value = 0.01) and 1.32 (95% CI: 1.10, 1.58, p-value = 0.003) for IFG, respectively. We also obtained similar estimates when we used inverse probability weighting to reduce potential selection bias (see Table S2).
Table 2.
Estimated change (and 95% CI) in fasting blood glucose level (mg/dL) per interquartile range increase in PM2.5 concentration averaged over the corresponding time window before each visit.
| PM2.5 concentration | Participants n | Observations n | PM2.5 interquartile range (IQR) | Estimated change (95% CI) in FBG per IQR increase in PM2.5 concentrations | p-Value |
|---|---|---|---|---|---|
| Results from linear mixed-effects regression models accounting for correlation across multiple visits and adjusted for age, BMI, race, regular patterns of physical activity, smoking status, pack-years smoked, alcohol consumption, education level, statin use, temperature, and seasonality. Participants with diabetes were excluded. | |||||
| 1-day moving average | 551 | 1,152 | 5.71 μg/m3 | 0.57 (0.02, 1.11) | 0.04 |
| 7-day moving average | 551 | 1,152 | 4.28 μg/m3 | 1.02 (0.41, 1.63) | 0.001 |
| 28-day moving average | 551 | 1,152 | 3.09 μg/m3 | 0.89 (0.32, 1.47) | 0.003 |
Table 3.
Odds ratio (and 95% CI) of impaired fasting blood glucose (IFG) per interquartile range (IQR) increase in PM2.5 concentration averaged over the corresponding time window before each visit.
| PM2.5 concentration | Participants n | Observations n | PM2.5 interquartile range (IQR) | Odds ratio (95% CI) of IFG per IQR increase in PM2.5 concentrations | p-Value |
|---|---|---|---|---|---|
| Note: IFG is defined as a fasting blood glucose level > 100mg/dL and < 126 mg/dL. Results from GEE models accounting for correlation across multiple visits and adjusted for age, BMI, race, regular patterns of physical activity, smoking status, pack-years smoked, alcohol consumption, education level, statin use, temperature, and seasonality. Participants with diabetes were excluded. | |||||
| 1-day moving average | 551 | 1,152 | 5.73 μg/m3 | 1.13 (0.97, 1.33) | 0.12 |
| 7-day moving average | 551 | 1,152 | 4.25 μg/m3 | 1.27 (1.06, 1.52) | 0.01 |
| 28-day moving average | 551 | 1,152 | 3.12 μg/m3 | 1.32 (1.10, 1.58) | 0.003 |
DNA Methylation and Mediation Analysis
PM2.5 showed a negative association with ICAM-1 methylation, which, in turn, was negatively associated with FBG (Figure 2). Methylation of IFN-γ, IL-6 and TLR-2 showed no association with FBG. We also found no evidence of PM2.5-mediator interactions that changed FBG levels. Since a mediator needs to be associated with both the exposure and the outcome (Baron and Kenny 1986; Valeri and Vanderweele 2013), we conducted the analysis of mediation only for ICAM-1 methylation. We examined the correlations between ICAM-1 methylation and the other three genes and found no substantial correlations, which suggests that the separate analyses are fairly appropriate.
Figure 2.
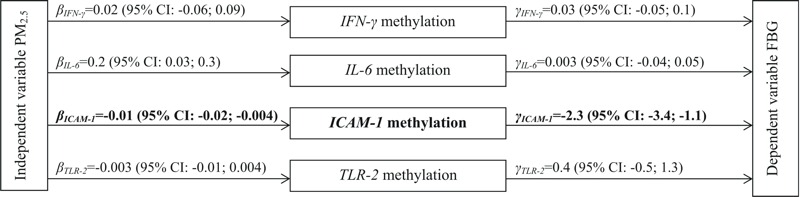
Inflammatory candidate gene methylation mediator model of the relationship between PM2.5 concentration and fasting blood glucose level. ICAM-1 mean and TLR-2 mean DNA methylation is log-normally distributed and IL-6 and IFN-γ are normally distributed. β is the coefficient of the independent variable (PM2.5 28-day moving average) when regressing the mediator (candidate gene methylation) on the independent variable, γ is the coefficient of the mediator when regressing the dependent variable (FBG) on both the independent variable and the mediator. Results from regression models are adjusted for age, BMI, race, regular patterns of physical activity, smoking status, pack-years smoked, alcohol consumption, education level, statin use, batch effects, percentage of lymphocytes, and percentage of neutrophils. Participants with diabetes were excluded.
Before conducting the mediation analysis, we examined whether FBG levels at one visit (Yij) affected ICAM-1 methylation at the subsequent visit (Mij + 1) (i.e., FBGij ≥ ICAM-1 ij + 1; dotted arrow in Figure 1), because it could potentially confound the mediator–outcome association and bias our estimates (Hernán et al. 2004). We found no association between Yij (FBGij) and Mij + 1 (ICAM-1 ij + 1). Point estimates were negligible (see Table S3). When we introduced a lag time and examined the effect of ICAM-1 methylation on FBG levels in the subsequent visit (i.e., ICAM-1 ij ≥ FBGij + 1), we also did not find an association (point estimate = –0.14, 95% CI: –1.93, 1.65).
Table 4 presents the natural direct effect, the natural indirect effect, and proportion mediated for ICAM-1 methylation over the different PM2.5 moving averages. We fitted the exposure–mediator and the mediator–outcome model simultaneously and found substantial mediation effects of PM2.5 on FBG through a decrease in ICAM methylation for the 28-day exposure time window. The proportion mediated was larger (9%) for the 28-day exposure window, but small and negligible for the 1-day and 7-day moving averages.
Table 4.
Mediation effect investigating whether blood ICAM-1 methylation mediates the association between air pollution and fasting blood glucose level. Indirect effect represents the mediated effect through the ICAM-1 methylation pathway.
| PM2.5 concentration | Exposure to mediator association (βPM2.5) | Mediator to outcome association (γM) | Mediated effect of ICAM-1 methylation | Proportion mediated |
|---|---|---|---|---|
| Note: Estimates correspond to 1-μg/m3 increase in PM2.5 concentration. Results from linear mixed-effects regression models accounting for correlation across multiple visits and adjusted for age, BMI, race, regular patterns of physical activity, smoking status, pack-years smoked, alcohol consumption, education level, statin use, temperature, seasonality, batch effect, % of lymphocytes, and % of neutrophils. Participants with diabetes were excluded. aProportion mediated cannot be estimated in this case because βPM2.5 and γM have opposite signs. | ||||
| 1-day moving average | 0.004 (–0.008, 0.008) | –2.65 (–4.41, –0.89) | –0.01 (–0.02, 0.004) | —a |
| 7-day moving average | –0.0004 (–0.007, 0.006) | –2.69 (–4.45, –0.93) | 0.001 (–0.02, 0.02) | 1% |
| 28-day moving average | –0.01 (–0.02, –0.004) | –2.47 (–4.23, –0.72) | 0.03 (0.0001, 0.06) | 9% |
We conducted further sensitivity analysis to examine if our results were robust to the no-unmeasured confounding assumptions required in the mediation analysis approach we used. Specifically, we excluded current smokers to limit residual confounding from smoking; we additionally controlled for total calorie intake and glycemic index to reduce potential confounding from diet; and we restricted the analysis to participants with a CRP level < 10 mg/L to partially remove effect from acute inflammation. Proportion mediated for ICAM-1 methylation for the 28-day exposure time window was 9%, 7%, and 10%, respectively (see Table S4).
Discussion
In the present study, we showed that PM2.5 concentrations estimated at the participants’ address were associated with higher FBG levels among nondiabetic individuals, as well as with higher odds of IFG. We also observed significant associations of lower blood ICAM-1 methylation, which is expected to up-regulate the expression of ICAM-1 in blood leukocytes, with both higher PM2.5 levels and higher FBG levels.
Our study is consistent with previous epidemiology studies indicating that ambient PM is associated with metabolic dysregulation (Andersen et al. 2012; Brook et al. 2008; Eze et al. 2015; Puett et al. 2011; Rajagopalan and Brook 2012). Nevertheless, most previous studies either focused on T2DM or evaluated blood glucose over its entire range, including individuals with diabetes. The non-diabetic and pre-diabetic population represents an ideal target for primary prevention, which, however, has been understudied in air pollution research. Our findings of PM2.5 associations with FBG in this group may help identify individuals who are particularly susceptible to changes in FBG in the nondiabetic range. It is important to notice that the small changes in FBG resulted in significant odds of IFG, owing to the fact that many people are very close to 100 mg/dL in this older population, and a very small change in FBG may be enough to pass the threshold.
Our mediation analysis suggests that ICAM-1 methylation in blood leukocytes served as a mediator of the association between PM2.5 and FBG, and we observed significant mediated effect at 28-day exposure time window. Our finding of higher concentrations of PM2.5 associated with lower methylation of the ICAM-1 gene, which is expected to result in higher ICAM-1 expression, is consistent with previous literature indicating that elevated concentrations of PM are associated with an increase in expression of endothelial markers (Bind et al. 2012; Madrigano et al. 2010; O’Neill et al. 2007; Rückerl et al. 2006). The ICAM-1 glycoprotein is responsible for leukocyte adhesion, homing, and transmigration during inflammatory responses (Rahman and Fazal 2009). Exposure to PM2.5 may cause local inflammation in the lungs and promote circulating leukocytes in blood to transmigrate to the target tissue through the up-regulation of adhesion molecules on the endothelial cell surface. Recent observational and intervention studies have linked elevated concentrations of plasma endothelial adhesion molecules with markers of insulin resistance and increased risk of T2DM (Blüher et al. 2002; Hak et al. 2001; Meigs et al. 2004). The ICAM-1 glycoprotein may facilitate migration of leukocytes from the blood to the adipose tissue (Mendez et al. 2013; Rao et al. 2015; Sun et al. 2009), which could result in local inflammation and subsequently insulin resistance. Alternatively, the ICAM-1 glycoprotein may also facilitate leukocyte transmigration to the pancreas (Yagi et al. 1995), which could affect beta-cell function and result in impaired insulin secretion. Although the observed association was relatively modest, our estimates were comparable to many other studies evaluating the association between ambient air pollution and DNA methylation with similar exposure levels (Guo et al. 2014; Madrigano et al. 2011). DNA methylation is measured as a percentage, which indicates the proportion of cells, or more accurately of haploid genomes, which show methylation at the sequence being analyzed. The differences in DNA methylation reported in our study are related to the presence upon PM2.5 exposure of higher numbers of circulating blood cells within no methylation at the ICAM-1 promoter. Further research is needed to determine whether these cells correspond to a specific leukocyte population with known function and their potential roles in relation to PM2.5 effects.
Conversely, methylation on the cytokine genes investigated (i.e., IFN-γ and IL-6) was not implicated as a mediator in this study. Many pro- and anti-inflammatory cytokines act in concert to trigger the inflammatory cascade. Future research may expand the number of inflammatory cytokines investigated and examine their joint effects.
One interesting aspect of the human methylome is that it exhibits both dynamic and static patterns. For instance, methylation of imprinted genes and genes drives tissue lineage commitment and differentiation that is established during embryogenesis and persists through life (Li et al. 1993); on the other hand, DNA methylation of inflammatory genes may change rapidly after environmental insults (Guo et al. 2014; Hou et al. 2014; Tarantini et al. 2009). Our results are consistent with the dynamic nature of methylation levels in inflammatory pathways, which allows for fine tuning of inflammatory responses. Nevertheless, we are aware that differences in DNA methylation do not necessarily translate into gene expression changes. DNA methylation is only one of the regulatory machineries that control gene expression. Other regulatory mechanisms, such a transcription factor activation, histone modification, chromatin remodeling and RNA silencing may also contribute to regulation of gene expression at various stages.
This study has a number of strengths. We estimated concentrations of PM2.5 at the residential address for each participant using a state-of-art hybrid model. Estimates from this hybrid model serve as better surrogates relative to the standard use of data from monitoring stations for each participant’s actual exposure, and limit exposure misclassifications. We conducted analyses both on FBG as a continuous variable and on IFG, a dichotomized variable constructed using a well-established cutoff for preclinical alterations in glucose metabolism. These two sets of analyses produced highly consistent results. We used repeated measures, which were accounted for using linear mixed-effects models with subject specific intercepts for FBG and generalized linear equations (GEE) model with empirical variance for IFG. We conducted mediation analysis as a novel approach for DNA methylation studies. This approach is particularly useful for investigating effects due to environmental exposures. While Mendelian randomization—a method that relies on genotype data used as instrumental variables—is often proposed to identifying epigenetic mediation, this approach cannot be used for external risk factors, such as PM, which, due to their nature, are not associated with the participants’ genetic sequences (such as single nucleotide polymorphisms) (Relton and Davey Smith 2012). Finally, we measured DNA methylation in candidate genes by pyrosequencing, which yields high precision (Tost and Gut 2007).
Our study has a few notable limitations. We focused on correlations among DNA methylation and FBG at the same clinical visit. It is therefore difficult to disentangle the temporal relationship between DNA methylation and FBG concentrations. However, when we examined the effect of DNA methylation on FBG for the subsequent visit (i.e., ICAM-1 ij ≥ FBGij + 1), we did not find any association. We also found no association of FBG on ICAM-1 methylation at the subsequent visit (i.e., FBGij ≥ ICAM-1 ij + 1). These analyses confirm that the effects we observed represent short- and medium-term responses to PM2.5 and are not persistent over the 3–5 years between the medical visits. To obtain valid estimates for the natural indirect effects, we made the following assumptions: a) no-unmeasured confounding between PM2.5 concentration and FBG levels, b) no-unmeasured confounding between PM2.5 concentration and methylation, c) no-unmeasured confounding between methylation and FBG levels, and d) no methylation-FBG confounders affected by the exposure. We conducted a number of sensitivity analyses to test the robustness to the no-unmeasured confounding assumptions. We excluded participants who were current smokers to better control for residual confounding by smoking; we additionally controlled for total calorie intake and glycemic index, to limit potential confounding from diet; we also restricted the analysis to participants with a CRP level < 10 mg/L, to partially remove potential effect from acute inflammation. In addition, we assessed the validity of assumption d either based on subject knowledge or empirically (Bind et al. 2016). From previous subject knowledge, we assumed that PM2.5 concentration would not affect participants’ age, race, smoking status, and statin use, as well as the batch of methylation measurements and seasonality. We also tested whether PM2.5 concentration would influence participant’s BMI, regular patterns of physical activity, percentage of lymphocytes, and percentage of neutrophils, by regressing PM2.5 concentration on each of these potential confounders. None of the above mediator–outcome confounders in current analysis were affected by the exposure (p-values were 0.10, 0.54, 0.50, and 0.78, respectively). Another limitation of our study is the potential for measurement error in both the exposure and FBG. However, we expect both measurement errors to be nondifferential and therefore to attenuate—rather than to cause—the observed significant associations.
Conclusion
In conclusion, we found that PM2.5 concentrations are associated with higher FBG level, and this association was in part mediated through ICAM-1 gene methylation, particularly at the longer (28-day) moving average investigated. Our study demonstrates a novel approach of mediation analysis in epigenetic studies and highlights a mediating role of ICAM-1 gene methylation in air pollution–associated abnormal glucose metabolism. While the proportion mediated by ICAM-1 methylation alone is relatively modest, methylation of other genes not investigated in this study, independently or in combination with ICAM-1 methylation, may mediate larger proportions of PM2.5 effects. Future epigenome-wide studies are needed to determine the extent to which DNA methylation contributes to mediate environmental effects on human metabolism.
Supplemental Material
Acknowledgments
The authors would like to thank all Normative Aging Study participants. We are also indebted to J. Lepeule for sharing with us the codes we adapted to perform inverse probability weighting.
Footnotes
This work was supported by the National Institutes of Health (grants R01ES021733, R01ES015172, R01ES021357, and P30ES000002); the U.S. Environmental Protection Agency (grant RD-83479801); and the U.S. Department of Agriculture, Agricultural Research Service (contract 53-K06-510). The VA Normative Aging Study is supported by the Cooperative Studies Program/Epidemiology Research and Information Center of the U.S. Department of Veterans Affairs and is a component of the Massachusetts Veterans Epidemiology Research and Information Center, Boston, Massachusetts.
The views expressed in this paper are those of the authors and do not necessarily represent the views of the U.S. Department of Veterans Affairs.
The authors declare they have no actual or potential competing financial interests.
References
- American Diabetes Association. Standards of medical care in diabetes—2008. Diabetes Care. 2008;31(suppl 1):S12–S54. doi: 10.2337/dc08-S012. [DOI] [PubMed] [Google Scholar]
- American Diabetes Association. Diagnosis and classification of diabetes mellitus. Diabetes Care. 2012;35(suppl 1):S64–S71. doi: 10.2337/dc12-s064. [DOI] [PMC free article] [PubMed] [Google Scholar]
- Andersen ZJ, Raaschou-Nielsen O, Ketzel M, Jensen SS, Hvidberg M, Loft S, et al. Diabetes incidence and long-term exposure to air pollution: a cohort study. Diabetes Care. 2012;35:92–98. doi: 10.2337/dc11-1155. [DOI] [PMC free article] [PubMed] [Google Scholar]
- Baron RM, Kenny DA. The moderator-mediator variable distinction in social psychological research: conceptual, strategic, and statistical considerations. J Pers Soc Psychol. 1986;51:1173–1182. doi: 10.1037//0022-3514.51.6.1173. [DOI] [PubMed] [Google Scholar]
- Bauer DJ, Preacher KJ, Gil KM. Conceptualizing and testing random indirect effects and moderated mediation in multilevel models: new procedures and recommendations. Psychol Methods. 2006;11:142–163. doi: 10.1037/1082-989X.11.2.142. [DOI] [PubMed] [Google Scholar]
- Bind MA, Baccarelli A, Zanobetti A, Tarantini L, Suh H, Vokonas P, et al. Air pollution and markers of coagulation, inflammation, and endothelial function: associations and epigene-environment interactions in an elderly cohort. Epidemiology. 2012;23:332–340. doi: 10.1097/EDE.0b013e31824523f0. [DOI] [PMC free article] [PubMed] [Google Scholar]
- Bind MA, Lepeule J, Zanobetti A, Gasparrini A, Baccarelli A, Coull BA, et al. Air pollution and gene-specific methylation in the Normative Aging Study: association, effect modification, and mediation analysis. Epigenetics. 2014;9:448–458. doi: 10.4161/epi.27584. [DOI] [PMC free article] [PubMed] [Google Scholar]
- Bind MA, Vanderweele TJ, Coull BA, Schwartz JD. Causal mediation analysis for longitudinal data with exogenous exposure. Biostatistics. 2016;17:122–134. doi: 10.1093/biostatistics/kxv029. [DOI] [PMC free article] [PubMed] [Google Scholar]
- Blüher M, Unger R, Rassoul F, Richter V, Paschke R. Relation between glycaemic control, hyperinsulinaemia and plasma concentrations of soluble adhesion molecules in patients with impaired glucose tolerance or type II diabetes. Diabetologia. 2002;45:210–216. doi: 10.1007/s00125-001-0723-3. [DOI] [PubMed] [Google Scholar]
- Brook RD, Jerrett M, Brook JR, Bard RL, Finkelstein MM. The relationship between diabetes mellitus and traffic-related air pollution. J Occup Environ Med. 2008;50:32–38. doi: 10.1097/JOM.0b013e31815dba70. [DOI] [PubMed] [Google Scholar]
- Choi YS, Kim S, Kyu Lee H, Lee KU, Pak YK. In vitro methylation of nuclear respiratory factor-1 binding site suppresses the promoter activity of mitochondrial transcription factor A. Biochem Biophys Res Commun. 2004;314:118–122. doi: 10.1016/j.bbrc.2003.12.065. [DOI] [PubMed] [Google Scholar]
- Crane PK, Walker R, Larson EB. Glucose levels and risk of dementia. N Engl J Med. 2013;369:1863–1864. doi: 10.1056/NEJMc1311765. [DOI] [PubMed] [Google Scholar]
- Diggle PJ, Heagerty P, Liang KY, Zeger SL. Oxford, UK: Oxford University Press; 2013. Analysis of Longitudinal Data. [Google Scholar]
- Duckworth WC. Hyperglycemia and cardiovascular disease. Curr Atheroscler Rep. 2001;3:383–391. doi: 10.1007/s11883-001-0076-x. [DOI] [PubMed] [Google Scholar]
- Esposito K, Petrizzo M, Maiorino MI, Bellastella G, Giugliano D. Particulate matter pollutants and risk of type 2 diabetes: a time for concern? Endocrine. 2016;51:32–37. doi: 10.1007/s12020-015-0638-2. [DOI] [PubMed] [Google Scholar]
- Eze IC, Hemkens LG, Bucher HC, Hoffmann B, Schindler C, Künzli N, et al. 2015. Association between ambient air pollution and diabetes mellitus in Europe and North America: systematic review and meta-analysis. Environ Health Perspect 123 381 389, doi: 10.1289/ehp.1307823 [DOI] [PMC free article] [PubMed] [Google Scholar]
- Guo L, Byun HM, Zhong J, Motta V, Barupal J, Zheng Y, et al. Effects of short-term exposure to inhalable particulate matter on DNA methylation of tandem repeats. Environ Mol Mutagen. 2014;55:322–335. doi: 10.1002/em.21838. [DOI] [PMC free article] [PubMed] [Google Scholar]
- Hak AE, Pols HA, Stehouwer CD, Meijer J, Kiliaan AJ, Hofman A, et al. Markers of inflammation and cellular adhesion molecules in relation to insulin resistance in nondiabetic elderly: the Rotterdam study. J Clin Endocrinol Metab. 2001;86:4398–4405. doi: 10.1210/jcem.86.9.7873. [DOI] [PubMed] [Google Scholar]
- Herder C, Carstensen M, Ouwens DM. Anti-inflammatory cytokines and risk of type 2 diabetes. Diabetes Obes Metab. 2013;15(suppl 3):39–50. doi: 10.1111/dom.12155. [DOI] [PubMed] [Google Scholar]
- Hernán MA, Hernández-Díaz S, Robins JM. A structural approach to selection bias. Epidemiology. 2004;15:615–625. doi: 10.1097/01.ede.0000135174.63482.43. [DOI] [PubMed] [Google Scholar]
- Hou L, Zhang X, Zheng Y, Wang S, Dou C, Guo L, et al. Altered methylation in tandem repeat element and elemental component levels in inhalable air particles. Environ Mol Mutagen. 2014;55:256–265. doi: 10.1002/em.21829. [DOI] [PMC free article] [PubMed] [Google Scholar]
- Kelishadi R, Mirghaffari N, Poursafa P, Gidding SS. Lifestyle and environmental factors associated with inflammation, oxidative stress and insulin resistance in children. Atherosclerosis. 2009;203:311–319. doi: 10.1016/j.atherosclerosis.2008.06.022. [DOI] [PubMed] [Google Scholar]
- Kloog I, Nordio F, Coull BA, Schwartz J. Incorporating local land use regression and satellite aerosol optical depth in a hybrid model of spatiotemporal PM2.5 exposures in the Mid-Atlantic states. Environ Sci Technol. 2012;46:11913–11921. doi: 10.1021/es302673e. [DOI] [PMC free article] [PubMed] [Google Scholar]
- Kloog I, Koutrakis P, Coull BA, Lee HJ, Schwartz J. Assessing temporally and spatially resolved PM2.5 exposures for epidemiological studies using satellite aerosol optical depth measurements. Atmos Environ. 2011;45:6267–6275. [Google Scholar]
- Lepeule J, Baccarelli A, Motta V, Cantone L, Litonjua AA, Sparrow D, et al. Gene promoter methylation is associated with lung function in the elderly: the Normative Aging Study. Epigenetics. 2012;7:261–269. doi: 10.4161/epi.7.3.19216. [DOI] [PMC free article] [PubMed] [Google Scholar]
- Lepeule J, Bind MA, Baccarelli AA, Koutrakis P, Tarantini L, Litonjua A, et al. 2014. Epigenetic influences on associations between air pollutants and lung function in elderly men: the Normative Aging Study. Environ Health Perspect 122 566 572, doi: 10.1289/ehp.1206458 [DOI] [PMC free article] [PubMed] [Google Scholar]
- Levitan EB, Song Y, Ford ES, Liu S. Is nondiabetic hyperglycemia a risk factor for cardiovascular disease? A meta-analysis of prospective studies. Arch Intern Med. 2004;164:2147–2155. doi: 10.1001/archinte.164.19.2147. [DOI] [PubMed] [Google Scholar]
- Li E, Beard C, Jaenisch R. Role for DNA methylation in genomic imprinting. Nature. 1993;366:362–365. doi: 10.1038/366362a0. [DOI] [PubMed] [Google Scholar]
- Luttmer R, Spijkerman AM, Kok RM, Jakobs C, Blom HJ, Serne EH, et al. Metabolic syndrome components are associated with DNA hypomethylation. Obes Res Clin Pract. 2013;7:e106–e115. doi: 10.1016/j.orcp.2012.06.001. [DOI] [PubMed] [Google Scholar]
- Madrigano J, Baccarelli A, Mittleman MA, Wright RO, Sparrow D, Vokonas PS, et al. 2011. Prolonged exposure to particulate pollution, genes associated with glutathione pathways, and DNA methylation in a cohort of older men. Environ Health Perspect 119 977 982, doi: 10.1289/ehp.1002773 [DOI] [PMC free article] [PubMed] [Google Scholar]
- Madrigano J, Baccarelli A, Wright RO, Suh H, Sparrow D, Vokonas PS, et al. Air pollution, obesity, genes and cellular adhesion molecules. Occup Environ Med. 2010;67:312–317. doi: 10.1136/oem.2009.046193. [DOI] [PMC free article] [PubMed] [Google Scholar]
- Madrigano J, Kloog I, Goldberg R, Coull BA, Mittleman MA, Schwartz J. 2013. Long-term exposure to PM2.5 and incidence of acute myocardial infarction. Environ Health Perspect 121 192 196, doi: 10.1289/ehp.1205284 [DOI] [PMC free article] [PubMed] [Google Scholar]
- Meigs JB, Hu FB, Rifai N, Manson JE. Biomarkers of endothelial dysfunction and risk of type 2 diabetes mellitus. JAMA. 2004;291:1978–1986. doi: 10.1001/jama.291.16.1978. [DOI] [PubMed] [Google Scholar]
- Mendez R, Zheng Z, Fan Z, Rajagopalan S, Sun Q, Zhang K. Exposure to fine airborne particulate matter induces macrophage infiltration, unfolded protein response, and lipid deposition in white adipose tissue. Am J Transl Res. 2013;5:224–234. [PMC free article] [PubMed] [Google Scholar]
- Newell-Price J, Clark AJ, King P. DNA methylation and silencing of gene expression. Trends Endocrinol Metab. 2000;11:142–148. doi: 10.1016/s1043-2760(00)00248-4. [DOI] [PubMed] [Google Scholar]
- Nilsson E, Jansson PA, Perfilyev A, Volkov P, Pedersen M, Svensson MK, et al. Altered DNA methylation and differential expression of genes influencing metabolism and inflammation in adipose tissue from subjects with type 2 diabetes. Diabetes. 2014;63:2962–2976. doi: 10.2337/db13-1459. [DOI] [PubMed] [Google Scholar]
- O’Neill MS, Veves A, Sarnat JA, Zanobetti A, Gold DR, Economides PA, et al. Air pollution and inflammation in type 2 diabetes: a mechanism for susceptibility. Occup Environ Med. 2007;64:373–379. doi: 10.1136/oem.2006.030023. [DOI] [PMC free article] [PubMed] [Google Scholar]
- Power MC, Weisskopf MG, Alexeeff SE, Coull BA, Spiro A, III, Schwartz J. 2011. Traffic-related air pollution and cognitive function in a cohort of older men. Environ Health Perspect 119 682 687, doi: 10.1289/ehp.1002767 [DOI] [PMC free article] [PubMed] [Google Scholar]
- Puett RC, Hart JE, Schwartz J, Hu FB, Liese AD, Laden F. 2011. Are particulate matter exposures associated with risk of type 2 diabetes? Environ Health Perspect 119 384 389, doi: 10.1289/ehp.1002344 [DOI] [PMC free article] [PubMed] [Google Scholar]
- Rahman A, Fazal F. Hug tightly and say goodbye: role of endothelial ICAM-1 in leukocyte transmigration. Antioxid Redox Signal. 2009;11:823–839. doi: 10.1089/ars.2008.2204. [DOI] [PMC free article] [PubMed] [Google Scholar]
- Rajagopalan S, Brook RD. Air pollution and type 2 diabetes: mechanistic insights. Diabetes. 2012;61:3037–3045. doi: 10.2337/db12-0190. [DOI] [PMC free article] [PubMed] [Google Scholar]
- Rao X, Patel P, Puett R, Rajagopalan S. Air pollution as a risk factor for type 2 diabetes. Toxicol Sci. 2015;143:231–241. doi: 10.1093/toxsci/kfu250. [DOI] [PMC free article] [PubMed] [Google Scholar]
- Relton CL, Davey Smith G. Is epidemiology ready for epigenetics? Int J Epidemiol. 2012;41:5–9. doi: 10.1093/ije/dys006. [DOI] [PMC free article] [PubMed] [Google Scholar]
- Rückerl R, Ibald-Mulli A, Koenig W, Schneider A, Woelke G, Cyrys J, et al. Air pollution and markers of inflammation and coagulation in patients with coronary heart disease. Am J Respir Crit Care Med. 2006;173:432–441. doi: 10.1164/rccm.200507-1123OC. [DOI] [PubMed] [Google Scholar]
- Sarwar N, Aspelund T, Eiriksdottir G, Gobin R, Seshasai SR, Forouhi NG, et al. 2010. Markers of dysglycaemia and risk of coronary heart disease in people without diabetes: Reykjavik prospective study and systematic review. PLoS Med 7 e1000278, doi: 10.1371/journal.pmed.1000278 [DOI] [PMC free article] [PubMed] [Google Scholar]
- Sun Q, Yue P, Deiuliis JA, Lumeng CN, Kampfrath T, Mikolaj MB, et al. Ambient air pollution exaggerates adipose inflammation and insulin resistance in a mouse model of diet-induced obesity. Circulation. 2009;119:538–546. doi: 10.1161/CIRCULATIONAHA.108.799015. [DOI] [PMC free article] [PubMed] [Google Scholar]
- Tarantini L, Bonzini M, Apostoli P, Pegoraro V, Bollati V, Marinelli B, et al. 2009. Effects of particulate matter on genomic DNA methylation content and iNOS promoter methylation. Environ Health Perspect 117 217 222, doi: 10.1289/ehp.11898 [DOI] [PMC free article] [PubMed] [Google Scholar]
- Tirosh A, Shai I, Tekes-Manova D, Israeli E, Pereg D, Shochat T, et al. Normal fasting plasma glucose levels and type 2 diabetes in young men. N Engl J Med. 2005;353:1454–1462. doi: 10.1056/NEJMoa050080. [DOI] [PubMed] [Google Scholar]
- Tost J, Gut IG. DNA methylation analysis by pyrosequencing. Nat Protoc. 2007;2:2265–2275. doi: 10.1038/nprot.2007.314. [DOI] [PubMed] [Google Scholar]
- Valeri L, Vanderweele TJ. Mediation analysis allowing for exposure–mediator interactions and causal interpretation: theoretical assumptions and implementation with SAS and SPSS macros. Psychol Methods. 2013;18:137–150. doi: 10.1037/a0031034. [DOI] [PMC free article] [PubMed] [Google Scholar]
- van Eeden SF, Tan WC, Suwa T, Mukae H, Terashima T, Fujii T, et al. Cytokines involved in the systemic inflammatory response induced by exposure to particulate matter air pollutants (PM10). Am J Respir Crit Care Med. 2001;164:826–830. doi: 10.1164/ajrccm.164.5.2010160. [DOI] [PubMed] [Google Scholar]
- Vossoughi M, Schikowski T, Vierkötter A, Sugiri D, Hoffmann B, Teichert T, et al. 2014. Air pollution and subclinical airway inflammation in the SALIA cohort study. Immun Ageing 11 5, doi: 10.1186/1742-4933-11-5 [DOI] [PMC free article] [PubMed] [Google Scholar]
- Yagi N, Yokono K, Amano K, Nagata M, Tsukamoto K, Hasegawa Y, et al. Expression of intercellular adhesion molecule 1 on pancreatic β-cells accelerates β-cell destruction by cytotoxic T-cells in murine autoimmune diabetes. Diabetes. 1995;44:744–752. doi: 10.2337/diab.44.7.744. [DOI] [PubMed] [Google Scholar]
- Yang AS, Estécio MR, Doshi K, Kondo Y, Tajara EH, Issa JP. 2004. A simple method for estimating global DNA methylation using bisulfite PCR of repetitive DNA elements. Nucleic Acids Res 32 e38, doi: 10.1093/nar/gnh032 [DOI] [PMC free article] [PubMed] [Google Scholar]
Associated Data
This section collects any data citations, data availability statements, or supplementary materials included in this article.