

Abstract
Populations arrayed along broad latitudinal gradients often show patterns of clinal variation in phenotype and genotype. Such population differentiation can be generated and maintained by both historical demographic events and local adaptation. These evolutionary forces are not mutually exclusive and can in some cases produce nearly identical patterns of genetic differentiation among populations. Here, we investigate the evolutionary forces that generated and maintain clinal variation genome-wide among populations of Drosophila melanogaster sampled in North America and Australia. We contrast patterns of clinal variation in these continents with patterns of differentiation among ancestral European and African populations. Using established and novel methods we derive here, we show that recently derived North America and Australia populations were likely founded by both European and African lineages and that this hybridization event likely contributed to genome-wide patterns of parallel clinal variation between continents. The pervasive effects of admixture mean that differentiation at only several hundred loci can be attributed to the operation of spatially varying selection using an FST outlier approach. Our results provide novel insight into the well-studied system of clinal differentiation in D. melanogaster and provide a context for future studies seeking to identify loci contributing to local adaptation in a wide variety of organisms, including other invasive species as well as temperate endemics.
Keywords: adaptation, Drosophila melanogaster, latitudinal clines, parallelism, secondary contact
Introduction
All species live in environments that vary through time and space. In many circumstances, such environmental heterogeneity can act as a strong selective force driving adaptive differentiation among populations. Thus, a major goal of evolutionary and ecological genetics has been to quantify the magnitude of adaptive differentiation among populations and to identify loci underlying adaptive differentiation in response to ecologically relevant environmental variation.
Phenotypic and genetic differentiation between populations has been examined in a variety of species. In some cases, patterns of differentiation are directly interpretable in the context of circumscribed environmental differences that occur over short spatial scales (Richardson et al. 2014). For instance, differences in salinity experienced by freshwater and marine populations of sticklebacks have led to the identification of key morphological, physiological and genetic differences between replicate pairs of populations (Kitano et al. 2010; Jones et al. 2012). Similarly, pigmentation morph frequency closely tracks variation in substrate colour for a variety of species (reviewed in Gray & McKinnon 2007), thereby providing an excellent opportunity to directly relate environmental variation to phenotypic and genetic differentiation.
Patterns of genetic and phenotypic variation have also been examined in species arrayed along broad geographical transects such as latitudinal clines (Endler 1993). In this paradigm, the goal has often been to identify the phenotypic and genetic basis for adaptation to temperate environments. In certain cases, it has been possible to directly relate latitudinal variation in specific environmental variables to aspects of phenotypic and genetic differentiation (e.g. photoperiod and critical photoperiod or flowering time: Bradshaw & Lounibos 1977; Stinchcombe et al. 2004). In general, the collinearity of multiple ecological and environmental variables along latitudinal clines often complicates the direct relationship of environmental variation with specific phenotypic and genetic differences. Nonetheless, because many genetically based phenotypic clines within species often mirror deeper phylogenetic differentiation between endemic temperate and tropical species, it is clear that populations distributed along latitudinal clines have adapted to aspects of temperate environments (Gibert et al. 2001).
Latitudinal clines have been extensively studied in various drosophilid species, most notably Drosophila melanogaster. Parallel clines in morphological (Rajpurohit et al. 2008; Telonis Scott et al. 2011), stress tolerance (Hoffmann et al. 2002; Schmidt et al. 2005) and life history traits (Schmidt et al. 2005; Lee et al. 2011b) have been identified in D. melanogaster populations distributed along multiple continents. These phenotypic clines demonstrate that flies from poleward locales are generally more hardy albeit less fecund, reflecting a classic trade-off between somatic maintenance and reproductive output (Schmidt et al. 2005) that would be alternately favoured between populations exposed to harsh winters versus more benign tropical environments. Extensive clinal variation in various genetic markers has also been identified (Sezgin et al. 2004; Hoffmann & Weeks 2007). In some cases, clinal genetic variants have been directly linked to clinally varying phenotypes (Schmidt et al. 2008; Paaby et al. 2010, 2014; Lee et al. 2013), whereas in other cases parallel clinal variation at genetic markers has been documented across multiple continents (Turner et al. 2008; González et al. 2010; Reinhardt et al. 2014). Taken as a whole, there is abundant evidence that local adaptation to spatially varying selection pressures associated with temperate environments has shaped clinal patterns of phenotypic and genetic variation in D. melanogaster.
Demographic forces can also heavily shape patterns of clinal variation (Endler 1993), and the recent demographic history of D. melanogaster may be relevant to our understanding of clinal patters of genetic variation in this species. D. melanogaster is an Afro-tropical species (David & Capy 1988) that has colonized the world in the wake of human migration. Population genetic inference suggests that Eurasian populations of D. melanogaster diverged from ancestral sub-Saharan populations approximately 15 000 years ago (Li & Stephan 2006) and eventually migrated eastward across Asia, arriving to Southeast Asia approximately 2500 years ago (Laurent et al. 2011). D. melanogaster invaded the Americas and Australia within the last several hundred years and likely colonized these continents in their entirety quickly (Bock & Parsons 1981; Keller 2007). Historical records suggest that D. melanogaster colonized North America and Australia each in a single event (Bock & Parsons 1981; Keller 2007).
In contrast, however, population genetic (Caracristi & Schlötterer 2003; Duchen et al. 2013; Kao et al. 2015; Pool 2015) and morphological evidences (Capy et al. 1986; Ferveur et al. 1996; Coyne et al. 1999; Takahashi et al. 2001; Rouault et al. 2004; Yukilevich & True 2008) suggest that, for the Americas at least, there were multiple colonization events with some migrants coming from Africa and some from Europe. While there is less evidence that Australian populations of D. melanogaster form a secondary contact zone, such a scenario is not implausible given the high rates of human migration and intercontinental travel during the 19th century. Alternatively, it is possible that Australia was colonized in a single event, but that these invading flies represent a recent mixture of distinct ancestral lineages. Thus, if North America and Australia represent secondary contact zones, having experienced immigration from highly differentiated and locally adapted ancestral populations such as those from Europe and Africa (Pool et al. 2012), many genetic variants would appear clinal, even in the absence of spatially varying selection pressures (Endler 1993; Caracristi & Schlötterer 2003).
Investigating whether North America and Australia represent secondary contact zones is therefore crucial for our understanding of the extent of spatially varying selection operating on this species. We note that the secondary contact zone model and adaptive differentiation as evolutionary forces that generate and maintain clinal variation in North America and Australia are not mutually exclusive. Notably, one plausible model is that dual or mixed-lineage colonization of these continents generated patterns of clinal variation and spatially varying selection has subsequently slowed the rate of genetic homogenization among populations. Accordingly, we sought to investigate whether genome-wide patterns of clinal genetic variation in North America and Australia show signals of secondary contact and local adaptation.
We find that both North American and Australian populations show several genomic signatures consistent with secondary contact and suggest that this demographic process is likely to have generated patterns of clinal variation at a large fraction of the genome in both continents. Despite this genome-wide signal of recent admixture, we find evidence that spatially varying selection has shaped patterns of allele frequencies at some loci along latitudinal clines using an FST outlier approach. Some of these FST outliers are in or near genes previously identified to underlie life history and stress tolerance traits. However, in other cases, previously identified clinal functional polymorphisms were not identified as FST outliers demonstrating the inherent challenge of identifying the genetic targets of spatially varying selection. We discuss these findings in relation to the well-documented evidence of spatially varying selection acting on this species as well as the interpretation of patterns of genomic variation along broad latitudinal clines in general.
Materials and methods
Genome-wide allele frequency estimates
We utilized novel and publically available genome-wide estimates of allele frequencies of D. melanogaster populations sampled worldwide (Fig. 1; Table S1, Supporting information). Allele frequency estimates of six North American populations are described in Bergland et al. (2014). Allele frequency estimates of three European populations are described in Bastide et al. (2013) and Tobler et al. (2014). Allele frequency estimates from 20 African populations with full genome sequence are described in Pool et al. (2012). Allele frequency estimates of two Australian populations, Tasmania (~41°S) and Queensland (hereafter Queensland S1; ~16°S), are described in Kolaczkowski et al. (2011). Allele frequency estimates from two additional Australian populations are reported here for the first time. Allele frequency estimates from these additional Australian populations were made by pooling ten individuals from each of 22 isofemale lines originating from Innisfail (hereafter Queensland S1; 17°S) or Yering Station (hereafter Victoria; 37°S), Australia (isofemale lines kindly provided by A. Hoffmann). Sequencing library preparation and mapping followed methods outlined in Bergland et al. (2014). In several analyses, D. simulans was used as an outgroup. In these analyses, we used genome-wide allele frequency estimates from a worldwide collection of D. simulans (Begun et al. 2007), using genome-wide lift-over files reported in Bergland et al. (2014).
Fig. 1.
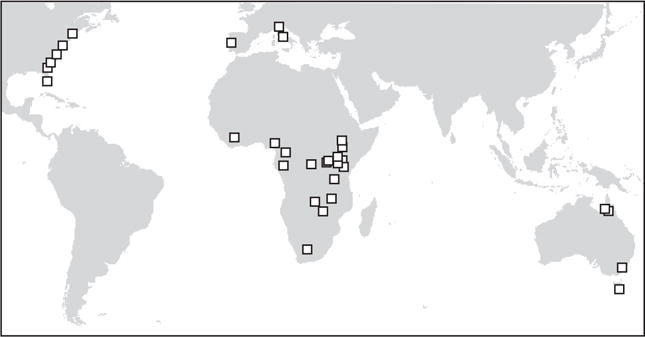
Map of collection locales (squares) of D. melanogaster populations used in this study.
We performed SNP quality filtering similar to the methods presented in Bergland et al. (2014). Briefly, we excluded SNPs within 5 bp of polymorphic indels, SNPs within repetitive regions, SNPs with average minor allele frequency less than 15% in both North America and Australia, SNPs with low (<5) or excessively high read depth (>2 times median read depth) and SNPs not present in the Drosophila Genetic Reference Panel (Mackay et al. 2012). African samples were not quality-filtered for read depth because allele frequency estimates from these samples were derived from sequenced haplotypes and not pooled samples. Regions of inferred admixture (Pool et al. 2012) in African samples (i.e. introgression of European haplotypes back to African populations) were removed from analysis.
Estimation of the population tree
We calculated Nei’s genetic distance (Nei 1972) between each pair of populations as,
where p1 and p2 are allele frequency estimates in populations 1 and 2, and generated a population tree using the neighbour-joining algorithm implemented in the R (R Core Team 2014) package APE (Paradis et al. 2004). To generate bootstrap values for each node, we randomly sampled 10 000 SNPs 100 times. We generated estimates of the population tree using the whole genome and for each chromosome focusing on SNPs that occur within the large, cosmopolitan inversions (Corbett-Detig & Hartl 2012), outside these inversions or both.
Estimation of the proportion of African and European ancestry
We used a simple linear regression method to estimate the proportion of African and European ancestry for each North American and Australian population. This method is inspired by an approach outlined in Alkorta-Aranburu et al. (2012) where each North American and Australian (derived) population is modelled as a linear combination of one African and one European (ancestral) population using an intercept-free regression model. Ancestry coefficients were calculated by drawing 100 sets of 5000 random SNPs per derived population per pair of ancestral populations. We generated ancestry estimates using the whole genome and for each chromosome separately focusing on SNPs that occur within the large, cosmopolitan inversions, outside these inversions or both.
To verify that our regression-based method of ancestry proportion estimation is accurate and robust to various demographic scenarios, we simulated several demographic models using coalescent simulations as implemented in ms (Hudson 2002). To assess the accuracy of estimated ancestry proportion, we first simulated a three-population model with one ancestral population, one ancient population that diverged from the ancestral population 0.1Ne generations ago and one derived population that resulted from admixture between the ancestral and ancient populations 0.001Ne generations ago. In these simulations, we varied the proportion of lineages in the derived population that originated from the ancient and ancestral populations. A graphical model of this demographic history is presented in Fig. S2 (Supporting information), and ms code is available from DataDryad under accession doi:10.5061/dryad.7440s.
Next, we sought to verify that single- and dual-colonization scenarios produce distinctive ancestry proportion clines. In these models, we simulated an ancient population that diverged from an ancestral population 0.1Ne generations ago. In the single-colonization scenario, a newly derived population was founded from the ancestral population and a series of four additional populations were derived from this initial newly derived population through a series of serial founder events. In the dual-colonization scenario, two newly derived populations were founded by either the ancestral or the ancient population. These newly derived populations each gave rise to another newly derived population through a serial founder event, and a fifth newly derived population resulted from the merger of these later populations. For both single- and dual-colonization models, migration was either modelled as a stepping-stone process between neighbouring newly derived populations or as a panmictic process between all newly derived populations. For either migration model, Nm was set to 1. A graphical representation of these models can be found in Fig. S3 (Supporting information), and ms code is available from DataDryad under accession doi:10.5061/dryad.7440s. In the single-and dual-colonization models, we varied the age of initial colonization of the newly derived populations and the extent of the population bottleneck during the initial and serial founder event(s). We note that parameters used for ms simulations are not intended to reflect the actual demographic history of D. melanogaster, but rather reflect a variety of plausible values for D. melanogaster and other organisms.
Formal tests of admixture
To further assess whether newly derived North America and Australian populations result from admixture of European and African lineages of flies, we performed formal tests of admixture using the f3 and D statistics (Reich et al. 2009; Patterson et al. 2012). Briefly, these statistics assess whether a proposed tree topology is consistent with the data.
The f3 statistic, denoted (C; A, B), assesses whether the data are consistent with the topology ((A, C), B) or ((B, C), A). A significantly negative f3 statistic demonstrates that the data are consistent with both topologies, thus indicating that population C is derived from an admixture event from populations A and B or populations closely related to A and B. However, nonsignificant or positive f3 statistic does not preclude the possibility of admixture between tested populations, particularly if there has been extensive drift in the focal population (Patterson et al. 2012).
The D statistic, which is derived and conceptually similar to the ABBA-BABA statistic (Patterson et al. 2012), assesses whether the data are consistent with the proposed topology ((W, X), (Y, Z)). In general, a significantly positive D statistic indicates that population W results from admixture between populations X and Y, or populations closely related to X and Y. A significantly negative D statistic can indicate that population X results from admixture between populations W and Y, or populations closely related to W and Y. While, in general, the sign of significant D statistics can be difficult to interpret, the most general interpretation is that the data do not conform to the proposed ((W, X), (Y, Z)) topology.
There are three possible D statistics for any four populations: ((W, X), (Y, Z)), ((W, Y), (X, Z)) and ((W, Z), (X, Y)). In our analysis, we used D. simulans as an outgroup (population Z in this notation). Accordingly, the first two D statistics are most easily interpretable in our analysis. In this context, population W represents the newly derived North American or Australian population and populations X and Y represent the putative source African and European populations, respectively. To simplify the interpretation of these D statistics, and to provide a conservative analysis of admixture, we report the D statistic corresponding to the minimum absolute D of ((W, X), (Y, Z)) and ((W, Y), (X, Z)).
For each North American and Australian population, we calculated f3 and D using each European population as one putative ancestral population and each African population as the other putative ancestral population. f3 and D statistics were calculated using the THREEPOP and FOURPOP programs included in TREEMIX version 1.13 (Pickrell & Pritchard 2012) with 500 bootstrap replicates using a block size of 500 SNPs. Multiple testing correction was performed using the Bonferroni correction applied across all P-values from f3 or D statistics. f3 and D statistics were calculated for the whole genome and separately for the X and autosomes.
FST outlier identification
We used the TF-LK statistic (Bonhomme et al. 2010) to identify FST outliers among North American populations and Australian populations, separately. This statistic is related to the classic Lewontin–Krakauer test for FST outliers, under the assumption that the distribution of FST is proportional to a χ2 distribution with degrees of freedom equal to one less the number of populations examined (Lewontin & Krakauer 1973). Various assumptions underlying the Lewontin–Krakauer test have been criticized (Robertson 1975), and the TF-LK statistic attempts to correct for these by conditioning the distribution of FST values on the inferred underlying population tree. Under a variety of demographic scenarios (Bonhomme et al. 2010; Mita et al. 2013), including secondary contact (Lotterhos & Whitlock 2014), the TF-LK statistic has generally been found to have low false-positive and high true-positive rates (i.e. power) in FST outlier detection. It is unknown, however, how TF-LK or any outlier-based test statistic performs in more complicated scenarios including secondary contact between populations that have adapted to similar spatially varying selection pressures as found between the focal populations. Multiple testing correction for the TF-LK statistic was performed using the false discovery rate methods implemented in the Q-VALUE package (Storey & Tibshirani 2003).
Differentiation and rates of parallelism
To assess rates of codifferentiation, we calculated the odds that SNPs fell above a range of FST quantile thresholds in North America, Australia or the Old World (i.e. Europe vs. Africa). We compared this value to the odds of codifferentiation from 500 sets of randomly selected SNPs that were matched to the focal SNPs by recombination rate (Comeron et al. 2012), chromosome, inversion status (at the large, cosmopolitan inversions In(2L)t, In(2R)NS, In(3L)Payne, In(3R)K, In(3R) Payne, In(3R)Mo, In(X)A and In(X)Be), average read depth and heterozygosity. To control for the possible autocorrelation in signal along the chromosome, we divided the genome into nonoverlapping 50-Kb blocks and randomly sampled, with replacement, one SNP per block 500 times.
Results
Data
We examined genome-wide estimates of allele frequencies from ~32 populations of D. melanogaster sampled throughout North America, Australia, Europe and Africa (Fig. 1). Our analyses largely focused on patterns of variation in North American and Australian populations and, consequently, we primarily focus on two sets of SNP markers. First, we utilized allele frequency estimates at ~500 000 high-quality SNPs that segregate at intermediate frequency (MAF > 15%) in North America. The second set was composed of ~300 000 SNPs that segregate at intermediate frequency in Australia. For analyses that examine patterns of polymorphism in both North America and Australia, we examined SNPs that were at intermediate frequency in both continents, yielding a data set of ~130 000 SNPs. Because of the low sequencing coverage in the Australian populations, it is unclear whether the reduced polymorphism in that continent reflects the demographic history of those populations or experimental artefact. Although our analysis primarily focused on patterns of polymorphism in North America and Australia, we also examined allele frequency estimates at both sets of polymorphic SNPs in populations sampled in Europe and Africa.
Genomic signals of secondary contact
We performed a series of independent analyses to examine whether North America and Australia represent secondary contact zones of European and African populations of D. melanogaster. First, we constructed a neighbour-joining tree based on genome-wide allele frequency estimates from populations sampled worldwide using 100 sets of 10 000 randomly sampled SNPs. Neighbour-joining trees were generated for SNPs residing within inversions, outside inversions or both genome-wide (Fig. 2) and for each chromosome separately (Text S1, Supporting information). As expected, African populations exhibited the greatest diversity (Pool et al. 2012) and clustered at the base of the tree, while European populations clustered at the tip. Similar to previously published reports (Caracristi & Schlötterer 2003; Nunes et al. 2008), North American and Australian populations generally clustered between African and European populations in a branching pattern collinear with latitude (Fig. 2), consistent (Kopelman et al. 2013) with the model that both North American and Australian populations result from secondary contact of European and African ones. In contrast to Reinhardt et al. (2014), we find that Australian and North American populations are not reciprocally monophyletic (Fig. 2).
Fig. 2.

Estimated population tree of sampled locales. Loci were sampled across all chromosomes, focusing on SNPs residing within (+), outside (−) large, cosmopolitan inversions or both (±). See Fig. S1 (Supporting information) for population trees based on each chromosome.
In general, the topology of these population trees was independent of whether SNPs within or outside the cosmopolitan inversions were included in the analysis. One notable exception was the placement of the Portuguese population which falls within the North American samples when examining SNPs within inversions. In addition, the topology of the African populations varied depending on the set of SNPs under consideration. However, the bootstrap support for the nodes among African populations is generally low, likely stemming from small sample sizes in these populations. In chromosome-specific analyses (Text S1, Supporting information), nodes that do not agree with the genome-wide analysis generally had low bootstrap support. We note that our treatment of the effects of the inversions on patterns of clinality is preliminary because we are performing a coarse binning of SNPs within or outside inversions rather than a finer partitioning based on distance from inversion breakpoints.
Next, we calculated the proportion of African ancestry in North American and Australian populations by modelling these populations as a linear combination of African and European ancestry (Table S1, Supporting information). Neutral coalescent simulations using ms found that this method accurately estimates ancestry proportions (Fig. S1, Supporting information). These simulations also revealed that a cline in ancestry proportion is unlikely under a single-colonization scenario, even with extensive drift (Fig. S2A–A″, C–C″, Supporting information), yet is stable and persistent under a dual-colonization scenario for long periods of time following initial colonization (Fig. S2B–B″, D–D″, Supporting information) regardless of migration patterns among newly derived populations.
In general, the proportion of African ancestry in North American and Australian populations is negatively correlated with latitude (Fig. 3). Conversely, the proportion of European ancestry is positively correlated with latitude (Fig. 3). Ancestry estimates for one mid-latitude North American population (Pennsylvania) do not significantly differ between samples of flies collected in the spring and fall (Fig. 3; Table S1, Supporting information), suggesting that large-scale migration of flies up the East Coast does not occur on a seasonal basis, consistent with previous findings (Bergland et al. 2014).
Fig. 3.
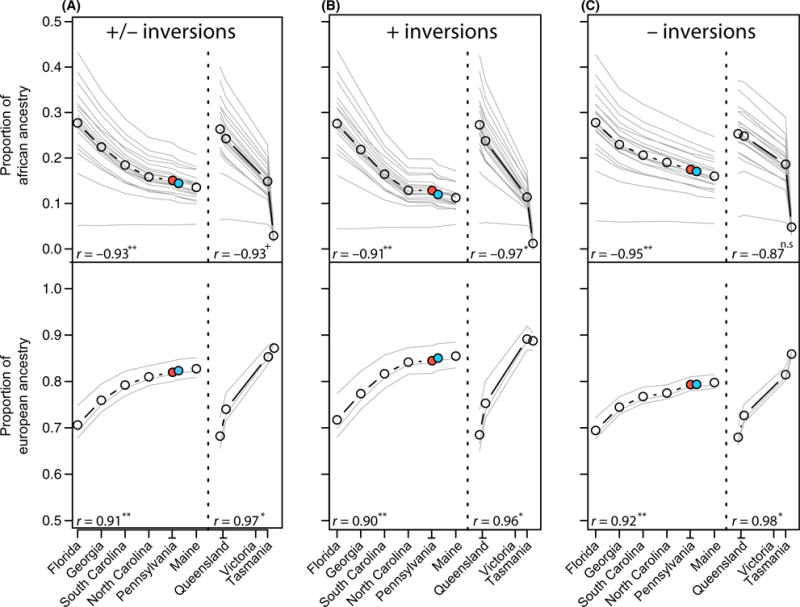
Proportion of African and European ancestry in North American and Australian populations. Thin grey lines represent the ancestry estimate for any particular African or European population averaged over all European and African populations. Black line represents the average ancestry proportions from all African and European populations. The blue circle represents the spring Pennsylvania sample, and the red circle represents the fall Pennsylvanian sample. Correlations (r) between the average ancestry estimates (thick black line) and latitude are reported (P-value < 0.01:**; P-value < 0.05:*; P-value < 0.1:+; P-value > 0.1:n.s). See Table S1 (Supporting information) for ancestry estimates for each pairwise combination of African and European population, and for SNPs on each chromosome, and with locations inside and/or outside inversions.
One notable exception to the general ancestry patterns occurs when using a single population from Zambia (population ZL from Pool et al. 2012) as a putative ancestral, source population. This population is notable in that it has an exceptionally long branch in our neighbour-joining analysis (Fig. 2), possibly indicating that it may be highly diverged from other African populations or that sparse sampling (n = 1) of this population resulted in imprecise allele frequency estimates.
Nonetheless, the general pattern of decreasing African ancestry with increasing latitude remains when using nearly any combination of African and European populations and for SNPs inside inversions, outside inversions or both sampled genome-wide or on any particular autosome. Average European and African ancestry for each North American population is significantly correlated with latitude when assessed genome-wide (Fig. 3) and for each chromosome separately (Fig. S3, Supporting information), independent of inversion status. Average ancestry clines in Australia are similar in magnitude to North American clines and are significantly or marginally correlated with latitude for most chromosome/inversion comparisons (Fig. 3; Fig. S3, Supporting information). Intriguingly, ancestry clines along the X-chromosome are less pronounced for both North America and Australia, although they are still significantly correlated with latitude for North American populations. The attenuated ancestry cline along the X-chromosome is consistent with analyses presented in Kao et al. (2015) and Pool (2015) and is also consistent with reduced level of significantly clinal polymorphisms along the X in North America (Bergland et al. 2014; Reinhardt et al. 2014). The mechanisms generating an attenuated ancestry cline along the X-chromosome are unclear but may result from reduced variation along the X (Andolfatto 2001) or increased rate of adaptive substitution on this chromosome (Ávila et al. 2014) perhaps driven by an increased rate of Dobzhansky–Muller incompatibilities (Lachance & True 2010; Pool 2015). Finally, we note that our estimate of ancestry proportion of the North Carolina population is in agreement with estimates made using other methods and data sets (Duchen et al. 2013; Kao et al. 2015; Pool 2015).
We calculated f3 and D statistics (Reich et al. 2009; Patterson et al. 2012) – commonly referred to as formal tests of admixture – for each North American and Australian population using each sampled European and African population as a putative source population. We observe significantly negative f3 statistics (Fig. S4A, Table S2, Supporting information) for each North American population when using the Italian or Austrian (Fig. 4) populations as European source populations and various African populations as the alternate source population. Significant admixture from Portuguese population into North America was only observed in southern populations using the f3 statistic (Fig. 4A; Table S2, Supporting information). f3 statistics were not significantly negative for the Australian populations individual, and the large positive values could be interpreted as a consequence of drift following colonization of Australia (Patterson et al. 2012) or experimental differences between Australian samples and North American ones. For instance, allele frequency estimates of Australian samples were generated by sequencing multiple individuals from isofemale lines that had been maintained as laboratory stocks, whereas North American samples were generated by sequencing wild-caught male flies or sons of isofemale lines that had been maintained in the laboratory for less than five generations. One consequence of this difference in experimental protocol is that the Australian isofemale lines may have undergone extensive drift in the laboratory, possibly contributing to positive f3 statistics. In addition, Australian samples have lower read depth than North American samples. To assess the effect of read depth, we performed in silico pooling of the two northern Australian samples (Queensland S1 and S2) or the two southern Australian samples (Victoria and Tasmania). This produces negative f3 statistics that are significantly lower than zero at nominal P < 0.05, but not significant after multiple test correction (Fig. 4A; Fig. S4, Supporting information). Downsampling of North American samples to average read depth in Australia did not substantially alter the observed f3 statistics (results not shown).
Fig. 4.
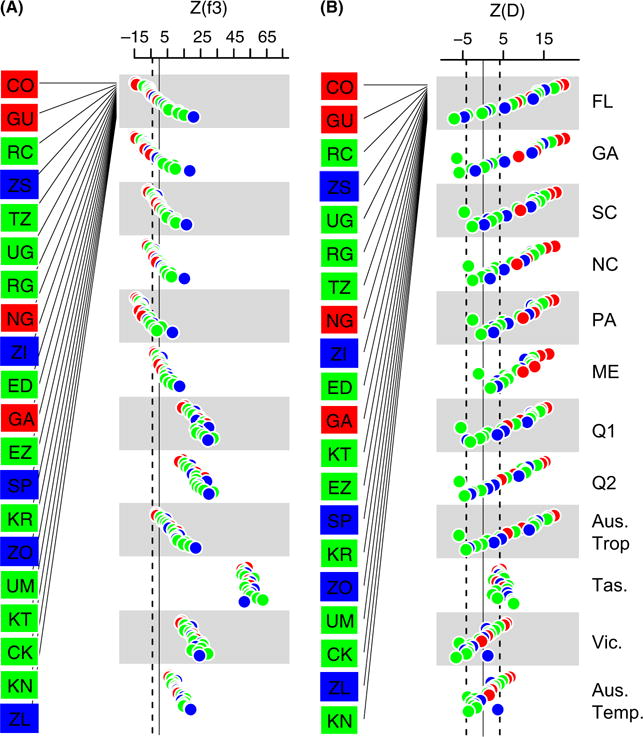
Observed standardized Z score of (A) f3 and (B) D statistics for each North American and Australian population when considering combinations of African and European populations and a putative donor population. For simplicity, only the Austrian population is shown as a putative European donor population. See Fig. S4 and Table S2 (Supporting information) for every pairwise combination of European and African populations. Dashed line represents the Bonferroni significance threshold at alpha <0.05. Values below the threshold in (A) are significantly different from 0. Values above or below the threshold in (B) are significantly different from 0. African populations are colour-coded based on location: West Africa (red); Central Africa (green); Southern Africa (blue).
D statistics for each North American and Australian population were significantly different from zero using various combinations of European and African populations as putative source populations (Fig. 4B; Fig. S4, Table S2, Supporting information). Similar to the f3 analysis, the Portuguese population shows little evidence of admixture into populations sampled in northern North America. It is worth noting that evidence of admixture using the f3 and D statistics does not conclusively demonstrate that the sampled donor populations (i.e. the European and African populations) are the actual donor populations. Rather, evidence of admixture using these statistics implies that either the sampled donor populations or unsampled yet closely related populations are likely the donor populations. f3 and D analyses consistently resolved West African populations as the most likely source of the African component of North American and Australian flies. In addition, f3 and D analyses failed to reject the null hypothesis of admixture when examining only the X-chromosome (Table S2, Supporting information).
Taken together, these results are consistent with the scenario in which both North America and Australia represent secondary contact zones between European and African lineages of D. melanogaster. Although others (David & Capy 1988) have proposed a secondary contact model for Australian D. melanogaster before, here we present the first statistical evidence supporting that model. Our results confirm an earlier model (David & Capy 1988), as well as phenotypic (Yukilevich & True 2008) and genetic (Caracristi & Schlötterer 2003; Kao et al. 2015) evidence, that low-latitude locales in North America are more genetically similar to African D. melanogaster than higher-latitude populations in North America are. One possible demographic model to explain this pattern is that European flies colonized northern North America, whereas southern North America was colonized directly by African flies, by Caribbean populations, which are themselves admixed between European and African lineages (Yukilevich & True 2008; Yukilevich et al. 2010; Kao et al. 2015), or both.
Under this secondary contact scenario, we would expect that a large fraction of the genome varies clinally. Indeed, among North American populations of D. melanogaster, approximately one-third of all common SNPs, on the order of 105, are significantly clinal at false discovery rate <10% (following the analysis in Bergland et al. 2014). However, these results do not preclude the existence of spatially varying selection that could also be acting among these populations which could explain the patterns of differentiation reported for some loci (e.g. Sezgin et al. 2004; Hoffmann & Weeks 2007; Paaby et al. 2010, 2014) and could slow the rate of homogenization of allele frequencies at neutral polymorphisms throughout the genome among clinally distributed populations. Unfortunately, similar analysis of the extent of clinality in Australia is not possible at the moment because we lack genome-wide allele frequency estimates from intermediate-latitude populations in that continent.
Genomic signals of local adaptation along latitudinal gradients
Our previous analysis supports the model that the demographic history of D. melanogaster has contributed to genome-wide patterns of differentiation among temperate and tropical populations of D. melanogaster living in North America and Australia. Regardless of this putative demographic history, multiple lines of evidence suggest that populations of flies living along broad latitudinal gradients have adapted to local environmental conditions that may be associated with aspects of temperate environments (see Discussion). Accordingly, we performed several tests to assess whether there is a strong, observable genomic signal of local adaptation.
First, we sought to identify FST outliers using the TF-LK method that attempts to identify SNPs subject to spatially varying selection while maintaining a high power and low false-positive rate (Bonhomme et al. 2010; Mita et al. 2013; Lotterhos & Whitlock 2014). This method models the distribution of FST values after conditioning on the observed population tree among the sampled populations. We identified several hundred significantly differentiated SNPs in North America (Fig. 5; Table S3, Supporting information), some of which are in or near genes that have been previously implicated in adaptation to spatially varying selection pressures (e.g. Abd-B, Fabian et al. 2012) or likely affect life history traits and correlates (e.g. AlstR, TyR, DopR, sNPF) via modulation of endocrine signalling (Bergland 2011). Intriguingly however, the amino acid polymorphism in cpo (3R: 13793588) previously implicated in clinal variation in diapause propensity (Schmidt et al. 2008) is significantly differentiated prior to, but not following, multiple testing correction in our FST outlier analysis (TF-LK = 16.2, P-value = 0.006, q-value = 0.52). Similarly, the extensively studied threonine/lysine polymorphism (Kreitman 1983; Powell 1997) that encodes the fast and slow allozyme variants at alcohol dehydrogenase (Adh, 2L:14617051) is not significantly differentiated following multiple testing correction in our FST outlier analysis (TF-LK = 17.3, P-value = 0.004, q-value = 0.45).
Fig. 5.

Number of significantly differentiated SNPs in North America and Australia at various FDR (q-value) thresholds.
While a limited number of polymorphisms were identified as significantly differentiated among North American populations, no significantly differentiated SNPs were observed among the Australian populations after correcting for multiple testing (Fig. 5). Note that the genome-wide average FST among North American populations is lower than among Australian populations (0.025 vs. 0.08, respectively), suggesting that the lack of significantly elevated FST values in Australia is not due to a lack of population differentiation but rather a high genome-wide differentiation likely caused by recent secondary contact.
The exact number of SNPs with significantly elevated FST in any particular continent will be subject to a variety of considerations including the number of sampled populations, the precision of allele frequency estimates and the power of particular analytic methods to detect outlier FST. Some of these factors vary between our North American and Australian samples, and thus, our power to detect significant elevation of FST will vary between continents. Therefore, we investigated the general patterns of differentiation and parallelism between the sets of populations sampled in North America and Australia. In addition, we also examined the patterns of differentiation and parallelism between these continents and populations sampled from the Old World (i.e. Europe and Africa).
For these analyses, we first examined whether SNPs that were highly differentiated among one set of populations were also differentiated in another set (hereafter, ‘codifferentiated’). To perform this analysis, we calculated the odds ratio (see Materials and methods) that SNPs fell above a particular quantile threshold of the FST distribution in any two sets of populations (Fig. 6A). We performed this analysis for SNPs that fell either within or outside the large cosmopolitan inversions. We find that SNPs that are highly differentiated in North America are also highly differentiated in Australia. In addition, we find that SNPs that are highly differentiated in either North America or Australia are also highly differentiated between Europe and Africa. Although patterns of codifferentiation are higher among SNPs within the large, cosmopolitan inversion than for SNPs outside the inversions, the qualitative patterns remain the same for either SNP class, suggesting that clinal variation in inversions per se does not drive the observed high levels of codifferentiation.
Fig. 6.
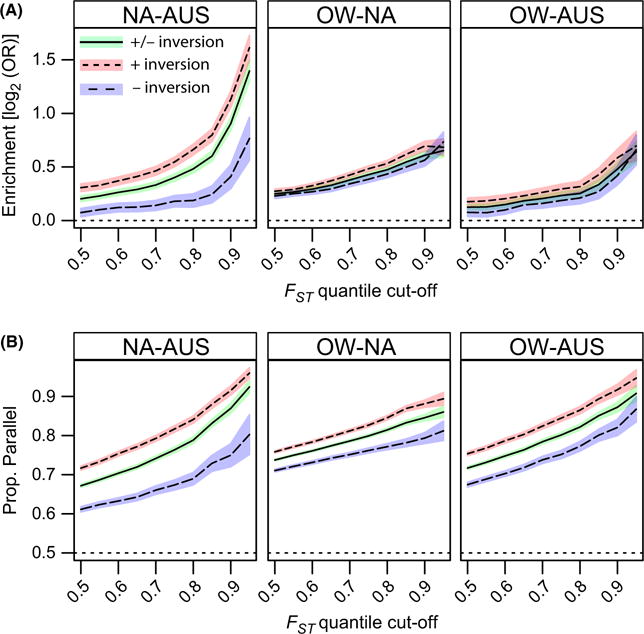
Patterns of codifferentiation and parallelism between North American, Australian and the Old world populations. (A) log2 odds ratio that SNPs fall above the FST quantile cut-off (x-axis) in both sets of populations (NA: North America; AUS: Australia; OW: Old World). (B) Proportion of SNPs that vary in a parallel way given that they fall above the FST quantile cut-off in both sets of populations. Confidence bands represent 95% confidence intervals.
SNPs that are codifferentiated among temperate and tropical populations in North America, Australia or the Old World can be differentiated in a parallel way or at random among each geographical region. We show here that there is a high degree of parallelism at the SNP level, genome-wide, among polymorphisms that are highly differentiated in any two sets of populations (Fig. 6B). Patterns of parallelism at highly codifferentiated SNPs are similar among SNPs within or outside the large cosmopolitan inversions, again suggesting that clinal variation in inversions is not driving genome-wide patterns of parallelism.
High rates of codifferentiation and parallelism among temperate and tropical populations sampled throughout the world can be interpreted in two ways. On the one hand, these patterns could be taken as evidence of parallel adaptation to aspects of temperate environments. On the other hand, these patterns are consistent with the model presented above that North American and Australian populations are the result of recent secondary contact between European and African lineages of flies (see Results: Genomic signals of secondary contact). Most likely, parallelism at any particular polymorphism is due to a combination of similar or analogous demographic history and shared selection pressures between temperate and tropical locales in North America, Australia and Europe/Africa.
Discussion
Herein, we report results from a series of analyses that (i) examine whether populations of D. melanogaster sampled throughout North America and Australia show signatures of recent secondary contact between European and African lineages and (ii) examine whether there is a genomic signal of spatially varying selection acting along latitudinal gradients. We find that both North America and Australia show several signatures of secondary contact (Figs 2–4). Notably, high-latitude populations are closely related to European populations, whereas low-latitude populations are more closely related to African ones. This result implies that a large portion of clinal variation within these continents could, in principal, be generated by the dual colonization of both North America and Australia. Consistent with this view, SNPs that are highly differentiated between temperate and tropical locales in either North America or Australia are also highly likely to be differentiated in a parallel way between Europe and Africa (Fig. 6). In addition, we report that genome-wide scans for significantly differentiated polymorphisms identified a limited number of outlier loci (Fig. 5). Taken together, our results support the model that recent secondary contact in North America and Australia has likely generated clinal variation at a large fraction of polymorphisms genome-wide and that spatially varying selection acting at a moderate number of loci acts to slow the rate of genomic homogenization between geographically separated populations.
Secondary contact and the generation of clinal variation in allele frequencies
Recent secondary contact between formerly (semi-)isolated populations is a potent force that can generate clinal variation genome-wide (Endler 1993). In D. melanogaster, high levels of genetic differentiation have been observed between temperate and tropical populations sampled in North America and Australia (Turner et al. 2008; Kolaczkowski et al. 2011; Fabian et al. 2012; Reinhardt et al. 2014). In North America at least, most of these highly differentiated SNPs vary clinally (i.e. in an approximately monotonic fashion along latitudinal gradients at false discovery rate <10%; Bergland et al. 2014). Moreover, surveys of allele frequencies along latitudinal clines in both North America and Australia at allozymes (Sezgin et al. 2004), SNPs (Sezgin et al. 2004; Bergland et al. 2014; Lavington et al. 2014), microsatellites (Gockel et al. 2001) and transposable elements (González et al. 2010) have repeatedly demonstrated that approximately one-third of all surveyed polymorphisms are significantly clinal in either continent. At face value, the high proportion of clinal polymorphisms throughout D. melanogaster’s genome suggests that demographic processes such as secondary contact have contributed to the generation of clinal variation in this species among recently colonized locales (Bock & Parsons 1981; Keller 2007).
We note that signatures of secondary contact are stronger for North American populations than for Australian populations. While historical records from North America (Keller 2007) and Australia (Bock & Parsons 1981) suggest a single point of colonization of D. melanogaster, results from morphological, behavioural and genetic studies reported here and elsewhere (Caracristi & Schlötterer 2003; Rouault et al. 2004; Duchen et al. 2013; Kao et al. 2015) suggest that a dual-colonization scenario is more likely. At least for the Americas, active trade between Europe and western Africa supports the model that North America represents a secondary contact zone. Given the extent of trade between North America, Europe and Africa, a simple model of a dual invasion and a single secondary contact event in North America is unlikely. A more plausible model is that North American populations represent a mixture of multiple European and African lineages.
Australia did not experience the same types of trade with the Old World, and throughout the 19th century, intercontinental travel to Australia was primarily restricted to British ships. However, British ships travelling to Australia ported in South Africa, in India and, after the opening of the Suez Canal, in East Africa (Bach 1976). This raises the possibility that secondary contact between European and African fruit fly lineages could have occurred immediately prior to the successful colonization of Australia by D. melanogaster in the mid-nineteenth century (Bock & Parsons 1981). Under this mixed-lineage, single-colonization scenario, rapid ecological sorting of colonizing lineages to temperate and tropical niches (Agosta & Klemens 2008) may have created a gradient where European flies were initially predominant at high latitudes and African flies predominant at low latitudes within Australia.
It is possible that the weaker signal of secondary contact in Australian populations is caused by a different form of secondary contact than occurred in North America, unsampled source populations or both. Alternatively, given the lack of historical migration between Africa and Australia and the weaker signals of admixture in Australia, it is also possible that Australia does not represent a secondary contact zone for D. melanogaster and that genetic differentiation in this continent is driven by local adaptation and range expansion following colonization (Kennington et al. 2003). Conclusively determining the colonization history of Australia will thus require extensive worldwide sampling. Regardless, given that the observed ancestry clines in Australia (Fig. 3) are concordant with those in North America and that our simulations suggest that such ancestry clines are unlikely to occur from single colonization, it seems plausible that Australia does represent a secondary contact zone.
Although secondary contact is capable of generating patterns of clinal variation genome-wide, clines generated through this demographic process are transient. As admixed populations approach migration–selection equilibrium, clines at neutral loci should attenuate. Moreover, once at equilibrium, neutral differentiation should be minimal (Slatkin 1987) for species such as D. melanogaster where Nm has been estimated to be on the order of ~1 (Yamazaki et al. 1986; Singh & Rhomberg 1987) and long-distance dispersal is believed to be frequent (Coyne & Milstead 1987).
Thus, the critical question in determining whether the vast amount of clinal variation in North American and Australian flies has been generated by demography or selection is whether this species is at migration–selection equilibrium in these continents. There are several reasons why we suspect this species is not at equilibrium yet. First, D. melanogaster appeared in North America and Australia in the mid- to late nineteenth century (Bock & Parsons 1981; Keller 2007), or on the order of 1000 generations ago, assuming approximately 10 generations per year (Pool 2015). If Nm is on the order of 1, and population size within either continent is on the order of 106 or more (Karasov et al. 2010), it would take at least on the order of 10 000–100 000 generations for these populations to reach half way to equilibrium (Whitlock 1992; Whitlock & McCauley 1999). Thus, from a simple demographic perspective, it would seem unlikely that D. melanogaster has reached migration–selection–drift equilibrium.
Others have suggested that non-African populations of D. melanogaster are not at equilibrium. In general, non-African populations of D. melanogaster show a reduction in diversity coupled with an excess of rare variants (Mackay et al. 2012). This genome-wide pattern is consistent with a population bottleneck during colonization followed by population expansion. Others have noted that non-African populations of D. melanogaster also have higher levels of linkage disequilibrium (LD) than expected under the standard neutral model (Andolfatto & Przeworski 2000; Haddrill et al. 2005; Langley et al. 2012), whereas LD in African populations is more consistent with demographic equilibrium (Andolfatto & Wall 2003 cf. Langley et al. 2012). Although genome-wide elevation of LD could be caused by various factors including pervasive positive or negative selection, admixture might possibly generate this signal.
Previous studies examining departure from equilibrium models in D. melanogaster have concluded that caution should be taken when conducting genome-wide scans for positive selection given the nonequilibrium nature of this species (Andolfatto & Przeworski 2000). Notably, demographic forces such as population bottlenecks can, in principal, mimic many of the signatures left by some types of adaptive evolution. A complimentary approach to quantify the magnitude of adaptive evolution and to identify loci subject to selection is to identify polymorphisms that are differentiated between populations that are subject to divergent selection pressures. However, results presented here demonstrate that for D. melanogaster at least, signatures of adaptive evolution from genome-wide patterns of differentiation along latitudinal clines in newly derived populations in North America and Australia should likely be taken with a similar degree of caution as traditional scans for recent, positive selection.
Spatially varying selection and the maintenance of clinal variation in allele frequencies
Whereas secondary contact is capable of generating clinal variation, spatially varying selection is required for its long-term maintenance. There is little doubt that populations of D. melanogaster living along broad latitudinal clines in temperate environments have adapted to spatially varying selection pressures. Support for the idea of local adaptation along latitudinal clines comes from three main lines of evidence.
First, certain phenotypes show repeatable clines along latitudinal and altitudinal gradients that mirror deeper phylogenetic variation among temperate and tropical species. For instance, aspects of body size vary clinally in North America (Coyne & Beecham 1987) and Australia (Kennington et al. 2003) as well as along altitudinal/latitudinal clines in India (Bhan et al. 2014) and altitudinal clines within Africa (Pitchers et al. 2013; Klepsatel et al. 2014; Fabian et al. 2015). Given such patterns of parallelism within and among continents, including within the ancestral African range, the most plausible explanation is that parallel selection pressures have generated these patterns of latitudinal and altitudinal variation. These intraspecific clines mimic interspecific patterns among temperate and tropical endemic drosophilids following Bergmann’s rule (Blanckenhorn & Demont 2004; Shelomi 2012), again implicating that natural selection has shaped some of these patterns of genetically based, phenotypic variation.
Second, certain genetic and phenotypic clines in D. melanogaster have shifted over decadal scales. Shifts in these clines are consistent with adaptation to aspects of global climate change wherein alleles common in low-latitude populations have become more prevalent in high-latitude ones over the last 20 years (Hoffmann & Weeks 2007).
Finally, here we identify several hundred polymorphisms in North America that are significantly differentiated after accounting for demography (see Results, Fig. 5 and Table S3, Supporting information). Although the function of many of these polymorphisms is presently unknown, several are within the genes known to affect life history traits and correlates that vary among temperate and tropical populations (see Results). In addition, others have identified enrichment of clinal variants among putatively functional classes of polymorphisms (e.g. Machado et al. 2015).
The identification of significantly differentiated SNPs within North America can be taken as evidence of local adaptation to spatially varying selection pressures. Moreover, the observation that two SNPs (one in cpo and one in Adh) that each likely contribute to local adaptation fall in an upper, but not extreme, tail of the FST distribution suggests that there are many more ecologically relevant and functional polymorphisms that have contributed to local adaptation in D. melanogaster than can be identified reliably with any outlier FST approach. Most likely, the signal of high differentiation caused by spatially varying selection at these SNPs is masked by recent admixture that has contributed to a high level of differentiation genome-wide. In the light of these results, we suggest that scans for local adaptation based on patterns of genetic differentiation in D. melanogaster are an important first step in identifying adaptively differentiated clinal polymorphisms, but that additional evidence, such as functional validation (Schmidt et al. 2008; Paaby et al. 2010, 2014; Lee et al. 2011a; Sgró et al. 2013; Ullastres et al. 2015), should be gathered before concluding that differentiation is caused by adaptive processes.
Conclusions
It has long been recognized that genetic differentiation among populations can be caused by both adaptive and demographic (neutral) processes (Wright 1943). Due to D. melanogaster’s large effective population size (Karasov et al. 2010), high migration rate (Coyne & Milstead 1987) and rapid decay of linkage disequilibrium (Mackay et al. 2012), others have concluded that differentiation among populations sampled along latitudinal gradients is primarily caused by spatially varying selection (reviewed in Adrion et al. 2015). Work presented here supports the notion that spatially variable selection does contribute to some differentiation among populations.
However, several genome-wide signatures presented here (Figs 2–4) and elsewhere (Caracristi & Schlötterer 2003; Duchen et al. 2013; Kao et al. 2015; Bergland et al. 2014) indicate that populations of flies in North America and Australia likely result from admixture of European and African lineages. High-latitude (temperate) populations in North America and Australia appear to be more closely related to European populations, whereas low-latitude (tropical) populations are more closely related to African ones (Figs 2 and 3), suggesting that admixture occurred along a latitudinal gradient and that this demographic event generated clinal genetic variation at approximately 1/3 of all common SNPs (Bergland et al. 2014). These colonizing lineages of flies were likely already differentially adapted to the temperate and tropical conditions that they encountered in North America and Australia. Consequently, the recent demographic history of this species in North America and Australia is collinear with both local adaptation within these newly colonized continents and among the ancestral ranges. One practical consequence of the collinearity of demography and adaptation is that the identification of clinality or parallelism at any particular locus cannot be taken as definitive evidence of spatially varying selection.
The collinearity of demography and adaptation may be a general feature of a variety of species. For instance, the successful colonization of novel locales by invasive species such as D. melanogaster is often facilitated by multiple waves of invasion. In addition to increasing propagule pressure (Simberloff 2009), multiple independent invasions are also thought to facilitate invasion success by buffering the loss of genetic diversity that accompanies bottlenecks associated with colonization. Moreover, some evidence suggests that rapid adaptation following invasion (reviewed in Dormontt et al. 2011) often results directly from hybridization between independently invading subpopulations (reviewed in Lee 2002). If invasive species are widely distributed in their native range (Bates et al. 2013), this raises the possibility that successful invasions may often result from admixture of populations that are already differentially adapted to selection pressures that vary along broad spatial gradients in the introduced ranges.
The collinearity of demography and adaptation may also occur in temperate endemic species. This phenomenon may be particularly true in marine taxa as a result of admixture between high-latitude refugial populations and low-latitude populations following the last glacial maxima ~20 000 years ago (Bernatchez & Wilson 1998; Maggs et al. 2008). For these species, secondary contact between high- and low-latitude populations would result in clinal variation at neutral loci as well as at loci that contribute to adaptation along latitudinal gradients (e.g. Adams et al. 2006). In this scenario, neutral and adaptive genetic clines may be indistinguishable.
The ability to identify targets of spatially varying selection is now possible in many model and nonmodel species (Li et al. 2008; Savolainen et al. 2013). While these genome-wide approaches can be extremely powerful, great care must be taken to ensure that signals of local adaptation are uniquely identifiable and independent from pervasive (but often subtle) signals of demography. FST outlier approaches can in some cases enable the detection of loci that underlie local adaptation following complex and confounding demographic scenarios. However, as we show here, loci known to underlie functionally relevant phenotypic variation are not necessarily detected as statistically significant outliers, likely due to the pervasive signals of recent demographic events. To ameliorate these concerns, we suggest that proposed genetic targets of spatially varying selection be functionally verified or that patterns of spatial variation at loci known a priori to underlie fitness-related phenotypic variation be investigated. Alternatively, the genomic targets of local adaptation can be identified by examining population differentiation over small spatial scales (Richardson et al. 2014) or over short time periods (Bergland et al. 2014) that are likely to be orthogonal to the demographic history of the focal species.
Supplementary Material
Fig. S1. Verification that the linear model method of ancestry proportion estimation is accurate.
Fig. S2. Verification that the linear model method of ancestry proportion estimation is robust under various demographic scenarios.
Fig. S3. Ancestry estimates for each chromosome partitioned by inversion status.
Fig. S4. Observed standardized Z score of (A) f3 and (B) D statistics for each North American and Australian population when considering every possible combination of African and European populations and a putative donor population.
Table S1. Ancestry estimates for each pairwise combination of populations.
Table S2. f3 and D statistics for each pairwise combination of African and European populations.
Table S3. Annotated table of FST outlier SNPs at q < 0.15 in North America.
Text S1. Neighbour-joining trees for each chromosome in Newick format.
Acknowledgments
We thank Joyce Kao, Heather Machado and Annalise Paaby for insightful comments on earlier versions of this manuscript. We thank Ary Hoffmann for graciously providing isofemale lines from Australia. Finally, we thank Richard Hudson for help with ms and Nick Patterson and Peter Ralph for assistance in interpreting D statistics. AOB was supported by an NIH National Service Research Award (F32 GM097837). RT’s stay in Stanford was kindly supported by the Austrian Science Fund (FWF). JG is a Ramon y Cajal Fellow (RYC-2010-07306) supported by grants from the European Commission (Marie Curie CIG PCIG-GA-2011-293860) and from the Spanish Government (Fundamental Research Projects Grant BFU-2011-24397). This work was supported by NSF DEB 0921307 (awarded to PS) and NIH R01GM089926 (awarded to PS and DP).
Footnotes
A.O.B. designed and performed the analysis and wrote the manuscript. R.T. performed analysis of admixture. J.G. constructed sequencing libraries for Australian samples. R.T., J.G., P.S. and D.P. edited the manuscript.
Data accessibility
Raw sequence data for newly resequenced Australian populations are available under NCBI Sequence Read Archive (SRA) Study Accession no. SRP064620. Raw sequence data from previously resequenced Australian populations are available under NCBI SRA Accession no. SRA012285.16. Raw sequence data for North American populations is available under NCBI SRA Accession no. PRJNA256231. Assembled sequence data for African populations were obtained from http://www.dpgp.org. Raw sequence data for Austrian and Italian populations are available from the European SRA under Accession no. ERP001827. Raw sequence data for the Portuguese population are available from the European SRA under Accession no. PRJEB4689. Allele frequency data for all populations in a flat ‘csv’ format, genetic distances between population and ms are available from DataDryad under accession doi:10.5061/dryad.7440s.
Supporting information
Additional supporting information may be found in the online version of this article.
References
- Adams SM, Lindmeier JB, Duvernell DD. Microsatellite analysis of the phylogeography, Pleistocene history and secondary contact hypotheses for the killifish, Fundulus heteroclitus. Molecular Ecology. 2006;15:1109–1123. doi: 10.1111/j.1365-294X.2006.02859.x. [DOI] [PubMed] [Google Scholar]
- Adrion JR, Hahn MW, Cooper BS. Revisiting classic clines in Drosophila melanogaster in the age of genomics. Trends in Genetics. 2015;31:434–444. doi: 10.1016/j.tig.2015.05.006. [DOI] [PMC free article] [PubMed] [Google Scholar]
- Agosta SJ, Klemens JA. Ecological fitting by phenotypically flexible genotypes: implications for species associations, community assembly and evolution. Ecology Letters. 2008;11:1123–1134. doi: 10.1111/j.1461-0248.2008.01237.x. [DOI] [PubMed] [Google Scholar]
- Alkorta-Aranburu G, Beall CM, Witonsky DB, et al. The genetic architecture of adaptations to high altitude in Ethiopia. PLoS Genetics. 2012;8:e1003110. doi: 10.1371/journal.pgen.1003110. [DOI] [PMC free article] [PubMed] [Google Scholar]
- Andolfatto P. Contrasting Patterns of X-Linked and Autosomal Nucleotide Variation in Drosophila melanogaster and Drosophila simulans. Molecular Biology and Evolution. 2001;18:279–290. doi: 10.1093/oxfordjournals.molbev.a003804. [DOI] [PubMed] [Google Scholar]
- Andolfatto P, Przeworski M. A genome-wide departure from the standard neutral model in natural populations of Drosophila. Genetics. 2000;156:257–268. doi: 10.1093/genetics/156.1.257. [DOI] [PMC free article] [PubMed] [Google Scholar]
- Andolfatto P, Wall JD. Linkage disequilibrium patterns across a recombination gradient in African drosophila melanogaster. Genetics. 2003;165:1289–1305. doi: 10.1093/genetics/165.3.1289. [DOI] [PMC free article] [PubMed] [Google Scholar]
- Ávila V, de Procé SM, Campos JL, et al. Faster-X effects in two drosophila lineages. Genome Biology and Evolution. 2014;6:2968–2982. doi: 10.1093/gbe/evu229. [DOI] [PMC free article] [PubMed] [Google Scholar]
- Bach J. A Maritime History of Australia. Thomas Nelson Limited; Melbourne: 1976. [Google Scholar]
- Bastide H, Betancourt A, Nolte V, et al. A genome-wide, fine-scale map of natural pigmentation variation in Drosophila melanogaster. PLoS Genetics. 2013;9:e1003534. doi: 10.1371/journal.pgen.1003534. [DOI] [PMC free article] [PubMed] [Google Scholar]
- Bates AE, McKelvie CM, Sorte CJB, et al. Geographical range, heat tolerance and invasion success in aquatic species. Proceedings of the Royal Society B: Biological Sciences. 2013;280:20131958. doi: 10.1098/rspb.2013.1958. [DOI] [PMC free article] [PubMed] [Google Scholar]
- Begun DJ, Holloway AK, Stevens K, et al. Population genomics: whole-genome analysis of polymorphism and divergence in Drosophila simulans. PLoS Biology. 2007;5:e310. doi: 10.1371/journal.pbio.0050310. [DOI] [PMC free article] [PubMed] [Google Scholar]
- Bergland AO. Mechanisms of nutrient-dependent reproduction in dipteran insects. In: Flatt T, Heyland A, editors. Mechanisms of Life History Evolution: The Genetics and Physiology of Life History Traits and Trade-Offs. Oxford University Press; Oxford: 2011. pp. 127–136. [Google Scholar]
- Bergland AO, Behrman EL, O’Brien KR, Schmidt PS, Petrov DA. Genomic evidence of rapid and stable adaptive oscillations over seasonal time scales in Drosophila. PLoS Genetics. 2014;10:e1004775. doi: 10.1371/journal.pgen.1004775. [DOI] [PMC free article] [PubMed] [Google Scholar]
- Bernatchez L, Wilson CC. Comparative phylogeography of Nearctic and Palearctic fishes. Molecular Ecology. 1998;7:431–452. [Google Scholar]
- Bhan V, Parkash R, Aggarwal D. Effects of body-size variation on flight-related traits in latitudinal populations of Drosophila melanogaster. Journal of Genetics. 2014;93:103–112. doi: 10.1007/s12041-014-0344-5. [DOI] [PubMed] [Google Scholar]
- Blanckenhorn WU, Demont M. Bergmann and converse Bergmann latitudinal clines in arthropods: two ends of a continuum? Integrative and Comparative Biology. 2004;44:413–424. doi: 10.1093/icb/44.6.413. [DOI] [PubMed] [Google Scholar]
- Bock IR, Parsons PA. Species of Australia and New Zealand. In: Ashburner M, Carson HL, Thompson JN, editors. Genetics and Biology of Drosophila. Academic Press; London: 1981. pp. 291–306. [Google Scholar]
- Bonhomme M, Chevalet C, Servin B, et al. Detecting selection in population trees: the Lewontin and Krakauer test extended. Genetics. 2010;186:241–262. doi: 10.1534/genetics.110.117275. [DOI] [PMC free article] [PubMed] [Google Scholar]
- Bradshaw WE, Lounibos LP. Evolution of dormancy and its photoperiodic control in pitcher-plant mosquitoes. Evolution. 1977;31:546. doi: 10.1111/j.1558-5646.1977.tb01044.x. [DOI] [PubMed] [Google Scholar]
- Capy P, David JR, Allemand R, et al. Genetic analysis of Drosophila melanogaster in the French West Indies and comparison with populations from other parts of the world. Genetica. 1986;69:167–176. [Google Scholar]
- Caracristi G, Schlötterer C. Genetic differentiation between American and European Drosophila melanogaster populations could be attributed to admixture of African alleles. Molecular Biology and Evolution. 2003;20:792–799. doi: 10.1093/molbev/msg091. [DOI] [PubMed] [Google Scholar]
- Comeron JM, Ratnappan R, Bailin S. The many landscapes of recombination in Drosophila melanogaster. PLoS Genetics. 2012;8:e1002905. doi: 10.1371/journal.pgen.1002905. [DOI] [PMC free article] [PubMed] [Google Scholar]
- Corbett-Detig RB, Hartl DL. Population genomics of inversion polymorphisms in Drosophila melanogaster. PLoS Genetics. 2012;8:e1003056. doi: 10.1371/journal.pgen.1003056. [DOI] [PMC free article] [PubMed] [Google Scholar]
- Coyne JA, Beecham E. Heritability of two morphological characters within and among natural populations of Drosophila melanogaster. Genetics. 1987;72:7–737. doi: 10.1093/genetics/117.4.727. [DOI] [PMC free article] [PubMed] [Google Scholar]
- Coyne JA, Milstead B. Long-distance migration of Drosophila. 3. Dispersal of D. melanogaster alleles from a Maryland orchard. American Naturalist. 1987;130:70–82. [Google Scholar]
- Coyne JA, Wicker-Thomas C, Jallon J-M. A gene responsible for a cuticular hydrocarbon polymorphism in Drosophila melanogaster. Genetical Research. 1999;73:189–203. doi: 10.1017/s0016672398003723. [DOI] [PubMed] [Google Scholar]
- David J, Capy P. Genetic variation of Drosophila melanogaster natural populations. Trends in Genetics. 1988;4:106–111. doi: 10.1016/0168-9525(88)90098-4. [DOI] [PubMed] [Google Scholar]
- Dormontt EE, Lowe AJ, Prentis PJ. Is rapid adaptive evolution important in successful invasions. In: Richardson DM, editor. Fifty Years of Invasion Ecology. Wiley-Blackwell; West Sussex: 2011. pp. 175–189. [Google Scholar]
- Duchen P, Živković D, Hutter S, Stephan W, Laurent S. Demographic inference reveals African and European admixture in the North American Drosophila melanogaster population. Genetics. 2013;193:291–301. doi: 10.1534/genetics.112.145912. [DOI] [PMC free article] [PubMed] [Google Scholar]
- Endler JA. Geographic Variation, Speciation, and Clines. Princeton University Press; Princeton, NJ: 1993. [PubMed] [Google Scholar]
- Fabian DK, Kapun M, Nolte V, et al. Genome-wide patterns of latitudinal differentiation among populations of Drosophila melanogaster from North America. Molecular Ecology. 2012;21:4748–4769. doi: 10.1111/j.1365-294X.2012.05731.x. [DOI] [PMC free article] [PubMed] [Google Scholar]
- Fabian DK, Lack JB, Mathur V, et al. Spatially varying selection shapes life history clines among populations of Drosophila melanogaster from sub-Saharan Africa. Journal of Evolutionary Biology. 2015;28:826–840. doi: 10.1111/jeb.12607. [DOI] [PMC free article] [PubMed] [Google Scholar]
- Ferveur J-F, Cobb M, Boukella H, Jallon J-M. World-wide variation in Drosophila melanogaster sex pheromone: behavioural effects, genetic bases and potential evolutionary consequences. Genetica. 1996;97:73–80. doi: 10.1007/BF00132583. [DOI] [PubMed] [Google Scholar]
- Gibert P, Moreteau B, Pétavy G, Karan D, David JR. Chill-coma tolerance, a major climatic adaptation among drosophila species. Evolution. 2001;55:1063–1068. doi: 10.1554/0014-3820(2001)055[1063:cctamc]2.0.co;2. [DOI] [PubMed] [Google Scholar]
- Gockel J, Kennington WJ, Hoffmann A, Goldstein DB, Partridge L. Nonclinality of molecular variation implicates selection in maintaining a morphological cline of Drosophila melanogaster. Genetics. 2001;158:319–323. doi: 10.1093/genetics/158.1.319. [DOI] [PMC free article] [PubMed] [Google Scholar]
- González J, Karasov TL, Messer PW, Petrov DA. Genome-wide patterns of adaptation to temperate environments associated with transposable elements in Drosophila. PLoS Genetics. 2010;6:e1000905. doi: 10.1371/journal.pgen.1000905. [DOI] [PMC free article] [PubMed] [Google Scholar]
- Gray SM, McKinnon JS. Linking color polymorphism maintenance and speciation. Trends in Ecology and Evolution. 2007;22:71–79. doi: 10.1016/j.tree.2006.10.005. [DOI] [PubMed] [Google Scholar]
- Haddrill PR, Thornton KR, Charlesworth B, Andolfatto P. Multilocus patterns of nucleotide variability and the demographic and selection history of Drosophila melanogaster populations. Genome Research. 2005;15:790–799. doi: 10.1101/gr.3541005. [DOI] [PMC free article] [PubMed] [Google Scholar]
- Hoffmann AA, Weeks AR. Climatic selection on genes and traits after a 100 year-old invasion: a critical look at the temperate-tropical clines in Drosophila melanogaster from eastern Australia. Genetica. 2007;129:133–147. doi: 10.1007/s10709-006-9010-z. [DOI] [PubMed] [Google Scholar]
- Hoffmann AA, Anderson A, Hallas R. Opposing clines for high and low temperature resistance in Drosophila melanogaster. Ecology Letters. 2002;5:614–618. [Google Scholar]
- Hudson RR. Generating sample under a Wright-Fisher neutral model of genetic variation. Bioinformatics. 2002;18:337–338. doi: 10.1093/bioinformatics/18.2.337. [DOI] [PubMed] [Google Scholar]
- Jones FC, Grabherr MG, Chan YF, et al. The genomic basis of adaptive evolution in threespine sticklebacks. Nature. 2012;484:55–61. doi: 10.1038/nature10944. [DOI] [PMC free article] [PubMed] [Google Scholar]
- Kao JY, Zubair A, Salomon MP, Nuzhdin SV, Campo D. Population genomic analysis uncovers African and European admixture in Drosophila melanogaster populations from the south-eastern United States and Caribbean Islands. Molecular Ecology. 2015;24:1499–1509. doi: 10.1111/mec.13137. [DOI] [PubMed] [Google Scholar]
- Karasov T, Messer PW, Petrov DA. Evidence that adaptation in Drosophila is not limited by mutation at single sites. PLoS Genetics. 2010;6:e1000924. doi: 10.1371/journal.pgen.1000924. [DOI] [PMC free article] [PubMed] [Google Scholar]
- Keller A. Drosophila melanogaster’s history as a human commensal. Current Biology. 2007;17:R77–R81. doi: 10.1016/j.cub.2006.12.031. [DOI] [PubMed] [Google Scholar]
- Kennington WJ, Gockel J, Partridge L. Testing for asymmetrical gene flow in a Drosophila melanogaster body-size cline. Genetics. 2003;165:667–673. doi: 10.1093/genetics/165.2.667. [DOI] [PMC free article] [PubMed] [Google Scholar]
- Kitano J, Lema SC, Luckenbach JA, et al. Adaptive divergence in the thyroid hormone signaling pathway in the stickleback radiation. Current Biology. 2010;20:2124–2130. doi: 10.1016/j.cub.2010.10.050. [DOI] [PMC free article] [PubMed] [Google Scholar]
- Klepsatel P, Gáliková M, Huber CD, Flatt T. Similarities and differences in altitudinal versus latitudinal variation for morphological traits in Drosophila melanogaster. Evolution. 2014;68:1385–1398. doi: 10.1111/evo.12351. [DOI] [PubMed] [Google Scholar]
- Kolaczkowski B, Kern AD, Holloway AK, Begun DJ. Genomic differentiation between temperate and tropical Australian populations of Drosophila melanogaster. Genetics. 2011;187:245–260. doi: 10.1534/genetics.110.123059. [DOI] [PMC free article] [PubMed] [Google Scholar]
- Kopelman NM, Stone L, Gascuel O. The behavior of admixed populations in neighbor-joining inference of population trees. Pacific Symposium on Biocomputing. 2013:273–284. [PMC free article] [PubMed] [Google Scholar]
- Kreitman M. Nucleotide polymorphism at the alcohol dehydrogenase locus of Drosophila melanogaster. Nature. 1983;304:412–417. doi: 10.1038/304412a0. [DOI] [PubMed] [Google Scholar]
- Lachance J, True JR. X-autosome incompatibilities in Drosophila melanogaster: tests of Haldane’s rule and geographic patterns within species. Evolution. 2010;64:3035–3046. doi: 10.1111/j.1558-5646.2010.01028.x. [DOI] [PMC free article] [PubMed] [Google Scholar]
- Langley CH, Stevens K, Cardeno C, et al. Genomic variation in natural populations of Drosophila melanogaster. Genetics. 2012;192:533–598. doi: 10.1534/genetics.112.142018. [DOI] [PMC free article] [PubMed] [Google Scholar]
- Laurent SJY, Werzner A, Excoffier L, Stephan W. Approximate Bayesian Analysis of Drosophila melanogaster polymorphism data reveals a recent colonization of Southeast Asia. Molecular Biology and Evolution. 2011;28:2041–2051. doi: 10.1093/molbev/msr031. [DOI] [PubMed] [Google Scholar]
- Lavington E, Cogni R, Kuczynski C, et al. A small system—high-resolution study of metabolic adaptation in the central metabolic pathway to temperate climates in Drosophila melanogaster. Molecular Biology and Evolution. 2014;31:2032–2041. doi: 10.1093/molbev/msu146. [DOI] [PMC free article] [PubMed] [Google Scholar]
- Lee CE. Evolutionary genetics of invasive species. Trends in Ecology and Evolution. 2002;17:386–391. [Google Scholar]
- Lee SF, Chen Y, Varan AK, et al. Molecular basis of adaptive shift in body size in drosophila melanogaster: functional and sequence analyses of the Dca Gene. Molecular Biology and Evolution. 2011a;28:2393–2402. doi: 10.1093/molbev/msr064. [DOI] [PubMed] [Google Scholar]
- Lee SF, Sgró CM, Shirriffs J, et al. Polymorphism in the couch potato gene clines in eastern Australia but is not associated with ovarian dormancy in Drosophila melanogaster. Molecular Ecology. 2011b;20:2973–2984. doi: 10.1111/j.1365-294X.2011.05155.x. [DOI] [PubMed] [Google Scholar]
- Lee SF, Eyre Walker YC, Rane RV, et al. Polymorphism in the neurofibromin gene, Nf1, is associated with antagonistic selection on wing size and development time in Drosophila melanogaster. Molecular Ecology. 2013;22:2716–2725. doi: 10.1111/mec.12301. [DOI] [PMC free article] [PubMed] [Google Scholar]
- Lewontin RC, Krakauer J. Distribution of gene frequency as a test of the theory of the selective neutrality of polymorphisms. Genetics. 1973;74:175–195. doi: 10.1093/genetics/74.1.175. [DOI] [PMC free article] [PubMed] [Google Scholar]
- Li H, Stephan W. Inferring the demographic history and rate of adaptive substitution in Drosophila. PLoS Genetics. 2006;2:e166. doi: 10.1371/journal.pgen.0020166. [DOI] [PMC free article] [PubMed] [Google Scholar]
- Li YF, Costello JC, Holloway AK, Hahn MW. “Reverse ecology” and the power of population genomics. Evolution. 2008;62:2984–2994. doi: 10.1111/j.1558-5646.2008.00486.x. [DOI] [PMC free article] [PubMed] [Google Scholar]
- Lotterhos KE, Whitlock MC. Evaluation of demographic history and neutral parameterization on the performance of Fst outlier tests. Molecular Ecology. 2014;23:2178–2192. doi: 10.1111/mec.12725. [DOI] [PMC free article] [PubMed] [Google Scholar]
- Machado HE, Bergland AO, O’Brien KR, Behrman EL, Schmidt PS, Petrov DP. Comparative population genomics of latitudinal variation in D. simulans and D. melanogaster. Molecular Ecology. 2015;25:723–740. doi: 10.1111/mec.13446. [DOI] [PMC free article] [PubMed] [Google Scholar]
- Mackay TFC, Richards S, Stone EA, et al. The Drosophila melanogaster Genetic Reference Panel. Nature. 2012;482:173–178. doi: 10.1038/nature10811. [DOI] [PMC free article] [PubMed] [Google Scholar]
- Maggs CA, Castilho R, Foltz D, et al. Evaluating signatures of glacial refugia for North Atlantic benthic marine taxa. Ecology. 2008;89:S108–S112. doi: 10.1890/08-0257.1. [DOI] [PubMed] [Google Scholar]
- Mita S, Thuillet AC, Gay L, et al. Detecting selection along environmental gradients: analysis of eight methods and their effectiveness for outbreeding and selfing populations. Molecular Ecology. 2013;22:1383–1399. doi: 10.1111/mec.12182. [DOI] [PubMed] [Google Scholar]
- Nei M. Genetic distance between populations. American Naturalist. 1972;106:283–292. [Google Scholar]
- Nunes MDS, Neumeier H, Schlötterer C. Contrasting patterns of natural variation in global Drosophila melanogaster populations. Molecular Ecology. 2008;17:4470–4479. doi: 10.1111/j.1365-294X.2008.03944.x. [DOI] [PubMed] [Google Scholar]
- Paaby AB, Blacket MJ, Hoffmann AA, Schmidt PS. Identification of a candidate adaptive polymorphism for Drosophila life history by parallel independent clines on two continents. Molecular Ecology. 2010;19:760–774. doi: 10.1111/j.1365-294X.2009.04508.x. [DOI] [PubMed] [Google Scholar]
- Paaby AB, Bergland AO, Behrman EL, Schmidt PS. A highly pleiotropic amino acid polymorphism in the Drosophila insulin receptor contributes to life-history adaptation. Evolution. 2014;68:3395–3409. doi: 10.1111/evo.12546. [DOI] [PMC free article] [PubMed] [Google Scholar]
- Paradis E, Claude J, Strimmer K. APE: analyses of phylogenetics and evolution in R language. Bioinformatics. 2004;20:289–290. doi: 10.1093/bioinformatics/btg412. [DOI] [PubMed] [Google Scholar]
- Patterson N, Moorjani P, Luo Y, et al. Ancient admixture in human history. Genetics. 2012;192:1065–1093. doi: 10.1534/genetics.112.145037. [DOI] [PMC free article] [PubMed] [Google Scholar]
- Pickrell JK, Pritchard JK. Inference of population splits and mixtures from genome-wide allele frequency data. PLoS Genetics. 2012;8:e1002967. doi: 10.1371/journal.pgen.1002967. [DOI] [PMC free article] [PubMed] [Google Scholar]
- Pitchers W, Pool JE, Dworkin I. Altitudinal clinal variation in wing size and shape in African Drosophila melanogaster: one cline or many? Evolution. 2013;67:438–452. doi: 10.1111/j.1558-5646.2012.01774.x. [DOI] [PMC free article] [PubMed] [Google Scholar]
- Pool JE. The Mosaic ancestry of the Drosophila genetic reference panel and the D. melanogaster reference genome reveals a network of epistatic fitness interactions. Molecular Biology and Evolution. 2015;32:3236–3251. doi: 10.1093/molbev/msv194. [DOI] [PMC free article] [PubMed] [Google Scholar]
- Pool JE, Corbett-Detig RB, Sugino RP, et al. Population genomics of Sub-Saharan Drosophila melanogaster: African diversity and Non-African admixture. PLoS Genetics. 2012;8:e1003080. doi: 10.1371/journal.pgen.1003080. [DOI] [PMC free article] [PubMed] [Google Scholar]
- Powell J. Progress and Prospects in Evolutionary Biology: The Drosophila Model. Oxford University Press; Oxford: 1997. [Google Scholar]
- R Core Team. R: A Language and Environment for Statistical Computing 2014 [Google Scholar]
- Rajpurohit S, Parkash R, Ramniwas S, Singh S. Variations in body melanisation, ovariole number and fecundity in highland and lowland populations of Drosophila melanogaster from the Indian subcontinent. Insect Science. 2008;15:553–561. [Google Scholar]
- Reich D, Thangaraj K, Patterson N, Price AL, Singh L. Reconstructing Indian population history. Nature. 2009;461:489–494. doi: 10.1038/nature08365. [DOI] [PMC free article] [PubMed] [Google Scholar]
- Reinhardt JA, Kolaczkowski B, Jones CD, Begun DJ, Kern AD. Parallel geographic variation in Drosophila melanogaster. Genetics. 2014;197:361–373. doi: 10.1534/genetics.114.161463. [DOI] [PMC free article] [PubMed] [Google Scholar]
- Richardson JL, Urban MC, Bolnick DI, Skelly DK. Microgeographic adaptation and the spatial scale of evolution. Trends in Ecology and Evolution. 2014;29:165–176. doi: 10.1016/j.tree.2014.01.002. [DOI] [PubMed] [Google Scholar]
- Robertson A. Remarks on the Lewontin-Krakauer test. Genetics. 1975;80:396. doi: 10.1093/genetics/80.2.396. [DOI] [PMC free article] [PubMed] [Google Scholar]
- Rouault J-D, Marican C, Wicker-Thomas C, Jallon J-M. Relations between cuticular hydrocarbon (hc) polymorphism, resistance against desiccation and breeding temperature; a model for hc evolution in D. melanogaster and D. simulans. Genetica. 2004;120:195–212. doi: 10.1023/b:gene.0000017641.75820.49. [DOI] [PubMed] [Google Scholar]
- Savolainen O, Lascoux M, Merilä J. Ecological genomics of local adaptation. Nature Reviews Genetics. 2013;14:807–820. doi: 10.1038/nrg3522. [DOI] [PubMed] [Google Scholar]
- Schmidt PS, Matzkin L, Ippolito M, Eanes WF. Geographic variation in diapause incidence, life-history traits, and climatic adaptation in Drosophila melanogaster. Evolution. 2005;59:1721–1732. [PubMed] [Google Scholar]
- Schmidt PS, Zhu C-T, Das J, et al. An amino acid polymorphism in the couch potato gene forms the basis for climatic adaptation in Drosophila melanogaster. Proceedings of the National Academy of Sciences of the United States of America. 2008;105:16207–16211. doi: 10.1073/pnas.0805485105. [DOI] [PMC free article] [PubMed] [Google Scholar]
- Sezgin E, Duvernell DD, Matzkin LM, Duan Y, Zhu CT. Single locus latitudinal clines in metabolic genes, derived alleles, and their relationship to temperate adaptation in Drosophila melanogaster. Genetics. 2004;168:923–931. doi: 10.1534/genetics.104.027649. [DOI] [PMC free article] [PubMed] [Google Scholar]
- Sgró CM, Heerwaarden B, Kellermann V, et al. Complexity of the genetic basis of ageing in nature revealed by a clinal study of lifespan and methuselah, a gene for ageing, in Drosophila from eastern Australia. Molecular Ecology. 2013;22:3539–3551. doi: 10.1111/mec.12353. [DOI] [PubMed] [Google Scholar]
- Shelomi M. Where are we now? Bergmann’s rule sensu lato in insects. The American Naturalist. 2012;180:511–519. doi: 10.1086/667595. [DOI] [PubMed] [Google Scholar]
- Simberloff D. The role of Propagule pressure in biological invasions. Annual Review of Ecology, Evolution, and Systematics. 2009;40:81–102. [Google Scholar]
- Singh RS, Rhomberg LR. A comprehensive study of genic variation in natural populations of Drosophila melanogaster. I. Estimates of gene flow from rare alleles. Genetics. 1987;115:313–322. doi: 10.1093/genetics/115.2.313. [DOI] [PMC free article] [PubMed] [Google Scholar]
- Slatkin M. Gene flow and the geographic structure of natural populations. Science. 1987;236:787–792. doi: 10.1126/science.3576198. [DOI] [PubMed] [Google Scholar]
- Stinchcombe JR, Weinig C, Ungerer M, et al. A latitudinal cline in flowering time in Arabidopsis thaliana modulated by the flowering time gene FRIGIDA. Proceedings of the National Academy of Sciences of the United States of America. 2004;101:4712–4717. doi: 10.1073/pnas.0306401101. [DOI] [PMC free article] [PubMed] [Google Scholar]
- Storey JD, Tibshirani R. Statistical significance for genomewide studies. Proceedings of the National Academy of Sciences of the United States of America. 2003;100:9440–9445. doi: 10.1073/pnas.1530509100. [DOI] [PMC free article] [PubMed] [Google Scholar]
- Takahashi A, Tsaur S-C, Coyne JA, Wu C-I. The nucleotide changes governing cuticular hydrocarbon variation and their evolution in Drosophila melanogaster. Proceedings of the National Academy of Sciences of the United States of America. 2001;98:3920–3925. doi: 10.1073/pnas.061465098. [DOI] [PMC free article] [PubMed] [Google Scholar]
- Telonis Scott M, Hoffmann AA, Sgró CM. The molecular genetics of clinal variation: a case study of ebony and thoracic trident pigmentation in Drosophila melanogaster from eastern Australia. Molecular Ecology. 2011;20:2100–2110. doi: 10.1111/j.1365-294X.2011.05089.x. [DOI] [PubMed] [Google Scholar]
- Tobler R, Franssen SU, Kofler R, et al. Massive habitat-specific genomic response in D. melanogaster populations during experimental evolution in hot and cold environments. Molecular Biology and Evolution. 2014;31:364–375. doi: 10.1093/molbev/mst205. [DOI] [PMC free article] [PubMed] [Google Scholar]
- Turner TL, Levine MT, Eckert ML, Begun DJ. Genomic analysis of adaptive differentiation in Drosophila melanogaster. Genetics. 2008;179:455–473. doi: 10.1534/genetics.107.083659. [DOI] [PMC free article] [PubMed] [Google Scholar]
- Ullastres A, Petit N, González J. Exploring the phenotypic space and the evolutionary history of a natural mutation in Drosophila melanogaster. Molecular Biology and Evolution. 2015;32:1800–1814. doi: 10.1093/molbev/msv061. [DOI] [PMC free article] [PubMed] [Google Scholar]
- Whitlock MC. Temporal fluctuations in demographic parameters and the genetic variance among populations. Evolution. 1992;46:608–615. doi: 10.1111/j.1558-5646.1992.tb02069.x. [DOI] [PubMed] [Google Scholar]
- Whitlock MC, McCauley DE. Indirect measures of gene flow and migration: FST6≠1/(4Nm+1) Heredity. 1999;82:117–125. doi: 10.1038/sj.hdy.6884960. [DOI] [PubMed] [Google Scholar]
- Wright S. Isolation by distance. Genetics. 1943;28:114–1398. doi: 10.1093/genetics/28.2.114. [DOI] [PMC free article] [PubMed] [Google Scholar]
- Yamazaki T, Choo J-K, Watanabe TK, Takahata N. Gene flow in natural populations of Drosophila melanogaster with special reference to lethal allelism rates and protein variation. Genetics. 1986;113:73–89. doi: 10.1093/genetics/113.1.73. [DOI] [PMC free article] [PubMed] [Google Scholar]
- Yukilevich R, True JR. African morphology, behavior and phermones underlie incipient sexual isolation between Us and caribbean Drosophila melanogaster. Evolution. 2008;62:2807–2828. doi: 10.1111/j.1558-5646.2008.00488.x. [DOI] [PubMed] [Google Scholar]
- Yukilevich R, Turner TL, Aoki F, Nuzhdin SV, True JR. Patterns and processes of genome-wide divergence between North American and African Drosophila melanogaster. Genetics. 2010;186:219–239. doi: 10.1534/genetics.110.117366. [DOI] [PMC free article] [PubMed] [Google Scholar]
Associated Data
This section collects any data citations, data availability statements, or supplementary materials included in this article.
Supplementary Materials
Fig. S1. Verification that the linear model method of ancestry proportion estimation is accurate.
Fig. S2. Verification that the linear model method of ancestry proportion estimation is robust under various demographic scenarios.
Fig. S3. Ancestry estimates for each chromosome partitioned by inversion status.
Fig. S4. Observed standardized Z score of (A) f3 and (B) D statistics for each North American and Australian population when considering every possible combination of African and European populations and a putative donor population.
Table S1. Ancestry estimates for each pairwise combination of populations.
Table S2. f3 and D statistics for each pairwise combination of African and European populations.
Table S3. Annotated table of FST outlier SNPs at q < 0.15 in North America.
Text S1. Neighbour-joining trees for each chromosome in Newick format.