

Abstract
Aim/Introduction
We evaluated the association between hypertriglyceridemic waist (HTW) phenotype and the risks of type 2 diabetes in an Iranian high‐risk population.
Materials and Methods
We analyzed 7‐year follow‐up data (n = 1,865) in non‐diabetic first‐degree relatives of consecutive patients with type 2 diabetes aged 30–70 years. The primary outcome was the diagnosis of type 2 diabetes based on repeated oral glucose tolerance tests. We used multiple logistic regressions to estimate the odds ratio (OR) for incident type 2 diabetes across four groups according to baseline fasting serum triglycerides (TG) level and waist circumference (WC): normal WC and normal TG, normal WC and high TG, enlarged WC and normal TG, and HTW (enlarged WC high TG).
Results
The HTW phenotype at baseline was associated with the incidence of type 2 diabetes. Those with HTW were 2.4‐fold (OR 2.36, 95% confidence interval 1.61–3.44), those with normal WC high TG were 1.9‐fold (OR 1.87, 95% confidence interval 1.29–2.70) and those with enlarged WC but normal TG were 2.8‐fold (OR 2.84, 95% confidence interval 1.96–4.13) more likely to develop type 2 diabetes than those with normal WC and normal TG.
Conclusions
These data provide further evidence that the HTW phenotype is a robust predictor of type 2 diabetes in high‐risk individuals in Iran, and the predictive power is not higher than that of simple enlarged WC and normal TG, emphasizing the importance of enlarged WC to the development of type 2 diabetes.
Keywords: Hypertriglyceridemic waist, Risk factor, Type 2 diabetes
Introduction
Early detection of individuals at high risk for type 2 diabetes, preferably by using simple and inexpensive diagnostic tools, is essential for preventing and treating type 2 diabetes. With the increasing prevalence of obesity worldwide1, a variety of markers have been suggested in the literature as inexpensive tools to identify individuals at high risk of type 2 diabetes, ranging from the simple anthropometric measures, such as body mass index and waist circumference (WC)2, 3, to more sophisticated methods, such as the metabolic syndrome4 and visceral adiposity index5. The National Cholesterol Education Program‐Adult Treatment Panel III suggested that abdominal obesity is an independent risk factor for type 2 diabetes, and measuring WC is an effective tool to screen individuals at high risk of type 2 diabetes6. However, because WC cannot fully discriminate between visceral and subcutaneous fat, high triglyceride (TG) levels have been adopted as a marker of “dysfunctional” fat tissue, visceral fat and associated metabolic abnormalities in individuals with an increased WC7, 8, 9. The potential clinical utility of visceral lipid accumulation, defined as the hypertriglyceridemic waist (HTW) phenotype (a combination of abdominal obesity and elevated fasting triglycerides), to identify individuals with cardiovascular disease was first reported by Lemieux et al. in 20077. Their results have been replicated for predicting type 2 diabetes in other cross‐sectional studies involving racial/ethnic groups, such as Koreans10, 11, Chinese5, 10, 12, 13, Hispanics14, Indigenous Australians15, elderly Swedish men16 and Canadian Inuits17. However, these studies are cross‐sectional in which it is difficult to derive HTW from the etiology of type 2 diabetes. The clinical usefulness of the HTW phenotype in predicting type 2 diabetes has not been explored among first‐degree relatives (FDR) of patients with type 2 diabetes, known to have a high prevalence of prediabetes and type 2 diabetes18. Consequently, early detection and treatment of type 2 diabetes in this high‐risk group are essential in the prevention of type 2 diabetes. Clinical trials have convincingly shown that lifestyle intervention decreases the incidence of type 2 diabetes in high‐risk individuals19.
The purpose of the present ongoing longitudinal study, therefore, was to explore the clinical usefulness of the HTW phenotype in predicting the incidence of type 2 diabetes in an Iranian high‐risk population. We hypothesized that the HTW phenotype increases the risk of type 2 diabetes in a high‐risk population.
Methods
Data collection
The present study was carried out within the framework of the Isfahan Diabetes Prevention Study. The Isfahan Diabetes Prevention Study, initiated in 2003, is an ongoing cohort in central Iran to assess the various potential risk factors for diabetes in subjects with a family history of type 2 diabetes (one of the main risk factors for diabetes). The recruitment methods and examination procedures of the Isfahan Diabetes Prevention Study have been previously described20. Our study sample at baseline comprised 3,483 (919 men and 2,564 women) FDR of consecutive patients with type 2 diabetes. All patients were attendees at clinics at Isfahan Endocrine and Metabolism Research Center, Isfahan, Iran, which is affiliated with Isfahan University of Medical Sciences, Isfahan, Iran. The study was carried out between the years 2003 and 2005. All participants were from Isfahan city and adjoining areas. They completed laboratory tests including a standard 75 g 2‐h oral glucose tolerance test (OGTT), fasting serum lipid profiles, a questionnaire on their health status and on various potential risk factors for diabetes. Participants received follow‐up tests according to the Standard of Medical Care in Diabetes21 to update information on demographic, anthropometric and lifestyle factors, and on newly diagnosed diabetes. Accordingly, if OGTT at baseline was normal, repeat testing was carried out at least at 3‐year intervals. Otherwise, repeat testing was usually carried out annually.
Ethics statement
The present study was approved by the Isfahan University of Medical Sciences ethical committee, and an informed consent form was signed by each participant.
Follow up and ascertainment of type 2 diabetes
Among the 3,483 persons who participated at baseline, 329 subjects were excluded because of diagnosis of type 2 diabetes at baseline, 1,285 did not attend any follow‐up examination and four had missing data on TG at baseline, leaving 1,865 participants with a mean age of 43.0 years (standard deviation [SD] 6.5 years; range 30–70 years) for this analysis, all of whom had at least one subsequent review during a mean follow‐up period of 7.3 years (SD 2.2; range 1–10 years). Pregnant women were excluded (Figure 1).
Figure 1.
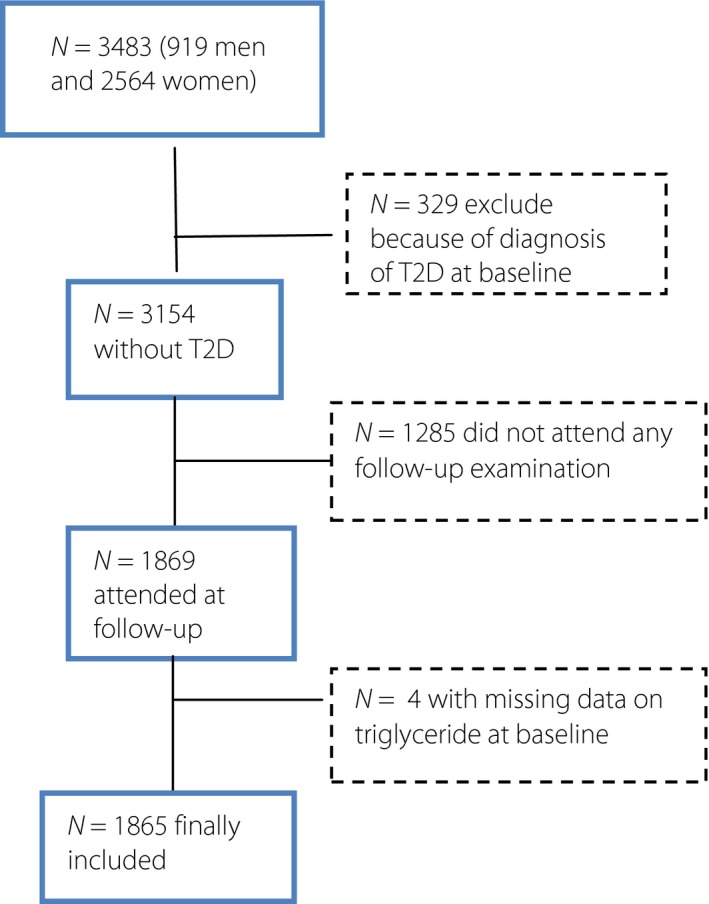
Flow diagram of inclusion and exclusion criteria in the Isfahan Diabetes Prevention Study. A total of 1,865 individuals were finally included. T2D, type 2 diabetes.
Clinical and laboratory measurements
Information on age, sex, body size, glycated hemoglobin, total cholesterol (TC), low‐density lipoprotein cholesterol (LDLC), high‐density lipoprotein cholesterol (HDLC), TG and blood pressure, family, and personal medical history was collected at baseline and through follow ups. The same methodology was used for baseline and follow‐up studies. The participants included siblings and children of patients with type 2 diabetes. Participants reported to clinics in the morning after an overnight fast. They were asked to abstain from vigorous exercise the evening before, and on the morning of their visit. Smokers were encouraged to abstain from smoking on the morning of the investigations. First, on arrival at the clinic, the information provided by the participants in the questionnaire on family history was verified. Then, with the participants in light clothing and without shoes, height, weight, WC and hip circumference were measured using standard apparatus. Weight was measured to the nearest 0.1 kg on a calibrated beam scale. Height, WC and hip circumference were measured to the nearest 0.5 cm with a measuring tape. The WC was measured midway between the lower rib margin and the iliac‐crest at the end of gentle expiration in the standing position. Hip circumference was measured over the greater trochanters directly over the underwear. The body mass index was calculated as the weight in kg divided by square of the height in meters. Resting blood pressure was measured at each examination by a physician with the participants in a sitting position after having been seated for 10 min with a mercury column sphygmomanometer and appropriately sized cuffs, using standard techniques. A blood sample was drawn between 07.00 and 09.00 hours. Fasting plasma glucose (FPG) was measured using an enzymatic colorimetric method with the glucose oxidase. Participants with FPG ≥200 mg/dL or pharmacological treatment were considered as persons with diabetes. If FPG was ≥126 mg/dL and <200 mg/dL, a second FPG was measured on another day. If the second FPG was also ≥126 mg/dL, participants were considered as persons with diabetes22. Those with FPG <126 mg/dL underwent a standard OGTT (75 g glucose 2 h) at baseline and the follow‐up visits. Venous blood was sampled 0, 30, 60 and 120 min after oral glucose administration. Plasma samples were centrifuged and analyzed the same day.
Glycated hemoglobin measured by ion‐exchange chromatography, TC, TG, HDLC and LDLC were recorded. The LDLC levels were calculated with the Friedewald Equation23 provided total TG did not exceed 400 mg/dL. Non‐HDLC was calculated by subtracting HDLC from TC. All blood sampling procedures were carried out in the central laboratory of the Isfahan Endocrine and Metabolism Research Center using the enzyme‐linked method.
Definitions
WC was defined as normal (<102 cm for men and <88 cm for women) and fasting plasma TG <150 mg/dL. In order to investigate the combined effect of normal WC, enlarged WC, normal TG and high TG level on the incidence type 2 diabetes, study participants were categorized into one of four phenotype groups: (i) normal WC and normal TG level (NWNT; n = 692); (ii) enlarged WC and normal TG level (EWNT; n = 359); (iii) normal WC and high TG level (NWHT; n = 458); and (iv) enlarged WC and high TG level (HTW; n = 356). Participants with normal WC and normal TG level served as the reference group.
Statistical analysis
Incidence was expressed as the number of cases of type 2 diabetes per 1,000 person‐years of follow up beginning on the date of completion of the baseline examination in 2003–2005 and continuing until the occurrence of type 2 diabetes, the date of the last completed follow up, death or end of follow up on 21 March 2014, whichever came first.
Statistical methods included the Student's t‐test or Mann–Whitney U‐test, one‐way analysis of variance (anova) with Scheffe's method as the post‐hoc analysis or the Kruskal–Wallis test with the Dunn procedure for continuous variables; the χ2‐test, and survival analysis with product limit (Kaplan–Meier) estimates and multiple logistic regression. To test the significance of HTW as a predictor of incidence of type 2 diabetes, the incidence of type 2 diabetes was calculated according to the four phenotype groups, and the risk of developing type 2 diabetes in each group was compared with the NWNT group (reference group). Univariate and multivariate logistic regression were fitted to investigate the relationships of the four phenotype groups to type 2 diabetes incidence, adjusting for age, sex, FPG, TC and LDLC (all defined at the baseline examination) using spss version 18 for Windows (SPSS Inc., Chicago, IL, USA). The time to development of type 2 diabetes was estimated according to each phenotype group by the Kaplan–Meier method of survival analysis, and statistical differences among groups were compared by the log–rank test. We used the examination visit date that a new case of diabetes was identified as the date of diagnosis. Age‐adjusted means were calculated and compared using general linear models. We did not carry out gender‐specific analyses, because there were too few events in some subgroups to calculate stable risk estimates. All tests for statistical significance were two‐tailed, and all were carried out assuming a type I error probability of <0.05.
Results
Characteristics
A total of 280 (15.0%; 71 men and 209 women) incident cases of type 2 diabetes occurred during 13,558 (3,457 men and 10,101 women) person‐years of follow up. Baseline characteristics of the 280 (15.0%) participants who did and 1,585 (85.0%) who did not progress to type 2 diabetes are shown in Table 1. As expected, participants who progressed to type 2 diabetes were older and had higher age‐adjusted mean weight, body mass index, WC, waist‐to‐hip ratio, hip circumference, follow‐up duration, FPG, and plasma glucose at 30, 60 and 120 min, higher glycated hemoglobin, TG, TC and non‐HDLC at baseline, and a higher proportion of obesity.
Table 1.
Age, age‐adjusted mean and proportion characteristics of selected baseline characteristics in 280 first‐degree relatives of patients with type 2 diabetes who did and 1,585 who did not develop type 2 diabetes
| Variables | Progressed to T2D | Did not progress to T2D |
|---|---|---|
| Mean (SE) | Mean (SE) | |
| Age (years) | 44.4 (0.39) | 42.7 (0.16)** |
| Height (cm) | 159.3 (0.50) | 159.9 (0.21) |
| Weight (kg) | 76.8 (0.72) | 73.3 (0.30)** |
| Body mass index (kg/m2) | 30.3 (0.25) | 28.7 (0.10)** |
| Waist circumference (cm) | 92.1 (0.57) | 88.7 (0.24)** |
| Waist‐to‐hip ratio | 0.84 (0.004) | 0.83 (0.002)* |
| Hip circumferences (cm) | 110.0 (0.53) | 107.0 (0.22)** |
| Follow‐up duration (years) | 7.8 (0.13) | 7.2 (0.05)** |
| Systolic BP (mmHg) | 117.4 (0.95) | 115.5 (0.40) |
| Diastolic BP (mmHg) | 77.0 (0.72) | 75.5 (0.30) |
| Fasting plasma glucose (mg/dL) | 104.4 (0.68) | 94.1 (0.28)** |
| Plasma glucose 30 min (mg/dL) | 163.9 (1.87) | 140.7 (0.78)** |
| Plasma glucose 60 min (mg/dL) | 186.5 (2.41) | 143.2 (1.01)** |
| Plasma glucose 120 min (mg/dL) | 146.7 (1.89) | 114.6 (0.79)** |
| HbA1c (%) | 5.4 (0.05) | 5.0 (0.02)** |
| Triglyceride (mg/dL) | 194.5 (6.04) | 161.3 (2.52)** |
| Cholesterol (mg/dL) | 201.0 (2.43) | 195.7 (1.01)* |
| HDL cholesterol (mg/dL) | 44.0 (0.73) | 45.2 (0.30) |
| LDL cholesterol (mg/dL) | 120.3 (2.20) | 119.3 (0.89) |
| Non‐HDLC (mg/dL) | 156.3 2.34) | 150.7 (1.00)* |
| % | % | |
| Women | 74.5 | 73.8 |
| Normal waist normal triglyceride | 21.4 | 39.9** |
| Normal waist high triglyceride | 26.1 | 24.3 |
| Enlarged waist normal triglyceride | 27.9 | 17.7** |
| Hypertriglyceridemic‐waist | 24.6 | 18.1** |
Age‐adjusted means were calculated using general linear models. Differences in the mean or percentage values of variables between type 2 diabetes (T2D) and no T2D. *P < 0.05, **P < 0.001. BP, blood pressure; HDL, high‐density lipoprotein; LDL, low‐density lipoprotein; Non‐HDLC, non‐high‐density lipoprotein cholesterol; SE, standard error.
The mean age was 44.4 years (SD 6.8 years) for those progress to type 2 diabetes and 42.7 years (SD 6.4 years) for those who did not progress to type 2 diabetes. The 24.6% of those that progressed to type 2 diabetes and 18.1% of those that did not progress to type 2 diabetes were HTW at baseline. The 27.9% of those that progressed to type 2 diabetes and 17.7% of those that did not progress to type 2 diabetes had enlarged WC, but normal TG at baseline.
The baseline characteristics of the study participants by four phenotype groups are shown in Table 2. Compared with the NWNT group, participants in the NWHT, EWNT and HTW groups were older, and had higher age‐adjusted mean FPG, and PG at 30, 60 and 120 min, higher TG, TC, blood pressure and non‐HDLC, and a lower level of HDLC (except EWNT) at baseline.
Table 2.
Age and age‐adjusted mean and proportion baseline characteristics of first‐degree relatives of patients with type 2 diabetes by four groups divided by waist circumference and serum triglyceride levels, The Isfahan Diabetes Prevention Study
| Characteristic | Total | NWNT | NWHT | EWNT | HTW |
|---|---|---|---|---|---|
| No. participants (%) | 1,865 (100) | 692 (37.1) | 458 (24.6) | 359 (19.2) | 356 (19.1) |
| Age (years) | 43.0 (0.15) | 42.0 (0.25) | 43.4 (0.30) | 43.1 (0.34) | 44.1 (0.34)*** |
| FPG (mg/dL) | 95.6 (0.29) | 94.4 (0.45) | 95.4 (0.55) | 96.8 (0.63) | 97.1 (0.63)** |
| PG 30 min (mg/dL) | 144.1 (0.77) | 138.4 (1.22) | 145.7 (1.47) | 147.7 (1.67) | 149.2 (1.70)*** |
| PG 60 min (mg/dL) | 149.7 (1.04) | 139.0 (1.61) | 152.1 (1.97) | 154.5 (2.23) | 162.7 (2.25)*** |
| PG 120 min (mg/dL) | 119.4 (0.80) | 112.8 (1.26) | 120.7 (1.54) | 124.0 (1.75) | 126.0 (1.76)*** |
| HbA1c (%) | 5.1 (0.02) | 5.1 (0.03) | 5.1 (0.04) | 5.1 (0.05) | 5.2 (0.05) |
| Cholesterol (mg/dL) | 196.5 (0.96) | 185.8 (1.48) | 204.5 (1.79) | 190.8 (2.08) | 211.8 (2.04)*** |
| LDL (mg/dL) | 119.4 (0.84) | 118.1 (1.35) | 116.6 (1.69) | 120.9 (1.90) | 127.3 (1.89)* |
| HDL (mg/dL) | 45.0 (0.28) | 47.3 (0.45) | 41.8 (0.54) | 47.5 (0.63) | 42.3 (0.62)*** |
| Triglyceride (mg/dL) | 166.3 (2.37) | 104.5 (2.90) | 241.7 (3.48) | 111.0 (4.09) | 235.7 (3.96)*** |
| Non‐HDLC | 151.5 (0.92) | 138.8 (1.39) | 162.9 (1.69) | 142.6 (1.95) | 169.4 (1.91)*** |
| Systolic BP (mm Hg) | 115.8 (0.39) | 111.7 (0.59) | 115.9 (0.72) | 118.0 (0.82) | 121.1 (0.82)*** |
| Diastolic BP (mm Hg) | 75.7 (0.29) | 72.8 (0.44) | 76.1 (0.54) | 77.4 (0.62) | 79.4 (0.62)*** |
| No. women (%) | 1,378 (73.9) | 500 (72.4) | 257 (56.1) | 327 (91.1) | 294 (82.6)*** |
Data are expressed as mean (standard error) or n (%). Age‐adjusted means were calculated using general linear models. *P < 0.001, **P < 0.01, ***P < 0.05 comparison across all four groups. BP, blood pressure; EWNT, enlarge waist normal triglyceride; FPG, fasting plasma glucose, HbA1c, glycated hemoglobin; HDL, high‐density lipoprotein; HTW, hypertriglyceridemic waist; LDL, low‐density lipoprotein; Non‐HDLC, non‐high‐density lipoprotein cholesterol; NWHT, normal waist high triglyceride; NWNT, normal waist normal triglyceride; PG, plasma glucose.
Incidence of diabetes
The overall incidence of subsequent diabetes was 20.7 (95% confidence interval [CI] 18.3–23.0) per 1,000 person‐years. Incidence rates were similar in women (20.7, 95% CI 17.9–23.5 per 1,000 person‐years) and men (20.5, 95% CI 16.1–25.8).
The incidence of type 2 diabetes was 11.7 per 1,000 person‐years (95% CI 8.8–14.7) for participants in the NWNT, and 27.2 per 1,000 person‐years (95% CI 21.2–34.4) for the HTW. Compared with participants in the NWNT, the risk of type 2 diabetes was 87% higher for those in the NWHT group at baseline (odds ratio [OR] 1.87, 95% CI 1.29–2.70) and 2.84‐fold higher for those in the EWNT group (OR 2.84, 95% CI 1.96–4.13) and 2.36‐fold higher for those in the HTW group (OR 2.36, 95% CI 1.61–4.44) in age‐ and sex‐adjusted models. Controlling for age, sex, FPG, TC and LDL attenuated associations, but remained significant. Although the EWNT phenotype group had a slightly higher adjusted odds ratio than HTW, the differences were not statistically significant, judging by overlap CIs (Table 3).
Table 3.
Incidence rates and odds ratio of type 2 diabetes by four hypertiglyceridemic‐wais phenotype groups, The Isfahan Diabetes Prevention Study
| NWNT | NWHT | EWNT | HTW | |
|---|---|---|---|---|
| No. cases (%.) | 60 (21.4) | 73 (26.1) | 78 (27.9) | 69 (24.6) |
| Person‐years | 5,121 | 3,292 | 2,610 | 2,535 |
| Incidence/1,000 person‐years (95% CI) | 11.7 (8.8–14.7) | 22.2 (17.4–27.8) | 29.9 (23.7–37.2) | 27.2 (21.2–34.4) |
| Odds ratio (95% CI) | ||||
| Unadjusted | 1.00 | 2.00 (1.39–2.88)*** | 2.92 (2.03–4.21)*** | 2.53 (1.74–3.68)*** |
| Sex adjusted | 1.00 | 1.96 (1.36–2.83)*** | 2.98 (2.06–4.32)*** | 2.56 (1.76–3.72)*** |
| Age and sex adjusted | 1.00 | 1.87 (1.29–2.70)** | 2.84 (1.96–4.13)*** | 2.36 (1.61–3.44)*** |
| Age, sex and FPG adjusted | 1.00 | 1.92 (1.30–2.82)** | 2.54 (1.71–3.78)*** | 2.02 (1.35–3.02)** |
| Age, sex, FPG and cholesterol adjusted | 1.00 | 2.03 (1.36–3.03)** | 2.52 (1.67–3.79)*** | 2.08 (1.36–3.16)** |
| Age, sex, FPG, cholesterol and LDLC adjusted | 1.00 | 1.72 (1.09–2.70)* | 2.49 (1.64–3.77)*** | 1.92 (1.21–3.06)** |
| Age, sex, FPG, cholesterol, LDLC and BMI adjusted | 1.00 | 1.67 (1.05–2.64)* | 1.63 (0.98–2.71) | 1.26 (0.72–2.18) |
Odds ratio (with 95% confidence interval [CI]) calculated by multiple logistic regression. *P < 0.05, **P < 0.01, ***P < 0.001. BMI, body mass index; FPG, fasting plasma glucose; EWNT, enlarge waist normal triglyceride; HTW, hypertriglyceridemic waist; LDLC, low‐density lipoprotein cholesterol; NWNT, normal waist normal triglyceride; NWHT, normal waist high triglyceride.
Kaplan–Meier survival analysis
Figure 2 shows the Kaplan–Meier estimates of the probability of remaining free of type 2 diabetes in participants with NWNT, NWHT, EWNT and HTW within a mean 7.3 years (SD 2.2 years; median 8 years, range 1–10 years). At 7 years, 68.4% of participants with NWNT, 65.1% of participants with NWHT, 67.1% with EWNT and 66.0% with HTW did not have type 2 diabetes.
Figure 2.
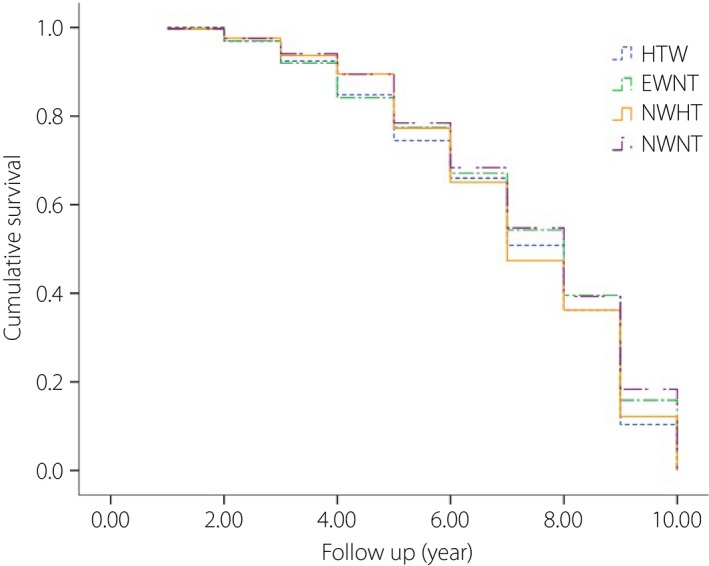
Kaplan–Meier survival curve showing progression rate to type 2 diabetes in individuals with normal waist and normal triglyceride (NWNT), enlarged waist and normal triglyceride (EWNT), normal waist and high triglyceride (NWHT) and hypertriglyceridemic waist (HTW).
It can be seen that HTW and EWNT phenotypes had increased the yearly probability of type 2 diabetes, which was significantly different compared with participants with NWNT (P < 0.05).
Discussion
The current study showed that the HTW phenotype is a strong predictor of incident type 2 diabetes independent of several known or suspected risk factors for type 2 diabetes in a large cohort of FDR of patients with type 2 diabetes in Iran. With regard to clinical applicability, this result suggests that HTW should be recognized as a good marker for identifying individuals with type 2 diabetes among high‐risk individuals. Although HTW could be an alternative test to predict type 2 diabetes, enlarged WC appeared to be relatively similar to that observed with HTW. This observation was confirmed by the results from Kaplan–Meir analysis and adjusted OR. WC has also been advocated in the literature as a valuable type 2 diabetes prediction tool6, 24. Previous observations also showed that the HTW is a marker of type 2 diabetes, as high levels of TG and enlarged WC are two key metabolic abnormalities associated with type 2 diabetes5, 10, 11, 12, 13, 14, 15, 16, 17. The present findings are consistent with several cross‐sectional data showing that the HTW is an independent predictor of type 2 diabetes5, 10, 11, 12, 13, 14, 15, 16, 17. In cross‐sectional study of Canadian Inuits17, Canadian Aboriginals25, a group of Hispanics14 and a Chinese population13, the HTW was associated with increased risk of type 2 diabetes. Just a few cohort studies10, 11, 12, 16 have assessed the risk of type 2 diabetes based on the HTW, and the present results are also consistent with them. In a Chinese cohort study of 2,908 individuals free of prediabetes and diabetes followed for 3 years, Zhang et al.12 showed that the HTW phenotype had a higher incidence of prediabetes and diabetes. He et al.10 in 687 non‐diabetic individuals followed for 15 years in an urban community in China showed that incidence of type 2 diabetes was significantly higher in individuals with HTW. In 667 Swedish older men free of diabetes followed for 6 years, Carlsson et al.16 showed that the HTW phenotype had a fourfold higher incidence of diabetes compared with those with normal WC and TG. Han et al.11 in 2,900 non‐diabetic urban Korean adults followed for 4 years showed that HTW was associated with type 2 diabetes, and the HTW phenotype was associated with a 1.56‐fold increased risk of type 2 diabetes and that the presence of EWNT was associated with a 2.25‐fold increased risk of type 2 diabetes. This is in line with the present results in that individuals with enlarged WC and high TG showed a similar risk of diabetes compared with individuals with enlarged WC and normal serum TG level, suggesting the importance of WC as a simple and inexpensive method.
The mechanisms whereby HTW exerts negative effects on type 2 diabetes risk are not entirely clear. Putative mechanisms include increased visceral fat8, which together with liver accumulation of fat could promote hepatic TG secretion as well as insulin resistance. It is believed to involve altered hepatic free fatty acid metabolism, altered adipokine release from visceral fat26, as well as various hormonal disturbances27. In conjunction with visceral fat, liver fat accumulation might also induce both hypertriglyceridemia as well as insulin resistance28. Furthermore, in the current study, a higher incidence of type 2 diabetes was more common among FDR of patients with type 2 diabetes with higher WC regardless of TG. Even though the explanation for these phenomena remain to be elucidated, it can be related to the patterns of visceral fat accumulation as well as adipose tissue distribution29.
The present study had several strengths and limitations. The strengths include the use of a sample consisting of men and women, carrying out standard OGTT, information on potential determinants of type 2 diabetes and using the direct measurements of the anthropometric indices rather than self‐reported data. Our database is one of the few that followed FDR of patients with type 2 diabetes, thereby enabling us to simultaneously control the genetic factors that might predict type 2 diabetes. The present study is also the only one in which the HTW phenotype was measured for the evaluation of the risk of developing type 2 diabetes over a 7‐year period among a FDR of patients with type 2 diabetes population. In terms of our definition of incidence type 2 diabetes, some selection bias might be present, as participants who attend for screening might have been more likely to be tested and consequently diagnosed as having type 2 diabetes. Thus, participants with type 2 diabetes who had lower risk might have been missed through lack of testing. Although at follow up, non‐attendees in the entire population did not differ from attendees according to major risk factors for progression to type 2 diabetes, approximately 37% of participants dropped out during the study period, and this can limit the interpretation of the findings. We did not carry out gender‐specific analyses, because there were too few events in some subgroups to calculate stable risk estimates, and we used sex as an adjustment factor in all analyses. The current findings were drawn from a study population with FDR of patients with type 2 diabetes and, therefore, the results might not be generalized to all populations. However, it is necessary to validate the association of HTW phenotype and type 2 diabetes in other populations. However, the present study is meaningful as a first study to clarify the relationship between HTW and incident type 2 diabetes among an Iranian population of FDR of patients with type 2 diabetes.
In conclusion, these data provide further evidence that the HTW phenotype was a robust predictor of type 2 diabetes in high‐risk individuals in Iran, and enlarged WC showed a similar discriminating ability.
Disclosure
The authors declare no conflict of interest.
Acknowledgments
We are grateful to M Abyar for technical computer assistance. The present study could not have been carried out without the contributions of the relatives of patients with type 2 diabetes who consented to participate. This study was supported partially by a grant from the Isfahan University of Medical Sciences, Iran. This research was carried out as a part of the academic activity of the university.
J Diabetes Investig 2016; 7: 860–866
References
- 1. Haslam DW, James WP. Obesity. Lancet 2005; 366: 1197–1209. [DOI] [PubMed] [Google Scholar]
- 2. Riserus U, de Faire U, Berglund L, et al Sagittal abdominal diameter as a screening tool in clinical research: cutoffs for cardiometabolic risk. J Obes 2010; 757939. doi:10.1155/2010/757939. [DOI] [PMC free article] [PubMed] [Google Scholar]
- 3. Wandell PE, Carlsson AC, Theobald H. The association between BMI value and long‐term mortality. Int J Obes (Lond) 2009; 33: 577–582. [DOI] [PubMed] [Google Scholar]
- 4. Carlsson AC, Wandell PE, Halldin M, et al Is a unified definition of metabolic syndrome needed? Comparison of three definitions of metabolic syndrome in 60 year‐old men and women. Metab Syndr Relat Disord 2009; 7: 231–241. [DOI] [PubMed] [Google Scholar]
- 5. Du T, Sun X, Huo R, et al Visceral adiposity index, hypertriglyceridemic waist and risk of diabetes: the China Health and Nutrition Survey 2009. Int J Obes (Lond) 2014; 38: 840–847. [DOI] [PubMed] [Google Scholar]
- 6. Gotto AM, NCEP ATP III . NCEP ATP III guidelines incorporate global risk assessment. Am J Manag Care 2003; (Suppl 1): 3. [PubMed] [Google Scholar]
- 7. Lemieux I, Poirier P, Bergeron J, et al Hypertriglyceridemic waist: a useful screening phenotype in preventive cardiology? Can J Cardiol 2007; 23 (Suppl B): 23B–31B. [DOI] [PMC free article] [PubMed] [Google Scholar]
- 8. Sam S, Haffner S, Davidson MH, et al Hypertriglyceridemic waist phenotype predicts increased visceral fat in subjects with type 2 diabetes. Diabetes Care 2009; 32: 1916–1920. [DOI] [PMC free article] [PubMed] [Google Scholar]
- 9. Lemieux I, Pascot A, Couillard C, et al Hypertriglyceridemic waist: a marker of the atherogenic metabolic triad (hyperinsulinemia; hyperapolipoprotein B; small, dense LDL) in men? Circulation 2000; 102: 179–184. [DOI] [PubMed] [Google Scholar]
- 10. He S, Zheng Y, Shu Y. Hypertriglyceridemic waist might be an alternative to metabolic syndrome for predicting future diabetes mellitus. PLoS ONE 2013; 8: e73292. [DOI] [PMC free article] [PubMed] [Google Scholar]
- 11. Han KJ, Lee SY, Kim NH, et al Increased risk of diabetes development in subjects with the hypertriglyceridemic waist phenotype: a 4‐year longitudinal study. Endocrinol Metab (Seoul) 2014; 29: 514–521. [DOI] [PMC free article] [PubMed] [Google Scholar]
- 12. Zhang M, Gao Y, Chang H, et al Hypertriglyceridemic‐waist phenotype predicts diabetes: a cohort study in Chinese urban adults. BMC Public Health 2012; 12: 1081. [DOI] [PMC free article] [PubMed] [Google Scholar]
- 13. Yu D, Huang J, Hu D, et al Is an appropriate cutoff of hypertriglyceridemic waist designated for type 2 diabetes among Chinese adults? Clin Nutr 2010; 29: 192–198. [DOI] [PubMed] [Google Scholar]
- 14. Díaz‐Santana MV, Suárez Pérez EL, Ortiz Martínez AP, et al Association Between the Hypertriglyceridemic Waist Phenotype, Prediabetes, and Diabetes Mellitus Among Adults in Puerto Rico. J Immigr Minor Health 2016; 18: 102–109. [DOI] [PMC free article] [PubMed] [Google Scholar]
- 15. Daniel M, Paquet C, Kelly SJ, et al Hypertriglyceridemic waist and newly‐diagnosed diabetes among remote‐dwelling Indigenous Australians. Ann Hum Biol 2013; 40: 496–504. [DOI] [PubMed] [Google Scholar]
- 16. Carlsson AC, Risérus U, Ärnlöv J. Hypertriglyceridemic waist phenotype is associated with decreased insulin sensitivity and incident diabetes in elderly men. Obesity (Silver Spring) 2014; 22: 526–529. [DOI] [PubMed] [Google Scholar]
- 17. Egeland GM, Cao Z, Young TK. Hypertriglyceridemic‐waist phenotype and glucose intolerance among Canadian Inuit: the International Polar Year Inuit Health Survey for Adults 2007‐2008. CMAJ 2011; 183: E553–E558. [DOI] [PMC free article] [PubMed] [Google Scholar]
- 18. Janghorbani M, Amini M. Incidence of type 2 diabetes by HbA1c and OGTT: the Isfahan Diabetes Prevention Study. Acta Diabetol 2012; 49 (Suppl 1): S73–S79. [DOI] [PubMed] [Google Scholar]
- 19. Schellenberg ES, Dryden DM, Vandermeer B, et al Lifestyle interventions for patients with and at risk for type 2 diabetes: a systematic review and meta‐analysis. Ann Intern Med 2013; 159: 543–551. [DOI] [PubMed] [Google Scholar]
- 20. Amini M, Janghorbani M. Diabetes and impaired glucose regulation in first degree relatives of patients with type 2 diabetes in Isfahan, Iran: Prevalence and risk factors. Rev Diabet Stud 2007; 4: 169–176. [DOI] [PMC free article] [PubMed] [Google Scholar]
- 21. Executive summary: Standard of Medical Care in Diabetes‐2013. Diabetes Care 2013; 36: S4–S10. [DOI] [PMC free article] [PubMed] [Google Scholar]
- 22. Expert Committee on the Diagnosis and Classification of Diabetes Mellitus . Report of the expert committee on the diagnosis and classification of diabetes mellitus. Diabetes Care 2003; 26 (suppl 1): S5–S20. [DOI] [PubMed] [Google Scholar]
- 23. Friedewald WT, Levy RI, Fredrickson DS. Estimation of the concentration of low‐density lipoprotein cholesterol in plasma, without use of the preparative ultracentrifuge. Clin Chem 1972; 18: 499–502. [PubMed] [Google Scholar]
- 24. Janghorbani M, Amini M. Comparison of body mass index with abdominal obesity indicators and waist‐to‐stature ratio for prediction of type 2 diabetes: The Isfahan diabetes prevention study. Obes Res Clin Pract 2010; 4: e1–e82. [DOI] [PubMed] [Google Scholar]
- 25. Pollex RL, Hanley AJ, Zinman B, et al Clinical and genetic associations with hypertriglyceridemic waist in a Canadian aboriginal population. Int J Obes (Lond) 2006; 30: 484–491. [DOI] [PubMed] [Google Scholar]
- 26. Cesari M, Penninx BW, Newman AB, et al Inflammatory markers and onset of cardiovascular events: results from the Health ABC study. Circulation 2003; 108: 2317–2322. [DOI] [PubMed] [Google Scholar]
- 27. Despres JP. Body fat distribution and risk of cardiovascular disease: an update. Circulation 2012; 126: 1301–1313. [DOI] [PubMed] [Google Scholar]
- 28. Adiels M, Taskinen MR, Packard C, et al Overproduction of large VLDL particles is driven by increased liver fat content in man. Diabetologia 2006; 49: 755–765. [DOI] [PubMed] [Google Scholar]
- 29. Kahn HS 1, Cheng YJ. Longitudinal changes in BMI and in an index estimating excess lipids among white and black adults in the United States. Int J Obes (Lond) 2008; 32: 136–143. [DOI] [PubMed] [Google Scholar]