

Abstract
Background
The misuse of opioid analgesics is a major public health concern, and guidelines regarding postoperative opioid use are sparse. We examined the use of opioids following outpatient upper extremity procedures. We hypothesized that opioid use varies widely by procedure and patient factors.
Methods
We studied opioid prescriptions among 296,452 adults ages ≥ 18 years who underwent carpal tunnel release, trigger finger release, cubital tunnel release, and thumb carpometacarpal (CMC) arthroplasty from 2009 to 2013. We analyzed insurance claims drawn using Truven Health MarketScan Commercial Claims and Encounters, which encompasses over 100 health plans in the United States. Using multivariable regression, we compared the receipt of opioids, number of days supplied, indicators of inappropriate prescriptions, and number of refills by patient factors.
Results
In this cohort, 59% filled a postoperative prescription for opioid medication, and 8.8% patients had an indicator of inappropriate prescribing. The probability of filling an opioid prescription declined linearly with advancing age. In multivariate analysis, patients who had previously received opioids were more likely to fill a postoperative opioid prescription (66% vs. 59%), receive longer prescriptions (24 vs. 5 days), receive refills following surgery (24% vs. 5%), and have at least one indicator of potentially inappropriate prescribing (19% vs 6%).
Conclusions
Current opioid users are more likely to require postoperative opioid analgesics for routine procedures, and more likely to receive inappropriate prescriptions. More evidence is needed to identify patients who derive the greatest benefit from opioids in order to curb opioids prescriptions when alternative analgesics may be equally effective and available.
Keywords: opioid, narcotic, hand surgery, carpal tunnel release, trigger finger release, arthritis, carpometacarpophalangeal arthroplasty, cubital tunnel release
The inappropriate use of opioid prescription medications is a national health crisis.1 Overprescribing opioid analgesics by medical providers has been shown to be a major contributor to the morbidity and mortality associated with opioid abuse.2,3 Deaths related to opioid prescriptions have increased 4-fold over recent years, and are now far more common than deaths related to other substances, such as sedative hypnotics, heroin and cocaine.4,5 In addition, the incidence of non-fatal prescription opioid overdoses has risen over 50% in the United States from 2001 to 2010.5,6 In spite of this, opioid prescriptions continue to increase annually, and more opioids are prescribed per capita in the United States than any other country in the world.7–9 Notably, hydrocodone-based analgesics are the most commonly prescribed medication in the United States, with over 130 million prescriptions per year.10
Guidelines have been established for clinicians who care for patients suffering from chronic pain in order to curb the prescription of opioids and offer algorithms for the use of alternative analgesics.11–13 However, far less is known regarding appropriate prescribing practices following routine elective surgery.14 Inadequately managed perioperative pain causes difficulty with postoperative rehabilitation, prolonged length of stay, and may be associated with the development of chronic post-surgical pain.15–17 Despite their risks, opioids are effective at alleviating postoperative pain, and remain the standard of care for treating moderate to severe acute post-surgical pain.18 Therefore, identifying safe practices for opioid management is an important priority for all surgeons in practice.
Recent studies demonstrate that the prevalence of opioid use and dependence among patients undergoing orthopedic surgery procedures is rising.19 To date, there is little evidence regarding prescribing patterns following outpatient elective surgery. Hand procedures are among the most commonly performed outpatient surgeries in the United States. For example, over 500,000 carpal tunnel releases are performed each year, and the incidence of upper extremity surgery is expected to increase with the aging population.20–23 Therefore, understanding differences in the receipt of opioid narcotics can inform future clinical guidelines regarding their use. In this context, the purpose of this study is to define the rate at which opioid prescriptions are filled following four common, outpatient, elective hand surgery procedures, the type of opioid analgesics that are filled, the variation in opioid use by patient factors, and potential indicators of inappropriate use.
Methods
Data source and study cohort
We analyzed the Truven Health MarketScan® Research Databases, including the MarketScan Commercial Claims and Encounters Database and the Medicare Supplemental and Coordination of Benefits Database. These databases capture patient-level utilization of medical services, payment, and enrollment across inpatient, outpatient and prescription drugs. They represent the healthcare utilization of approximately 50 million active employees, early retirees, Medicare-eligible retirees with employer-provided Medicare Supplemental plans, and their dependents each year. We examined the outpatient services claims from patients who underwent one of the following four procedures between 2009 to 2013: 1) carpal tunnel release (CTR), 2) cubital tunnel release (CuTR), 3) surgical treatment for thumb carpometacarpal (CMC) joint arthritis, including CMC joint arthroplasty and arthrodesis, 4) and trigger finger release (TFR). We identified these procedures using International Classification of Disease 9th revision codes (ICD-9 diagnosis codes) for the indication (primary diagnosis) and Current Procedural Terminology codes (CPT codes) for the procedure description. (Appendix 1)
To ensure that opioid use was related to pain after surgical procedures rather than other types of pain (e.g. chronic pain), we included patients who did not carry a pre-existing diagnosis of chronic pain (ICD-9 diagnosis codes: 33821, 33822, 33228, 33829, 3384, 3384x).24,25 In addition, we categorized “opioid naïve” patients as those who had not filled an opioid prescription within 6 weeks prior to the procedure and required that the first opioid prescription following the procedure to be an original prescription rather than a refill. In contrast, we classified patients who were currently receiving opioids, or “opioid exposed,” as those who had filled a prescription for an opioid within 6 weeks of the procedure, or whose prescription was a refill rather than a new prescription. We specifically excluded all patients who underwent multiple simultaneous surgical procedures on the same day.
Utilization of opioid medications
We followed each patient for 6 weeks following the four procedures to determine 1) the number of patients who filled a prescription for opioid medications (Appendix 2), 2) the type of opioid medication filled, 3) the number of days the opioid was prescribed, 4) the number of refills, and 5) indicators of potentially inappropriate prescription.
We used generic drug names to identify prescriptions from the MarketScan files. We categorized opioid prescriptions into 5 categories: hydrocodone and hydrocodone-combination medications, oxycodone and oxycodone-combination medications, tramadol and tramadol-combination medications, codeine phosphate and codeine-combination medications, and other opioid medications.
Daily opioid dosage was calculated using outpatient pharmaceutical claims data. To determine the daily dose prescribed, the total amount of prescribed medicine was divided by the corresponding days of supply. This was converted to a standard unit of comparison, Morphine Milligram Equivalent (MME) units, by using a morphine equivalent conversion factor per milligram.24,25 (Appendix 3)This approach allowed us to compare daily doses of opioid across prescription types and patients.24,26
We identified indicators for potentially inappropriate prescribing of opioid analgesics.24,25 These indicators include (1) opioid prescriptions with at least one overlap (defined as the “days supply” for two opioid prescriptions in the postoperative period that overlap by seven days or more); (2) overlapping opioid and benzodiazepine prescriptions (defined as the “days supply” for an opioid and benzodiazepine prescriptions in the postoperative period that overlap by seven days or more): (3) long-acting/extended-release (LA/ER) opioid prescriptions for acute pain; and (4) high daily opioid doses, defined as a daily dosage of 100 morphine milligram equivalent (MME) or higher.
Independent variables
We examined patient sociodemographic factors, including age (18–34 years, 35–44 years, 45–54 years, 55–64 years, and 65 years and older), gender, metropolitan statistical area (MSA), type of insurance plan, and geographic region of residence. The MSA describes geographical regions with a relatively high density of population at its core with adjacent communities with similar degree of social and economic factors as the core. We linked the MSA identifier for each patient to the 2010 census data and obtained median household income of each area where the patients resided. We then categorized regional median house income into five categories for the patient cohort: less than $40,000, $40,000 – $50,000, $50,000 – $60,000, $60,000 – $70,000, and greater than $70,000. We categorized insurance plan type into five groups: comprehensive health insurance, health maintenance organization (HMO) plans, preferred provider organization (PPO) plans, point of service (POS) plans and other (e.g. Medicare). Finally, we included geographic region of the United States (northeast, north central, south and west regions) into the analysis.
Statistical analysis
We performed descriptive analysis to examine the distribution of patient characteristics by whether or not they filled a prescription for opioids following surgery and procedure type (CTR, CuTR, CMC arthroplasty/arthrodesis and TFR). We used multivariable logistic regression to determine the effect of patient factors on whether or not an opioid prescription was filled and the receipt of an opioid refill among ‘opioid naive’ patients. We used multivariable linear regression to predict the average number of days of supply and the average number of refills provided after adjusting for patient factors. We reported odds ratios with 95% confidence interval for each of the independent variable, with an alpha error set at 5%. We compared utilization of opioid between ‘opioid naive’ patients and ‘opioid exposed’ patients by performing multivariate regression models with whether received opioid before surgery as the primary predictor, controlling for all other patient factors and type of procedure underwent. We then calculated adjusted rate of opioid use, refill and days of supply between the two groups. We used logistic regression to identify the prevalence of indicators of inappropriate use of opioid prescriptions among patients who were using opioid medications preoperatively and those who were not. All analyses were conducted using SAS 9.3 and Stata 13.0 (Statacorp; College Station, Texas).
Results
The demographic characteristics of the study population are detailed in Table 1. We identified 296,452 patients who underwent one of four common, elective, outpatient procedures from 2009 to 2013: primary CTR (n=185,589 patients), CuTR (n=16,086 patients), CMC arthroplasty/arthrodesis (n=19,808 patients), and TFR (n=74,969 patients). The majority of patients were ages 45 and older across all procedures. Women more commonly underwent CTR (65%), CMC arthroplasty/arthrodesis (78%), and TFR (64%) compared with men. There were no significant differences in the distribution of median income across each of the procedures. The majority of patients held PPO-based insurance plans, and had few comorbid conditions. Across all procedures, 58.5% (n=135,869) filled a prescription for opioid analgesics in the postoperative period. On average, prescriptions were filled for 7.3 days, and 4.5% of patients received a prescription refill. In this cohort, 8.1% of patients received prescriptions for 2 or more opioid analgesics. Finally, 21.5% of patients had filled a previous prescription for opioid analgesics within 6 weeks prior to surgery.
Table 1.
Characteristics of the study cohort by procedure type (N=296,452)
| Patient characteristics | Carpal Tunnel Release | Cubital Tunnel release | CMC arthroplasty/arthrodesis | Trigger Finger Release |
|---|---|---|---|---|
| Age | ||||
| 18–34 | 10354 (6%) | 1848 (11%) | 50 (0%) | 993 (1%) |
| 35–44 | 25115 (14%) | 2739 (17%) | 471 (2%) | 3916 (5%) |
| 45–54 | 52007 (28%) | 4554 (28%) | 4677 (24%) | 18991 (25%) |
| 55–64 | 58703 (32%) | 4799 (30%) | 10429 (53%) | 33632 (45%) |
| 65 and older | 39410 (21%) | 2146 (13%) | 4181 (21%) | 17437 (23%) |
| Sex | ||||
| Male | 65218 (35%) | 8605 (53%) | 4135 (21%) | 26874 (36%) |
| Female | 120371 (65%) | 7481 (47%) | 15673 (79%) | 48095 (64%) |
| Quartile of median house income | ||||
| <=$40,000 | 5181 (3%) | 464 (3%) | 500 (3%) | 1979 (3%) |
| $40,000–$50,000 | 50799 (27%) | 4217 (26%) | 5471 (28%) | 19934 (27%) |
| $50,000–$60,000 | 63685 (34%) | 6031 (37%) | 7296 (37%) | 27333 (36%) |
| $60,000–$70,000 | 17450 (9%) | 1438 (9%) | 2242 (11%) | 8485 (11%) |
| >$70,000 | 5968 (3%) | 535 (3%) | 750 (4%) | 2934 (4%) |
| Missing | 42506 (23%) | 3401 (21%) | 3549 (18%) | 14304 (19%) |
| Region | ||||
| Northeast | 34926 (19%) | 2574 (16%) | 3268 (16%) | 13226 (18%) |
| North Central | 55208 (30%) | 4725 (29%) | 5270 (27%) | 21314 (28%) |
| South | 66443 (36%) | 6170 (38%) | 7144 (36%) | 26169 (35%) |
| West | 26218 (14%) | 2370 (15%) | 3802 (19%) | 13178 (18%) |
| Missing | 2794 (2%) | 247 (2%) | 324 (2%) | 1082 (1%) |
| Insurance Plan | ||||
| PPO | 105810 (57%) | 9499 (59%) | 11607 (59%) | 42105 (56%) |
| Comprehensive | 19361 (10%) | 1196 (7%) | 1837 (9%) | 8463 (11%) |
| HMO | 22762 (12%) | 1996 (12%) | 2414 (12%) | 10127 (14%) |
| POS | 13210 (7%) | 1294 (8%) | 1341 (7%) | 5477 (7%) |
| Other | 11513 (6%) | 1159 (7%) | 1392 (7%) | 4665 (6%) |
| Missing | 12933 (7%) | 942 (6%) | 1217 (6%) | 4132 (6%) |
| Comorbidity score | ||||
| 0 | 76691 (41%) | 6362 (40%) | 7161 (36%) | 31886 (43%) |
| 1–3 | 19911 (11%) | 1751 (11%) | 2243 (11%) | 7190 (10%) |
| 4–8 | 44061 (24%) | 3868 (24%) | 5037 (25%) | 17227 (23%) |
| >8 | 44926 (24%) | 4105 (26%) | 5367 (27%) | 18666 (25%) |
| Filled a prescription for opioid analgesics within 6 weeks prior to surgery | ||||
| Yes | 41557 (22%) | 4557 (28%) | 5737 (29%) | 12515 (17%) |
| No | 144032 (78%) | 11529 (72%) | 14071 (71%) | 62454 (83%) |
Table 2 details the overall opioid utilization by procedure type. Patients who underwent CMC arthroplasty/arthrodesis most commonly filled a prescription for opioid analgesics following surgery (74%), followed by CuTR (71%), CTR (62%), and TFR (51%). Hydrocodone-based opioids were the most commonly filled type of opioid ranging from 52% (CMC arthroplasty/arthrodesis) to 61% (TFR). The average number of days of prescription supply was longest for patients who underwent CMC arthroplasty/arthrodesis (15.4 days), compared to 10.1 days (TFR), 14.8 days (CuTR) and 12.0 days (CTR) for other procedures. Refill prescriptions were highest among patients who underwent CMC arthropasty/arthrodesis (12%), followed by CuTR(11%), CTR (9%), and TFR (7%). In this sample, 21.5% of patients who underwent CMC arthroplasty/arthrodesis filled 2 or more different opioid prescriptions in the postoperative period, followed by CuTR (11.7%), CTR (7.2%), and TFR (5.2%).
Table 2.
The utilization of opioid analgesics following four common outpatient upper extremity surgical procedures. (N=296,452)
| Opioid following surgical procedures† | Proportion of patients who filled a prescription for opioid analgesics | Proportion of each type of opioid filled | Average number of days supply | Proportion of patients who refilled prescription |
|---|---|---|---|---|
| Carpal Tunnel Release | ||||
| Hydrocodone | 42% | 66% | 9.1 | 11% |
| Oxycodone | 12% | 17% | 11.5 | 6% |
| Tramadol | 2% | 6% | 19.3 | 13% |
| Codeine phosphate | 4% | 7% | 6.5 | 6% |
| Other | 2% | 3% | 27.9 | 10% |
| Total | 62% | 100% | 12.0 | 9% |
| Cubital Tunnel release | ||||
| Hydrocodone | 42% | 61% | 11.2 | 15% |
| Oxycodone | 23% | 27% | 11.2 | 7% |
| Tramadol | 1% | 5% | 19.9 | 9% |
| Codeine phosphate | 2% | 3% | 8.5 | 8% |
| Other | 3% | 5% | 27.3 | 10% |
| Total | 71% | 100% | 14.8 | 11% |
| CMC arthroplasty/arthrodesis | ||||
| Hydrocodone | 33% | 52% | 11.7 | 19% |
| Oxycodone | 34% | 34% | 9.5 | 7% |
| Tramadol | 1% | 6% | 21.6 | 18% |
| Codeine phosphate | 1% | 3% | 10.2 | 11% |
| Other | 5% | 6% | 15.3 | 9% |
| Total | 74% | 100% | 15.4 | 12% |
| Trigger Finger Release | ||||
| Hydrocodone | 36% | 67% | 7.7 | 8% |
| Oxycodone | 8% | 14% | 11 | 5% |
| Tramadol | 2% | 7% | 18.2 | 11% |
| Codeine phosphate | 4% | 9% | 5.9 | 4% |
| Other | 1% | 3% | 26.5 | 8% |
| Total | 51% | 100% | 10.1 | 7% |
We examined the relationship between type of surgery and the receipt of opioid prescription medication, adjusting for patient characteristics. (Figure 1) Patients who underwent CMC arthroplasty/arthrodesis had the highest rates of filling an opioid prescription following surgery (75%), followed by CuTR (69%). In contrast, patients who underwent CTR and TFR filled opioid prescriptions less frequently (60% and 51% respectively).
Figure 1. Receipt of opioid prescription by type of surgery performed, adjusted for patient characteristics. (N=296,452).
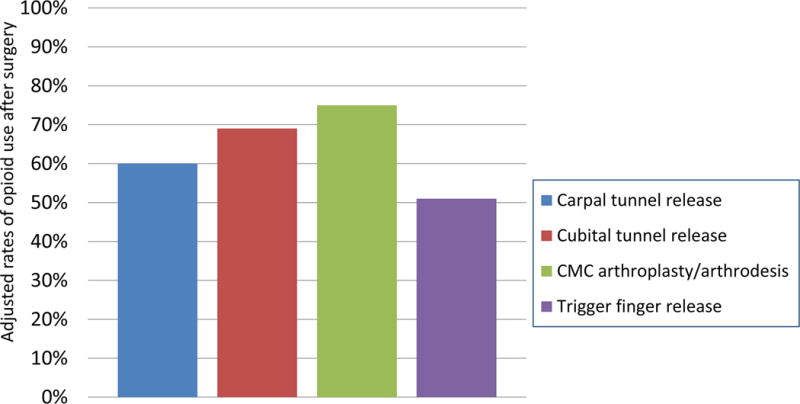
Adjusted rates by procedure were calculated from multivariable logistic regression model, controlling for all patient characteristics including age, sex, median house income, region, insurance type and comorbidity conditions. Carpal tunnel cases was used as the reference group. P<0.001 for each of the comparison.
Table 3 details the factors correlated with filling an opioid prescription following surgery among patients who were opioid “naïve”. We observed a linear decline in the odds of filling an opioid prescription following surgery with patient age. Compared with patients 18 to 34 years, patients ages 65 and older were less likely to fill an opioid prescription (OR=0.47; 95%: 0.45 – 0.50), as were patients ages 55 to 64 (OR=0.65; 95%CI: 0.62 – 0.68), and patients ages 45–54 (OR=0.76; 95% CI: 0.72 – 0.79). Additionally, we observed that patients with more restrictive coverage through HMO insurance plans were less likely to fill a prescription for opioids compared with patients who had PPO plans (OR=0.85, 95% CI: 0.83–0.87, p<0.001).
Table 3.
Correlates of filling a prescription for opioid analgesics following elective, outpatient upper extremity surgery among opioid naïve patients. (N=232,086)
| Patient characteristics | Odds ratio of opioid use (95% CI)¥ | P values |
|---|---|---|
| Type of surgery* | ||
| CTR (reference group) | 1 | – |
| CuTR | 1.40 (1.34–1.46) | <0.001 |
| CMC arthroplasty or arthrodesis | 1.91 (1.84–1.99) | <0.001 |
| TFR | 0.68 (0.67–0.70) | <0.001 |
| Age | ||
| 18–34 | 1 | |
| 35–44 | 0.94 (0.89–0.99) | 0.02 |
| 45–54 | 0.76 (0.72–0.79) | <0.001 |
| 55–64 | 0.65 (0.62–0.68) | <0.001 |
| 65 and older | 0.47 (0.45–0.50) | <0.001 |
| Sex | ||
| Male | 1 | |
| Female | 0.94 (0.92–0.96) | <0.001 |
| Quartile of median house income | ||
| <=$40,000 | 1 | |
| $40,000–$50,000 | 0.93 (0.89–0.98) | 0.006 |
| $50,000–$60,000 | 0.86 (0.81–0.90) | <0.001 |
| $60,000–$70,000 | 1.02 (0.96–1.08) | 0.54 |
| >$70,000 | 0.86 (0.81–0.92) | <0.001 |
| Insurance type | ||
| PPO | 1 | |
| Comprehensive | 0.97 (0.94–1.01) | 0.10 |
| HMO | 0.85 (0.83–0.87) | <0.001 |
| POS | 1.02 (0.99–1.06) | 0.19 |
| Other | 1.06 (1.02–1.10) | 0.001 |
| Comorbidity score | ||
| 0 | 1 | |
| 1–3 | 1.21 (1.17–1.25) | <0.001 |
| 4–8 | 1.10 (1.07–1.14) | <0.001 |
| >8 | 0.83 (0.80–0.85) | <0.001 |
Odds ratios were calculated from multivariable logistic regression model using whether used opioid within 6 weeks after the surgery as the dependent variable and all variables in this table as the covariates.
CTR: carpal tunnel release; CuTR: cubital tunnel release; CMC arthroplasty or arthrodesis: thumb carpometacarpal joint arthroplasty or arthrodesis; TFR: trigger finger release
We examined the patient factors correlated with receiving a refill of opioids following surgery (Table 4). Patients who underwent CMC arthroplasty/arthrodesis (OR=1.41, 95% CI: 1.32–1.50) or CuTR (OR=1.24, 95% CI:1.15–1.33) were more likely to receive refills compared with patients who underwent CTR. Additionally, the probability of receiving a refill declined with advancing age. For example, compared with patients who were 18 to 34 years old, patients 65 or older were less likely to receive refill of opioids (OR=0.77, 95% CI: 0.69–0.85,p<0.001). The odds of receiving a refill was also correlated with socioeconomic status, and patients who resided in areas with the highest median household income were less likely to receive refills (OR=0.57, 95% CI: 0.49–0.67, p<0.001) compared to patients residing in areas of lower median household income.
Table 4.
Correlates of receiving a refill for opioid analgesics after elective upper extremity surgery among opioid naïve patients (N=232,086)
| Patient characteristics | Odds receiving refill of opioid prescription following surgery (95% CI) | P values |
|---|---|---|
| Type of surgery* | ||
| CTR (reference group) | 1 | – |
| CuTR | 1.24 (1.15–1.33) | <0.001 |
| CMC arthroplasty or arthrodesis | 1.41 (1.32–1.50) | <0.001 |
| TFR | 0.75 (0.71–0.79) | <0.001 |
| Age | ||
| 18–34 | 1 | |
| 35–44 | 0.97 (0.88–1.07) | 0.53 |
| 45–54 | 0.98 (0.90–1.07) | 0.70 |
| 55–64 | 0.90 (0.82–0.98) | 0.02 |
| 65 and older | 0.77 (0.69–0.85) | <0.001 |
| Sex | ||
| Male | 1 | |
| Female | 1.08 (1.03–1.12) | 0.001 |
| Quartile of median house income | ||
| <=$40,000 | 1 | |
| $40,000-$50,000 | 0.96 (0.88–1.06) | 0.46 |
| $50,000-$60,000 | 0.87 (0.79–0.96) | 0.006 |
| $60,000-$70,000 | 0.52 (0.46–0.58) | <0.001 |
| >$70,000 | 0.57 (0.49–0.67) | <0.001 |
| Insurance type | ||
| PPO | 1 | |
| Comprehensive | 1.06 (0.99–1.15) | 0.09 |
| HMO | 0.93 (0.88–0.99) | 0.02 |
| POS | 0.94 (0.87–1.01) | 0.10 |
| Other | 0.87 (0.80–0.94) | <0.001 |
| Comorbidity score | ||
| 0 | 1 | |
| 1–3 | 1.51 (1.40–1.63) | <0.001 |
| 4–8 | 1.44 (1.34–1.56) | <0.001 |
| >8 | 1.41 (1.30–1.52) | <0.001 |
CTR: carpal tunnel release; CuTR: cubital tunnel release; CMC arthroplasty or arthrodesis: thumb carpometacarpal joint arthroplasty or arthrodesis; TFR: trigger finger release
We compared differences in the utilization of opioids following surgery between individuals who had received opioid prescriptions within 6 weeks prior to surgery and those who had not (Table 5). After adjusting for other patient characteristics, patients who had previously received opioids were more likely to receive a prescription for opioids following surgery (65.6% vs. 58.5%, p<0.001), receive longer prescriptions (23.5 days vs. 4.5 days, p<0.001), and receive refills following surgery (23.9% vs. 4.5%, p<0.001).
Table 5.
Utilization of opioid after surgery between patients who used opioid before surgery and patients without opioid use before surgery
| “Opioid-exposed” patients | “Opioid-naïve” patients | P values | |
|---|---|---|---|
| Adjusted rate of opioid use after surgery* | 65.6% | 58.5% | <0.001 |
| Adjusted average days of opioid supply† | 23.5 | 4.5 | <0.001 |
| Adjusted rate of opioid refill after surgery* | 23.9% | 4.5% | <0.001 |
Adjusted rates were calculated from multivariable logistic regression models controlling for all patient characteristics and procedure received. Reference group was the patients who did not use opioid before surgery.
Adjusted average days were calculated from multivariable linear regression model controlling for all patient characteristics and procedure received. Reference group was the patients who did not use opioid before surgery.
Finally, we examined indicators of inappropriate opioid use (Table 6). Approximately 8.8% in this cohort had at least one indicator of potentially inappropriate prescribing, most commonly daily doses of 100 MMEs or higher (6.9%). In multivariate analysis, preoperative opioid exposure was the strongest predictor of overlapping opioid prescriptions (OR=18.4; 95% CI: 17.00–19.93); overlap of opioid and benzodiazepine prescriptions (OR=20.2; 95% CI: 19.16 – 22.37), and high daily opioid doses (OR=2.1; 95% CI: 2.01 – 2.15).
Table 6.
Correlates of inappropriate prescribing for opioid analgesics following upper extremity surgical procedures. (N=296,452)
| Opioid overlap | Opioid + benzodiazepine overlap | Daily opioid doses >100MME | ||||
|---|---|---|---|---|---|---|
| Odds ratio (95% CI)¥ | P-value | Odds ratio (95% CI)¥ | P-value | Odds ratio (95% CI)¥ | P-value | |
| Procedure | ||||||
| CTR | 1 | 1 | 1 | |||
| CuTR | 1.4 (1.23 – 1.52) | <.0001 | 1.5 (1.35 – 1.75) | <.0001 | 1.6 (1.54 – 1.74) | <.0001 |
| CMC arthroplasty/arthrodesis | 1.5 (1.39 – 1.68) | <.0001 | 1.5 (1.31 – 1.66) | <.0001 | 3.2 (3.05 – 3.36) | <.0001 |
| TFR | 0.7 (0.96 – 1.32) | <.0001 | 0.8 (0.71 – 0.88) | <.0001 | 0.8 (0.72 – 0.79) | <.0001 |
| Age | ||||||
| 18–34 | 1 | 1 | 1 | |||
| 35–44 | 1.1 (0.96 – 1.32) | <.0001 | 1.3 (1.09 – 1.62) | <.0001 | 0.1.0 (0.87 – 1.03) | <.0001 |
| 45–54 | 1.1 (0.91 – 1.22) | <.0001 | 1.2 (1 – 1.45) | <.0001 | 0.8 (0.74 – 0.86) | <.0001 |
| 55–64 | 0.9 (0.76 – 1.02) | 0.69 | 0.9 (0.75 – 1.1) | 0.53 | 0.7 (0.62 – 0.73) | <.0001 |
| 65 and older | 0.5 (0.46 – 0.63) | <.0001 | 0.5 (0.39 – 0.6) | <.0001 | 0.4(0.39 – 0.47) | <.0001 |
| Gender | ||||||
| Male | 1 | 1 | 1 | |||
| Female | 1.0 (0.94 – 1.07) | 0.98 | 1.4 (1.26 – 1.49) | <.0001 | 0.9 (0.87 – 0.93) | <.0001 |
| Annual household income | ||||||
| <=$40,000 | 1 | 1 | 1 | |||
| $40,000–$50,000 | 1.0 (0.86 – 1.20) | 0.11 | 0.8 (0.62 – 0.9) | 0.57 | 1.3 (1.19 – 1.44) | <.0001 |
| $50,000–$60,000 | 1.0 (0.83 – 1.14) | 0.80 | 0.7 (0.58 – 0.83) | 0.01 | 0.9 (0.84 – 1.01) | <.0001 |
| $60,000–$70,000 | 1.1 (0.91 – 1.31) | 0.00 | 0.8 (0.65 – 0.98) | 0.39 | 1.1 (1.01 – 1.23) | <.0001 |
| >$70,000 | 0.8 (0.62 – 0.97) | 0.00 | 0.6 (0.49 – 0.81) | 0.01 | 0.8 (0.71 – 0.91) | <.0001 |
| Insurance type | ||||||
| PPO | 1 | 1 | 1 | |||
| Comprehensive | 1.3 (1.11 – 1.40) | <.0001 | 1.6 (1.42 – 1.88) | <.0001 | 0.7 (0.68 – 0.79) | <.0001 |
| HMO | 0.8 (0.80 – 0.95) | 0.00 | 1.0 (0.9 – 1.12) | 0.07 | 1.1 (1.02 – 1.12) | <.0001 |
| POS | 0.9 (0.82 – 1.03) | 0.14 | 0.9 (0.77 – 1.03) | 0.00 | 1.2 (1.14 – 1.28) | <.0001 |
| Other | 0.9 (0.83 – 1.06) | 0.29 | 1.1 (0.93 – 1.24) | 0.73 | 1.0 (0.92 – 1.05) | 0.88 |
| Comorbid conditions | ||||||
| 0 | 1 | 1 | 1 | |||
| 1 – 3 | 1.4 (1.23 – 1.52) | 0.66 | 1.7 (1.47 – 1.9) | 0.02 | 1.2 (1.12 – 1.25) | 0.04 |
| 4 – 8 | 1.4 (1.24 – 1.46) | 0.96 | 1.5 (1.38 – 1.7) | 0.66 | 1.1 (1.08 – 1.18) | 0.56 |
| >8 | 1.8 (1.66 – 1.93) | <.0001 | 2.0 (1.84 – 2.24) | <.0001 | 1.3 (1.19 – 1.3) | <.0001 |
| Preoperative opioid use | ||||||
| “Opioid-naïve” patients | 1 | 1 | 1 | |||
| “Opioid-exposed” patients | 18.4 (17.00 – 19.93) | <.0001 | 20.2 (18.16 – 22.37) | <.0001 | 2.1 (2.01 – 2.15) | <.0001 |
Discussion
Over half of patients who undergo common, outpatient, elective hand surgery procedures receive prescriptions for opioid analgesics, most commonly hydrocodone-based medications. In contrast, less potent opioid analgesics, such as tramadol or codeine-based medications, are infrequently filled. Up to 16% of patients receive high doses of opioids following routine, outpatient hand procedures, and inappropriate prescribing patterns are seen more commonly among patients who are using opioid medications preoperatively. Opioid prescriptions are less commonly filled by older individuals, and the typical length of opioid therapy prescribed is shorter and the number of refills is lower compared with younger patients. Finally, patients who have recently filled a prescription for opioids prior to surgery are more likely to fill postoperative prescriptions of longer durations, receive additional refills of opioid medications, and have much higher proportion of opioid overlap incidents, opioid and benzodiazepine overlap incidents, and high daily opioid doses incidents.
Previous studies demonstrate wide variation in analgesic prescribing practices following hand surgery procedures.27,28 Similar to our findings, Rodgers et al. reported that opioid needs were higher among patients who underwent bony-related procedures, and lower among Medicare beneficiaries.28 Although this study was conducted within a single center, the authors noted that nearly two-thirds of the pills in a single prescription went unused, which underscores the need for appropriate prescribing practices to prevent excess opioid medications reaching unintended users. In addition, our study highlights the important influence of patient characteristics on opioid prescribing. We identified that the need for opioid analgesics is closely associated with patient age, the type of procedure that is performed, and the pre-existing use of opioid medications. Previous studies have also demonstrated that patients’ psychosocial stressors and coping skills have a significant effect on postoperative pain management.29,30 Furthermore, patients with pre-existing pain syndromes, such as fibromyalgia, are more likely to consume opioid analgesics following surgery.31,32 Therefore, identifying patients prior to surgery who are expected to require increased doses or prolonged courses of opioid analgesics could help providers tailor their prescribing practices more effectively toward those patients who will derive the greatest benefit with the lowest risk.33
Our study has several notable limitations. First, this study is an analysis of administrative claims data, which lacks sufficient specificity to determine the extent of pain that patients experience following surgery or more granular patient factors that could be influencing opioid consumption. Therefore, we cannot know if the prescription rates are overly high or inappropriately low compared with patient-reported pain scores. From claims data, it is also difficult to discern technical nuances of procedures. For example, we cannot determine if patients underwent in situ cubital tunnel release or if additional neurolysis and transposition was performed. Additionally, we did not include the use of non-opioid alternative prescriptions as these are readily available, and patients may have purchased these medications over the counter without insurance coverage. Therefore, the extent to which these alternatives influence the utilization of opioids following common hand surgery procedures cannot be discerned from this data. This analysis includes only patients who filled prescriptions, and it is possible that patients the received a prescription but did not fill the prescription is actually much higher. Finally, we observed that patients who were covered by HMO plans were less likely to receive refills of opioid medications compared with patients covered by PPO plans. However, the extent to which finer aspects of insurance coverage influence utilization, such as co-payment, remain uncertain.
Achieving acceptable pain control is considered a key indicator of healthcare quality across many conditions. Opioid prescriptions in the United States have risen dramatically in recent years, and surgeons prescribe over 35% of all dispensed opioid medications.34,35 In the United States, there is a keen awareness of pain as a component of health status, and has been termed the “5th vital sign.”36 The expectation of postoperative pain remains the most common fear among patients undergoing surgery, and achieving adequate pain control following surgery remains elusive. For example, a recent survey of a random sample of 250 adults who recently underwent surgical procedures revealed nearly 70% experienced moderate-to-severe pain following surgery.37,38 Poorly managed pain is a common reason for readmission, and is correlated with poor patient satisfaction and experience.39,40 Nonetheless, clear evidence to guide clinicians regarding the utilization of opioid analgesics and their alternatives is sparse, which likely contributes to variable and inappropriate prescribing patterns.41–43 Geographic differences further highlight the important role that providers play in opioid prescribing, and previous studies have shown that educational interventions to tailor prescribing practices are effective in reducing opioid prescriptions.22,44 Our findings underscore the importance of identifying patients who may be at risk of poor pain control preoperatively in order to avoid inappropriate, and potentially dangerous, prescribing practices following surgery. Given recent evidence regarding the risk of opioid use, this analysis highlights an opportunity for surgeons to include opioid use as a risk factor when for considering patients for surgery and identify strategies to curb use with alternatives whenever possible.2 Future studies that examine the provider-level factors that are associated with opioid prescribing can offer greater insight regarding areas to target educational initiatives and provide clinical guidelines for providers who commonly manage postoperative pain.
Opioids are commonly prescribed following hand surgery procedures, but less potent opioid analgesics, such as codeine or tramadol, are infrequently used. Patients who are younger, undergo bony procedures, and are currently using opioid analgesics may be likely to require a longer supply of postoperative opioids for pain control. Beyond these patient characteristics, the regional variation in opioid utilization underscores the need for rigorous evidence to discern appropriate prescribing practices and curb the excess availability of these potent analgesics.
Supplementary Material
Acknowledgments
Research reported in this publication was supported by the National Institute of Arthritis and Musculoskeletal and Skin Diseases of the National Institutes of Health under Award Number 2 K24-AR053120-06 (To Dr. Chung), and a Mentored Clinical Investigator Award to Dr. Waljee through the Agency for Healthcare Research and Quality (1K08HS023313-01).
References
- 1.Kolodny A, Courtwright DT, Hwang CS, et al. The prescription opioid and heroin crisis: a public health approach to an epidemic of addiction. Annual review of public health. 2015 Mar 18;36:559–574. doi: 10.1146/annurev-publhealth-031914-122957. [DOI] [PubMed] [Google Scholar]
- 2.Miller M, Barber CW, Leatherman S, et al. Prescription Opioid Duration of Action and the Risk of Unintentional Overdose Among Patients Receiving Opioid Therapy. JAMA internal medicine. 2015 Feb 16; doi: 10.1001/jamainternmed.2014.8071. [DOI] [PubMed] [Google Scholar]
- 3.Bohnert AS, Valenstein M, Bair MJ, et al. Association between opioid prescribing patterns and opioid overdose-related deaths. Jama. 2011 Apr 6;305(13):1315–1321. doi: 10.1001/jama.2011.370. [DOI] [PubMed] [Google Scholar]
- 4.Calcaterra S, Glanz J, Binswanger IA. National trends in pharmaceutical opioid related overdose deaths compared to other substance related overdose deaths: 1999–2009. Drug and alcohol dependence. 2013 Aug 1;131(3):263–270. doi: 10.1016/j.drugalcdep.2012.11.018. [DOI] [PMC free article] [PubMed] [Google Scholar]
- 5.Bohnert AS, Ilgen MA, Trafton JA, et al. Trends and regional variation in opioid overdose mortality among Veterans Health Administration patients, fiscal year 2001 to 2009. The Clinical journal of pain. 2014 Jul;30(7):605–612. doi: 10.1097/AJP.0000000000000011. [DOI] [PubMed] [Google Scholar]
- 6.Manchikanti L, Helm S, 2nd, Fellows B, et al. Opioid epidemic in the United States. Pain physician. 2012 Jul;15(3 Suppl):ES9–38. [PubMed] [Google Scholar]
- 7.Paulozzi LJ, Mack KA, Hockenberry JM, Division of Unintentional Injury Prevention NCfIP, Control CDC Vital signs: variation among States in prescribing of opioid pain relievers and benzodiazepines - United States, 2012. MMWR Morb Mortal Wkly Rep. 2014 Jul 4;63(26):563–568. [PMC free article] [PubMed] [Google Scholar]
- 8.Wright EA, Katz JN, Abrams S, Solomon DH, Losina E. Trends in prescription of opioids from 2003–2009 in persons with knee osteoarthritis. Arthritis Care Res (Hoboken) 2014 Oct;66(10):1489–1495. doi: 10.1002/acr.22360. [DOI] [PMC free article] [PubMed] [Google Scholar]
- 9.Paulozzi LJ, Weisler RH, Patkar AA. A national epidemic of unintentional prescription opioid overdose deaths: how physicians can help control it. The Journal of clinical psychiatry. 2011 May;72(5):589–592. doi: 10.4088/JCP.10com06560. [DOI] [PubMed] [Google Scholar]
- 10.America’s most popular drugs. http://www.forbes.com/2010/05/11/narcotic-painkiller-vicodin-business-healthcare-popular-drugs.html. Accessed January 10, 2014.
- 11.Kahan M, Mailis-Gagnon A, Wilson L, Srivastava A, National Opioid Use Guideline G Canadian guideline for safe and effective use of opioids for chronic noncancer pain: clinical summary for family physicians. Part 1: general population. Canadian family physician Medecin de famille canadien. 2011 Nov;57(11):1257–1266. e1407–1218. [PMC free article] [PubMed] [Google Scholar]
- 12.Kahan M, Wilson L, Mailis-Gagnon A, Srivastava A, National Opioid Use Guideline G Canadian guideline for safe and effective use of opioids for chronic noncancer pain: clinical summary for family physicians. Part 2: special populations. Canadian family physician Medecin de famille canadien. 2011 Nov;57(11):1269–1276. e1419–1228. [PMC free article] [PubMed] [Google Scholar]
- 13.Streltzer J, Ziegler P, Johnson B, American Academy of Addiction P Cautionary guidelines for the use of opioids in chronic pain. The American journal on addictions / American Academy of Psychiatrists in Alcoholism and Addictions. 2009 Jan-Feb;18(1):1–4. doi: 10.1080/10550490802544508. [DOI] [PubMed] [Google Scholar]
- 14.Waxman BP. Medicine in small doses: Avoiding prolonged opioid prescribing after major surgery. ANZ journal of surgery. 2014 May;84(5):304. doi: 10.1111/ans.12577. [DOI] [PubMed] [Google Scholar]
- 15.Alvarez MP, Foley KE, Zebley DM, Fassler SA. Comprehensive enhanced recovery pathway significantly reduces postoperative length of stay and opioid usage in elective laparoscopic colectomy. Surgical endoscopy. 2014 Dec 6; doi: 10.1007/s00464-014-4006-8. [DOI] [PubMed] [Google Scholar]
- 16.Kehlet H, Jensen TS, Woolf CJ. Persistent postsurgical pain: risk factors and prevention. Lancet. 2006 May 13;367(9522):1618–1625. doi: 10.1016/S0140-6736(06)68700-X. [DOI] [PubMed] [Google Scholar]
- 17.Huang A, Katz J, Clarke H. Ensuring safe prescribing of controlled substances for pain following surgery by developing a transitional pain service. Pain management. 2015 Mar;5(2):97–105. doi: 10.2217/pmt.15.7. [DOI] [PubMed] [Google Scholar]
- 18.Clarke H, Soneji N, Ko DT, Yun L, Wijeysundera DN. Rates and risk factors for prolonged opioid use after major surgery: population based cohort study. Bmj. 2014;348:g1251. doi: 10.1136/bmj.g1251. [DOI] [PMC free article] [PubMed] [Google Scholar]
- 19.Menendez ME, Ring D, Bateman BT. Preoperative Opioid Misuse is Associated With Increased Morbidity and Mortality After Elective Orthopaedic Surgery. Clinical orthopaedics and related research. 2015 Feb 19; doi: 10.1007/s11999-015-4173-5. [DOI] [PMC free article] [PubMed] [Google Scholar]
- 20.Hollenbeck BK, Hollingsworth JM, Dunn RL, Zaojun Y, Birkmeyer JD. Ambulatory surgery center market share and rates of outpatient surgery in the elderly. Surg Innov. 2010 Dec;17(4):340–345. doi: 10.1177/1553350610377211. [DOI] [PubMed] [Google Scholar]
- 21.Fajardo M, Kim SH, Szabo RM. Incidence of carpal tunnel release: trends and implications within the United States ambulatory care setting. J Hand Surg Am. 2012 Aug;37(8):1599–1605. doi: 10.1016/j.jhsa.2012.04.035. [DOI] [PubMed] [Google Scholar]
- 22.Gordon CR, Pryor L, Afifi AM, et al. Hand surgery volume and the US economy: is there a statistical correlation? Annals of plastic surgery. 2010 Nov;65(5):471–474. doi: 10.1097/SAP.0b013e3181d377ac. [DOI] [PubMed] [Google Scholar]
- 23.Jain NB, Higgins LD, Losina E, Collins J, Blazar PE, Katz JN. Epidemiology of musculoskeletal upper extremity ambulatory surgery in the United States. BMC Musculoskelet Disord. 2014;15:4. doi: 10.1186/1471-2474-15-4. [DOI] [PMC free article] [PubMed] [Google Scholar]
- 24.Logan J, Liu Y, Paulozzi L, Zhang K, Jones C. Opioid prescribing in emergency departments: the prevalence of potentially inappropriate prescribing and misuse. Med Care. 2013 Aug;51(8):646–653. doi: 10.1097/MLR.0b013e318293c2c0. [DOI] [PubMed] [Google Scholar]
- 25.Liu Y, Logan JE, Paulozzi LJ, Zhang K, Jones CM. Potential misuse and inappropriate prescription practices involving opioid analgesics. The American journal of managed care. 2013 Aug;19(8):648–665. [PubMed] [Google Scholar]
- 26.Sullivan MD, Edlund MJ, Fan MY, Devries A, Brennan Braden J, Martin BC. Trends in use of opioids for non-cancer pain conditions 2000–2005 in commercial and Medicaid insurance plans: the TROUP study. Pain. 2008 Aug 31;138(2):440–449. doi: 10.1016/j.pain.2008.04.027. [DOI] [PMC free article] [PubMed] [Google Scholar]
- 27.Stanek JJ, Renslow MA, Kalliainen LK. The effect of an educational program on opioid prescription patterns in hand surgery: a quality improvement program. J Hand Surg Am. 2015 Feb;40(2):341–346. doi: 10.1016/j.jhsa.2014.10.054. [DOI] [PubMed] [Google Scholar]
- 28.Rodgers J, Cunningham K, Fitzgerald K, Finnerty E. Opioid consumption following outpatient upper extremity surgery. J Hand Surg Am. 2012 Apr;37(4):645–650. doi: 10.1016/j.jhsa.2012.01.035. [DOI] [PubMed] [Google Scholar]
- 29.Vranceanu AM, Jupiter JB, Mudgal CS, Ring D. Predictors of pain intensity and disability after minor hand surgery. J Hand Surg Am. 2010 Jun;35(6):956–960. doi: 10.1016/j.jhsa.2010.02.001. [DOI] [PubMed] [Google Scholar]
- 30.Vranceanu AM, Bachoura A, Weening A, Vrahas M, Smith RM, Ring D. Psychological factors predict disability and pain intensity after skeletal trauma. J Bone Joint Surg Am. 2014 Feb 5;96(3):e20. doi: 10.2106/JBJS.L.00479. [DOI] [PubMed] [Google Scholar]
- 31.Brummett CM, Janda AM, Schueller CM, et al. Survey criteria for fibromyalgia independently predict increased postoperative opioid consumption after lower-extremity joint arthroplasty: a prospective, observational cohort study. Anesthesiology. 2013 Dec;119(6):1434–1443. doi: 10.1097/ALN.0b013e3182a8eb1f. [DOI] [PMC free article] [PubMed] [Google Scholar]
- 32.Janda AM, As-Sanie S, Rajala B, et al. Fibromyalgia Survey Criteria Is Associated with Increased Postoperative Opioid Consumption in Women Undergoing Hysterectomy. Anesthesiology. 2015 Mar 12; doi: 10.1097/ALN.0000000000000637. [DOI] [PubMed] [Google Scholar]
- 33.Alassaad A, Melhus H, Hammarlund-Udenaes M, Bertilsson M, Gillespie U, Sundstrom J. A tool for prediction of risk of rehospitalisation and mortality in the hospitalised elderly: secondary analysis of clinical trial data. BMJ open. 2015;5(2):e007259. doi: 10.1136/bmjopen-2014-007259. [DOI] [PMC free article] [PubMed] [Google Scholar]
- 34.Levy B, Paulozzi L, Mack KA, Jones CM. Trends in Opioid Analgesic-Prescribing Rates by Specialty, U.S., 2007–2012. Am J Prev Med. 2015 Apr 17; doi: 10.1016/j.amepre.2015.02.020. [DOI] [PMC free article] [PubMed] [Google Scholar]
- 35.Kuehn BM. Opioid prescriptions soar. Jama. 2007;297(3):249–251. doi: 10.1001/jama.297.3.249. [DOI] [PubMed] [Google Scholar]
- 36.Lorenz KA, Sherbourne CD, Shugarman LR, et al. How reliable is pain as the fifth vital sign? Journal of the American Board of Family Medicine : JABFM. 2009 May-Jun;22(3):291–298. doi: 10.3122/jabfm.2009.03.080162. [DOI] [PubMed] [Google Scholar]
- 37.Apfelbaum JL, Chen C, Mehta SS, Gan TJ. Postoperative pain experience: results from a national survey suggest postoperative pain continues to be undermanaged. Anesth Analg. 2003;97(2):534–540. doi: 10.1213/01.ANE.0000068822.10113.9E. [DOI] [PubMed] [Google Scholar]
- 38.Wu CL, Raja SN. Treatment of acute postoperative pain. The Lancet. 2011;377(9784):2215–2225. doi: 10.1016/S0140-6736(11)60245-6. [DOI] [PubMed] [Google Scholar]
- 39.Curtin CM, Hernandez-Boussard T. Readmissions after treatment of distal radius fractures. J Hand Surg Am. 2014 Oct;39(10):1926–1932. doi: 10.1016/j.jhsa.2014.07.041. [DOI] [PubMed] [Google Scholar]
- 40.Chang CB, Cho WS. Pain management protocols, peri-operative pain and patient satisfaction after total knee replacement: a multicentre study. J Bone Joint Surg Br. 2012 Nov;94(11):1511–1516. doi: 10.1302/0301-620X.94B11.29165. [DOI] [PubMed] [Google Scholar]
- 41.Wolfert MZ, Gilson AM, Dahl JL, Cleary JF. Opioid analgesics for pain control: Wisconsin physicians’ knowledge, beliefs, attitudes, and prescribing practices. Pain Med. 2010;11(3):425–434. doi: 10.1111/j.1526-4637.2009.00761.x. [DOI] [PubMed] [Google Scholar]
- 42.Rodgers J, Cunningham K, Fitzgerald K, Finnerty E. Opioid consumption following outpatient upper extremity surgery. The Journal of hand surgery. 2012;37(4):645–650. doi: 10.1016/j.jhsa.2012.01.035. [DOI] [PubMed] [Google Scholar]
- 43.Cai R, Crane E, Poneleit K, Paulozzi L. Emergency department visits involving nonmedical use of selected prescription drugs in the United States, 2004–2008. Journal of Pain and Palliative Care Pharmacotherapy. 2010;24(3):293–297. doi: 10.3109/15360288.2010.503730. [DOI] [PubMed] [Google Scholar]
- 44.Dart RC, Surratt HL, Cicero TJ, et al. Trends in opioid analgesic abuse and mortality in the United States. N Engl J Med. 2015 Jan 15;372(3):241–248. doi: 10.1056/NEJMsa1406143. [DOI] [PubMed] [Google Scholar]
Associated Data
This section collects any data citations, data availability statements, or supplementary materials included in this article.