

Abstract
The processing of a polyelectrolyte (whose functionality is derived from its ionized functional groups) into a nanofiber may improve its functionality and yield multiple functionalities. However, the electrospinning of nanofibers from polyelectrolytes is imperfect because polyelectrolytes differ considerably from neutral polymers in their rheological properties. In our study, we attempt to solve this problem by applying a voltage of opposite polarity to charges on a polyelectrolyte. The application of this ‘countervoltage’ can temporarily mask or screen a specific rheological property of the polyelectrolyte, making it behave as a neutral polymer. This approach can significantly contribute to the development of new functional nanofiber materials.
Keywords: Electrospinning, Polyelectrolyte, Nanofiber, Chitosan
Introduction
Nanofibers have numerous applications in optoelectronics, sensor technology, catalysis, filtration, medicine and tissue engineering, which require suitable processing techniques. Examples of nanofiber fabrication methods include top-down processes, such as electrospinning [1], centrifugal spinning [2], rotary jet spinning [3] and double spinning [4], as well as bottom-up processes, such as self-assembly [5] and vapor deposition [6]. Electrospinning is considered the most practical method because of its universal applicability to virtually any soluble or fusible polymer [1], high productivity, wide range of fiber diameters (from a few nanometers to several micrometers), simplicity and low production cost. The basic principle of this method is briefly explained next. A high voltage (typically above 10 kV) is applied to a droplet ejected from a thin spinneret, which is similar to a syringe needle (figure 1). When the electrostatic repulsive force overcomes the surface tension on the droplet surface, solution jets are ejected from the tip of the conically deformed droplet toward a grounded collector. The electrostatic repulsive force on the surface of the flying solution jet extends itself into a fiber shape, and the solution solidifies through the evaporation of the solvent. Under suitable conditions, uniform and defect-free nanofibers are deposited on the collector [1].
Figure 1.

Schematic of electrospinning setup.
Important electrospinning parameters include applied voltage, solution concentration and the rheological properties of the polymers used [1]. Dynamic interactions between polymer chains, such as entanglement, hydrophobic interaction and hydrogen bonding, are essential for reducing the fiber diameter to the nanoscale level and maintaining continuous fiber formation. The electrospinning of neutral polymers is less sensitive to the process parameters and is easier to control than that of nanofibers from polyelectrolytes, which have electric charges along a chain (e.g., chitosan). Polyelectrolytes exhibit a weak scaling relationship between zero-shear viscosity and concentration and exhibit greater shear thinning than neutral polymers [7]. These specific rheological properties hinder the electrospinning of polyelectrolytes.
Several attempts have been made to improve the poor electrospinnability of the polyelectrolyte chitosan. One of the most commonly employed approaches is blending chitosan with poly(ethylene glycol) or other substances [8]. However, the chitosan content and hence the properties of the blended fiber are limited unless the added component is removed after deposition. One of the proposed methods for obtaining pure chitosan nanofibers involves the removal of the poly(ethylene oxide) sheath in the core-sheath electrospinning of chitosan with poly(ethylene oxide) [9]. However, the resultant mat was too fragile even for its mechanical properties to be measured. A fluoric solvent, such as trifluoroacetic acid [10, 11] or hexafluoro-2-propanol [12], has been used to prepare pure chitosan fibers; however, the residual solvent limits the environmental friendliness and the use of the obtained fibers as biomaterials. Even though such solvent can be removed completely by post treatments, it is inadvisable to use deleterious components in material processing in consideration of meeting standards for medical use. In one process, low-molecular-weight (LMW) chitosan of approximately 1×10⁵ g mol−1 molar mass was used for the preparation of pure chitosan fibers in an aqueous solution [13]. However, as the physical properties of a fiber strongly depend on the molecular weight of the polymer used, the LMW chitosan is not necessarily suitable for fabrication.
In the light of the above discussion, we conclude that the use of high-molecular-weight chitosan (HMW; >1×10⁶ g mol−1) for the fabrication of single-component nanofibers by electrospinning from an aqueous solution is tremendously difficult. As a new approach to this problem, we herein propose the electrochemical protonation and deprotonation reaction in solution. The application of a voltage of opposite sign to the charges on a polyelectrolyte (e.g. a negative voltage for a cationic polymer) effectively deprotonizes the ionized functional groups on a chain, thereby rendering the polymer temporarily neutral. In this study, we report the simple electrospinning of HMW chitosan (106 g mol−1) and demonstrate that pure chitosan nanofibers can be prepared from an aqueous solution rather than from an organic solution, by introducing electrochemical reactions in chitosan simultaneously with the electrospinning process.
Experimental details
Materials
Chitosan with a viscosity-average molecular weight of 1×10⁶ g mol−1 and a degree of deacetylation of 80–90% was obtained from Dainichiseika Color & Chemicals Manufacturing Co. Ltd, Japan. Reagent-grade acetic acid and a 0.1 N sodium hydroxide aqueous solution were purchased from Wako Pure Chemical Industries Ltd, Japan. A 1% eosin Y solution was purchased from Muto Pure Chemicals Co. Ltd, Japan. All materials were used without further purification.
Electrospinning
Solutions of 3.0, 4.0, 5.0, 6.0, 8.0 and 10.0 mg ml−1 concentrations were prepared for the electrospinning experiment. Chitosan flakes were dissolved in a 90% aqueous solution of acetic acid with gentle stirring at room temperature. Ultrapure water prepared using the Millipore-Q system was used for the preparation of the 90% aqueous solution of acetic acid. To prevent the acetic acid from degrading the chitosan, the solutions were used within 3 days after preparation.
Electrospinning was carried out at room temperature with a simple laboratory-built device. Two types of high-voltage generators (HSP-30K-2 and HSN-30K-2, Nippon Stabilizer Industry Co. Ltd, Japan) were employed; one was used to generate positive voltages and the other to generate negative voltages. The applied voltage was varied from +12 to +20 kV and from −20 to −12 kV, and the humidity was maintained below 30% by nitrogen gas perfusion. The chitosan solution was supplied to a 22-gauge stainless-steel needle (inner diameter: 0.42 mm) at a rate of 0.3 ml h−1 using a syringe pump (780100J, KD Science). The needle was connected to the positive or negative voltage generator for anodic or cathodic electrospinning, respectively. The distance between the tip of the needle and the grounded aluminum foil collector was fixed at 50 mm.
An electrospinning system equipped with a rotating drum collector (NANON, MECC Co, Ltd, Japan) was used to fabricate large nonwoven mats for adsorption testing. The spinning solution contained 8.0 mg ml−1 chitosan in the 90% aqueous solution of acetic acid. The applied voltage was 12.5 kV, the feeding rate was 0.3 ml h−1, the spinning distance was 50 mm and the stainless-steel needle was 22G (22 gauge). The drum collector had a 100 mm diameter and its rotation speed was fixed at 100 rpm. The needle was laterally moved at a speed of 10 mm s−1 over a distance of 50 mm. The total spinning time was 4 h. The grounded drum collector was covered with aluminum foil to collect the deposited fibers.
Scanning electron microscopy
The morphology of the fibers was observed by scanning electron microscopy (SEM, JSM-5600, JEOL, Ltd, Japan). The as-spun fibers were placed overnight in a vacuum desiccator and sputtered with platinum prior to their observation.
Dynamic light scattering measurement
Dynamic light scattering (DLS) was measured with a DLS-6000 instrument (Otsuka Electronics Co, Ltd, Japan) equipped with an argon ion laser (wavelength: 488 nm). The studied sample contained 1.0 mg ml−1 chitosan in the 90% aqueous acetic acid solution; it was used without sonication and filtration within 3 days after preparation. Two high-voltage generators supplied voltages of +16 kV and −16 kV to the solution during the measurement. A platinum electrode was inserted into the cell with the solution so that its tip was 40 mm away from the section exposed to the laser. The measurements were started immediately after the application of the voltage to the solution.
Adsorption test
We examined the adsorption properties of the electrospun nonwoven mat. To neutralize the residual salts of acetic acid in the fibers, the mat with the supporting aluminum foil was immersed in a 0.1 N sodium hydroxide solution. The recovered fiber mat was then rinsed with Milli-Q water several times. Raw chitosan flakes were used as a surface area reference. The collected sheets were placed in a 0.001% eosin Y solution at 25 °C, and the optical absorption of the solution was measured at 518 nm with a Gene Quant 1300 spectrometer (GE Healthcare). The weight of the dye adsorbed onto the nonwoven mat was calculated using a calibration curve of the absorbance versus concentration of the eosin Y solution. After the measurements, the fiber mats were dried in a vacuum oven, and their weights were measured. The measured dry weights were used to standardize the adsorbed dye weights.
Results
Figure 2 shows the results of anodic electrospinning carried out at +16 kV. Particles were predominantly formed when the solution concentration was 3.0 mg ml−1. However, when the concentration was increased to 4.0 mg ml−1, elongated objects (marked by arrows) were observed on the collector. The formation of particles was suppressed and the beaded fibers became more abundant with a further increase in solution concentration; however, both the particles and the fibers were present under all spinning conditions. We could not produce defect-free fibers at any voltage between +12 and +20 kV. Figure 3 shows the products of cathodic electrospinning performed at −16 kV. Similarly to the case of anodic electrospinning, short rods (marked by arrows) were observed on the collector when the solution concentration was increased to 4.0 mg ml−1. They gradually elongated with increasing solution concentration, resulting in defect-free fibers at concentrations of 8.0 mg ml−1 and higher. The average diameters of the fibers were 78 and 77 nm at 8.0 and 10.0 mg ml−1, respectively. The standard deviations (SDs) at these concentrations were 20 nm and 16 nm, respectively. Figure 4 shows the results of cathodic electrospinning from the 8.0 mg ml−1 solution. Defect-free fibers were obtained at voltages of −14 and −16 kV, whereas beaded fibers were formed at lower or higher voltages. The fiber diameter was 73± SD 9 nm at −14 kV. When the solution concentration was increased to 10.0 mg ml−1, defect-free fibers were observed between −16 and −20 kV (figures 4(e) and (f)), and their diameters were 77± SD 16 nm at −16 kV and 75± SD 9 nm at −20 kV. Thus, uniform defect-free nanofibers could be obtained within a certain applied voltage window in the cathodic electrospinning trials, but not in the anodic electrospinning trials. In the anodic experiments, a solution concentration of 8.0 mg ml−1 or higher was required to form continuous nanofibers; however, these nanofibers were always accompanied by particles. In the cathodic experiments, defect-free fibers were spun from the 8.0 mg ml−1 solution at −14 to −16 kV and from the 10.0 mg ml−1 solution at −16 to −20 kV.
Figure 2.

SEM images of electrospinning deposits obtained at anodic voltage of +16 kV. The spinning solutions had chitosan concentrations of (a) 3.0 mg ml−1, (b) 4.0 mg ml−1, (c) 5.0 mg ml−1, (d) 6.0 mg ml−1, (e) 8.0 mg ml−1 and (f) 10.0 mg ml−1. The white arrows indicate fiber-shaped objects. Scale bars correspond to 1 μm.
Figure 3.

SEM images of electrospinning deposits obtained at cathodic voltage of −16 kV. The spinning solutions had chitosan concentrations of (a) 3.0 mg ml−1, (b) 4.0 mg ml−1, (c) 5.0 mg ml−1, (d) 6.0 mg ml−1, (e) 8.0 mg ml−1 and (f) 10.0 mg ml−1. The white arrows indicate fiber-shaped objects. Scale bars correspond to 1 μm.
Figure 4.

SEM images of fibers electrospun from 8.0 mg ml−1 (a–d) and 10.0 mg ml−1 (e, f) solutions at cathodic voltages of (a) −12 kV, (b) −14 kV, (c) −18 kV, (d) −20 kV, (e) −16 kV, and (f) −20 kV. Scale bars correspond to 1 μm.
Solution jets were ejected from the droplet during electrospinning. Under all anodic condition, several jets were sprayed from the tip of the needle (figure 5(a)). In contrast, single jets were ejected from the tip of the conically deformed droplet under certain cathodic conditions. Figure 5(b) shows the Taylor cone or the eruption point of the jet from the droplet. As the extrusion rate of the solution from the needle was increased, the differences between the anodic and cathodic electrospinning processes could be visualized more clearly. Under anodic conditions, the extruded solution was ejected and rapidly consumed as multijets (see Supplementary Data, Video 1 available online at ). In contrast, under cathodic conditions, a gradually growing pendant droplet was observed and a single jet was ejected even when the extrusion rate was equal to that in the anodic process. Eventually, the liquid dripped down from the needle tip (see Supplementary Data, Video 2).
Figure 5.

Photographs of needle tips during electrospinning: (a) multijet ejected from needle tip in anodic electrospinning at +14 kV; (b) single jet ejected from conically deformed droplet at needle tip in cathodic electrospinning at −14 kV. The concentration of the spinning solution was 0.8 mg ml−1. The arrows mark individual jets within the multijet.
DLS measurements were performed on the chitosan solution which was charged positively or negatively via a platinum electrode during each measurement (figure 6(a)). To avoid complicated analysis and interpretation of the processes occurring in semidilute solutions that are normally used in electrospinning, we used a dilute solution of 1.0 mg ml−1 for DLS. The application of positive voltages did not significantly affect the size distribution of the chitosan in the solution (figures 6(b) and 6(c)). The position of the peak around 600 nm remained the same and the shape of the histogram of the size distribution was unaltered. In contrast, the application of negative voltages caused a significant change in the size distribution (figures 6(d) and 6(e)). The intensity of the previously observed peak around 600 nm decreased and the proportion of large particles increased, indicating the growth of polymer aggregates.
Figure 6.

Effect of electric voltage on chitosan aggregation in solution. (a) Experimental setup: the Pt electrode inserted in the solution cell was kept 40 mm away from the section illuminated by the laser. Particle size distributions before (b, c) and after application of (d) +16 kV or (e) −16 kV.
The electrospun nonwoven mats were detached from the aluminum foil collectors for adsorption testing by NaOH treatment. Each collected chitosan nonwoven mat, namely chitosan nanosheet, was approximately 300 mm in length and 100 mm in width, and it was sufficiently strong to be handled with tweezers. Figure 7 shows the adsorption results. A steep initial increase in adsorption rate is observed for the nanosheets with a slope of 9.00×10⁻⁵ mg mg−1 s−1 calculated between 0 and 3 min. The adsorption rate reached a quasi-equilibrium after 4 h and did not significantly change after 24 h. In contrast, the rate of adsorption on chitosan flakes increased much more slowly (initial rate: 5.38×10⁻⁷ mg mg−1 s−1) and did not reach equilibrium even after 24 h.
Figure 7.
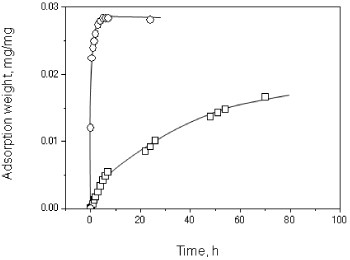
Adsorption time profiles for chitosan nanosheet (○) and chitosan flake (□).
Discussion
Solution parameters governing the electrospinning of continuous fibers have been studied extensively [14, 15]. Interactions between polymer chains, such as entanglement or hydrogen bonding, are essential for fiber formation; these interactions depend on the molecular weight and concentration of the polymer [14, 15]. In a dilute solution, the chains exist as separate entities or coils. With increasing solution concentration, the chains begin to overlap and become in contact with each other; the threshold for these phenomena is called the critical crossover concentration c∗. When the solution concentration exceeds c∗, the regime changes from semidilute unentangled to semidilute entangled, and eventually a situation is reached where individual chains can no longer be discerned. The semidilute entangled regime with a solution concentration exceeding 2.5c∗ is typically required for electrospinning continuous fibers [16]. In our experiments, solution concentrations of 3.0 mg ml−1 or higher were necessary for the formation of continuous fibrous structures under both polarities. The c∗ value of chitosan with a molecular weight of 1.93×10⁵ g mol−1 was previously reported as around 1 mg ml−1 [17]. Generally, in the case of a flexible polymer in a good solvent, c∗ is inversely proportional to the square root of the molecular weight. Therefore, c∗ should be lower than 1 mg ml−1 for the chitosan studied here, and the concentration threshold for the appearance of fibrous structures is approximately 3c∗. This value agrees approximately with the proposed concentration for neutral polymers.
A Taylor cone is typically observed in the conventional anodic electrospinning of neutral polymers. As mentioned above, when the electrostatic repulsive force generated on the solution surface exceeds the surface tension of the solution, a charged solution jet is ejected from the droplet. Then, under certain conditions, the droplet deforms into a Taylor cone. However, if the electrostatic repulsive force greatly exceeds the surface tension, a multijet is ejected from the needle tip. From this observation, we surmise that the application of positive or negative voltages may have completely different effects on the rheological properties of the solution. We explain the differences observed between the jet flows from the needle for the anodic and cathodic electrospinning processes as follows. The positively charged solution was deprived of viscoelasticity or could not withstand the electrostatic repulsive force on the solution surface. As a result, the solution was ejected, generating a multijet spray. In contrast, the negatively charged solution was aided by viscoelasticity or not deprived of the ability to withstand the electrostatic repulsive force, and consequently, the droplet deformed into a Taylor cone.
To interpret this phenomenon, we should consider the electrochemical properties of chitosan. Chitosan can be considered a base as it possesses primary amino groups with a pKa value of 6.3. At pH values lower than 6.3, the amino groups are protonated, thereby making chitosan highly soluble in aqueous solutions [18]. At pH values higher than 6.3, a reduction in the number of deprotonated amino groups renders chitosan insoluble in aqueous solutions. Using this sensitivity to pH, chitosan can be deposited onto a cathode surface even from an acidic solution in response to an applied voltage [19–21]. A pH gradient is generated in the chitosan solution (spreading concentrically from the cathode surface) when a voltage is applied to the electrodes. Chitosan becomes insoluble and forms a hydrogel on the cathode surface when it is attracted to the surface and then crosses a certain threshold of pH in the solution. In previous studies, the voltage applied during the electrodeposition of chitosan was limited to 0.5–2.5 volts [19–21]. Our results suggest the following model. If a cathodic voltage of more than 10 kV is applied to a chitosan solution, an insolubilization effect is immediately achieved both around the cathode surface and throughout the solution. The in situ deprotonation of the dissolving chitosan in the acidic solution (i.e. neutralization) probably makes chitosan act like a neutral polymer. Consequently, the electrostatic repulsion between the chains is suppressed and the hydrophobic interaction emerges instead. Chitosan is well known for its tendency to aggregate, although the exact mechanism of this phenomenon is still under debate [17]. It is speculated that the electrostatic repulsion between the protonated amino groups on the chitosan chains restrains positive interactions. Furthermore, the neutralization of these protonated amino groups may facilitate aggregation.
The effect of negative voltages on an isolated chain of a polycation molecule in an extremely dilute solution is probably similar to the effect of salt addition to the solution. The gyration radius of the chain might decrease due to the screening effect on electrostatic repulsion along the chain. As a result of the voltage application, the viscosity of the solution including such isolated chains is expected to decrease slightly. However, in the semidilute entangled regime, the hydrophobic interaction due to the screening effect on the electrostatic repulsion probably increases the number of interaction points between the chains in the solution (figure 8(c)). Hydrophobic interaction points probably act as entanglement points in the polymer solution. The formation of a polymer network increases the solution viscoelasticity, thereby restraining a multijet from being ejected at the needle tip. Furthermore, the formation of this polymer network appears to support the hypothesis that the application of positive voltages facilitates protonation and enhances electrostatic repulsion (figure 8(d)). The fluidity of the solution increases with increasing degree of intermolecular electrostatic repulsion in the polymer solution. An excess of fluidity contributes to the ejection of a multijet.
Figure 8.

Schematic of chitosan chains in solution: chemical structure of (a) individual chain; several chains at (b) zero, (c) negative, and (d) positive voltages applied to the solution.
The DLS results obtained at positive applied voltages and the multijet ejection in anodic electrospinning also appear to support our hypothesis. We speculate that the high degree of electrostatic repulsion between the chains prevented the formation of a continuous jet and led to the deposition of beaded fibers or particles [8]. In other words, our model can explain the formation of defective fibers in anodic electrospinning. DLS measurements also showed that the application of negative voltages reduced the intensity of the size-distribution peak at 600 nm and increased the number of larger particles. This result indicates that the negative voltages facilitated the aggregation of chitosan in the solution, in agreement with our hypothesis that the application of negative voltages neutralizes a cationic polyelectrolyte in solution.
The degree of chain overlap in a solution is an important factor that determines the resultant product of electrospinning. This degree can be expressed in terms of the Berry number Be, which is defined as the dimensionless product of the intrinsic viscosity [η] and the concentration c [22]:
In previous studies on the anodic electrospinning of LMW chitosan using 90% acetic acid as a solvent (conditions similar to those used in our study), the Berry number was estimated as 23 [13] and 15–21 [23], and a continuous fiber could be formed by electrospinning under those conditions. The intrinsic viscosity of the solution was obtained using the Mark–Houwink–Sakurada equation
where K=0.0893 cm3 g−1 and α=0.71 [24]. Upon examining a number of spinning trails in our study, we found that a solution concentration higher than 8.0 mg ml−1 was required to fabricate defect-free nanofibers by cathodic electrospinning. In this study, a concentration of 8.0 mg ml−1 was equivalent to a Berry number of 13, which is smaller than those obtained previously [13, 23]. As shown in figure 2, beaded fibers were fabricated by anodic electrospinning, which was also used in previous studies [13, 23]. This result of the anodic electrospinning can be interpreted as insufficient chain overlap in the solution, showing the relatively low Berry number. However, uniform defect-free nanofibers were obtained by cathodic electrospinning (figures 3(e) and (f) and 4(b), (e), and (f)). An examination of the electrospinning process from the viewpoint of the Berry number implies that cathodic electrospinning enhanced the positive interaction between chitosan chains as compared with anodic deposition.
The effect of the solution conditions on the development of various morphologies, such as particles, beaded fibers, and uniform fibers can be attributed to the changes in the degree of overlap between polymer chains in the solution [15]. The entanglement number ne, which reflects the number of polymer entanglements per chain, can be used to predict the resulting morphologies [15]; it can be estimated as
Here, ϕ, Mw and Me denote the polymer volume fraction, the molecular weight of the polymer in the solution and the entanglement molecular weight which corresponds to the average molecular weight between entanglement junctions, respectively. Generally, increasing ne improves the electrospinnability of a solution, which should result in the formation of uniform defect-free fibers instead of particles or beaded fibers. As shown in figure 6, the DLS results clearly imply that a negative voltage enhanced the attractive interaction between chitosan chains in solution, that is,
Here, neN and neP are the entanglement numbers in the negatively and positively charged solutions, respectively. Even without calculating these numbers, we can infer from SEM images that the above inequality holds for our experiment. Thus, our observations suggest that the number of interaction points acting like entangled points between chains is larger in the negatively charged solution than in the positively charged solution, and this conclusion is supported by the DLS results. In other words, a high negative voltage can deprotonate a protonating polycation in solution, making chitosan behave as a neutral polymer and facilitating the electrospinning of polycation solutions.
The fibers fabricated in this study are generally thinner and more uniform than those obtained previously (e.g. 130 nm in [13] and 70±45 nm in [23]). Although we cannot compare them, due to different electrospinning conditions, an attainable minimum diameter by our method is probably smaller. Owing to the large extensibility of the polymer chains, a lesser number of chains per unit volume of a solution should result in thinner fibers [15]. Thus, the formation of thin defect-free nanofibers in this study can be attributed to the HMW of chitosan (1×10⁶ g mol−1).
The adsorption rate of the chitosan nanosheet was much higher than that of the chitosan flakes. That is, upon processing the flakes into nanosheets, the adsorption rate of the raw material was increased by more than hundred times owing to the large specific surface of nanomaterials. Furthermore, we believe that the as-spun nanofiber has a low crystallinity and large amorphous regions, in which the amino groups along a chitosan chain can work as adsorption sites for the anionic dye, eosin Y. In other words, the as-spun nanofibers may have a larger equilibrium adsorption weight than the raw flakes. More experimental results and discussion on the number of adsorption sites and the equilibrium adsorption weight of the electrospun nanofibers are required to verify this model. Nevertheless, it is clear that processing materials into nanofibers can strongly enhance their adsorption properties.
Conclusions
In conventional electrospinning, an electric voltage is primarily used to extract a jet from a solution droplet and extend it into a thin fiber; positive voltages have been used in most reports. Although cathodic electrospinning has been reported and discussed in several studies [25–28], no mention of its advantage over anodic electrospinning has been made. In this work, we demonstrated the effectiveness of cathodic electrospinning and the importance of voltage polarity in the electrospinning process. The electric voltage affects the electrochemical properties of polyelectrolyte polymers via protonation or deprotonation effect, altering the rheological properties of the polyelectrolyte polymer solutions. As a result, an appropriate polarity can greatly facilitate the electrospinning of polyelectrolytes, which was previously considered impossible. The concept developed here is not limited to the electrospinning of chitosan but can be extended to other polyelectrolytes and nanofabrication methods.
Acknowledgments
We thank Dainichiseika Color & Chemicals Manufacturing Co, Ltd, for providing the materials used in this study and the Nanotechnology Innovation Center of the National Institute for Materials Science (NIMS) for cooperation in performing the DLS experiments. We gratefully acknowledge the financial support provided by Grants-in-Aid for Scientific Research (B) from the Ministry of Education, Culture, Sports, Science and Technology (MEXT), Challenging Exploratory Research of the Japan Society for the Promotion of Science (JSPS), Management Expenses Grants of NIMS and Core Research of Evolutional Science & Technology (CREST) under the aegis of the Japan Science and Technology Agency (JST).
References
- Greiner A. and Wendorff J H. Angew. Chem. Int. Ed. 2007;46:5670. doi: 10.1002/(ISSN)1521-3773. [DOI] [PubMed] [Google Scholar]
- Weitz R T, Harnau L, Rauschenbach S, Burghard M. and Kern K. Nano Lett. 2008;8:1187. doi: 10.1021/nl080124q. [DOI] [PubMed] [Google Scholar]
- Badrossamay R M, Mcllwee A H, Goss A J, Kevin K. and Parker K K. Nano Lett. 2010;10:2257. doi: 10.1021/nl101355x. [DOI] [PMC free article] [PubMed] [Google Scholar]
- Li M, Long Y Z, Yang D, Sun J, Yin H, Zhao Z, Kong W, Jiang X. and Fan Z. J. Mater. Chem. 2011;21:13159. doi: 10.1039/c1jm12240a. [DOI] [Google Scholar]
- Shimizu T. Polym. J. 2003;35:1. doi: 10.1295/polymj.35.1. [DOI] [Google Scholar]
- Teo K B K, et al. Nano Lett. 2004;4:921. doi: 10.1021/nl049629g. [DOI] [Google Scholar]
- McKee M G, Hunley M T, Laymann J M. and Long T. Macromolecules. 2006;39:575. doi: 10.1021/ma051786u. [DOI] [Google Scholar]
- Klossner R R, Queen H A, Coughlin A J. and Krause W E. Biomacromolecules. 2008;9:2947. doi: 10.1021/bm800738u. [DOI] [PubMed] [Google Scholar]
- Ojha S S, Stevens R D, Hoffman J T, Stano K, Klossner R, Scott C M, Krause W, Clarke I L. and Gorga E R. Biomacromolecules. 2008;9:2523. doi: 10.1021/bm800551q. [DOI] [PubMed] [Google Scholar]
- Ohkawa K, Cha D, Kim H, Nishida A. and Yamamoto H. Macromol. Rapid Commun. 2004;25:1600. doi: 10.1002/(ISSN)1521-3927. [DOI] [Google Scholar]
- Ohkawa K, Minato K, Kumagai G, Hayashi S. and Yamamoto H. Biomacromolecules. 2006;7:3291. doi: 10.1021/bm0604395. [DOI] [PubMed] [Google Scholar]
- Min B M, Lee W S, Lim N J, You Y, Lee S T, Kang H P. and Park H W. Polymer. 2004;45:7137. doi: 10.1016/j.polymer.2004.08.048. [DOI] [Google Scholar]
- Geng X, Kwon O H. and Jang J. Biomaterials. 2005;26:5427. doi: 10.1016/j.biomaterials.2005.01.066. [DOI] [PubMed] [Google Scholar]
- Gupta P, Elkins C, Long T E. and Wilkes G L. Polymer. 2005;46:4799. doi: 10.1016/j.polymer.2005.04.021. [DOI] [Google Scholar]
- Shenoy S L, Bates W D, Frisch H L. and Wnek G E. Polymer. 2005;46:3372. doi: 10.1016/j.polymer.2005.03.011. [DOI] [Google Scholar]
- Mckee M, Wilkes G L, Colby R H. and Long T E. Macromolecules. 2004;37:1760. doi: 10.1021/ma035689h. [DOI] [Google Scholar]
- Desbrieres J. Biomacromolecules. 2002;3:342. doi: 10.1021/bm010151+. [DOI] [PubMed] [Google Scholar]
- Pillai C K S, Paul W. and Sharma C P. Prog. Polym. Sci. 2009;34:641. doi: 10.1016/j.progpolymsci.2009.04.001. [DOI] [Google Scholar]
- Wu L Q, Gadre P A, Yi H, Kastantin J M, Rubloff W G, Bentley E W, Payne F G. and Ghodssi R. Langmuir. 2002;18:8620. doi: 10.1021/la020381p. [DOI] [Google Scholar]
- Wu L Q, Yi H, Li S, Rubloff W G, Bentley E W, Ghodssi R. and Payne F G. Langmuir. 2003;19:519. doi: 10.1021/la026518t. [DOI] [Google Scholar]
- Fernandes R, Wu L Q, Chen T, Yi H, Rubloff W G, Ghodssi R, Bentley E W. and Payne F G. Langmuir. 2003;19:4058. doi: 10.1021/la027052h. [DOI] [Google Scholar]
- Hager B L. and Berry G C. J. Polym. Sci. Polym. Phys. 1982;20:911. [Google Scholar]
- Vrieze S D, Westbroek P, Camp T V. and Langenhove L V. J. Mater. Sci. 2007;42:8029. doi: 10.1007/s10853-006-1485-6. [DOI] [Google Scholar]
- Lee V F. PhD dissertation University of Washington, University Microfilm (Ann Arbor, MI, USA) 74–29 446 1974 [Google Scholar]
- Supaphol P, Mit-uppatham C. and Nithitanakul M. Macromol. Mater. Eng. 2005;290:933. doi: 10.1002/(ISSN)1439-2054. [DOI] [Google Scholar]
- Varesano A, Carletto R A. and Mazzuchetti G J. Mater. Process Technol. 2009;209:5178. doi: 10.1016/j.jmatprotec.2009.03.003. [DOI] [Google Scholar]
- Kilic A, Oruc F. and Demir A. Textile Res. J. 2009;78:532. doi: 10.1177/0040517507081296. [DOI] [Google Scholar]
- Tong H W. and Wang M. Biomed. Mater. 2010;5:054110. doi: 10.1088/1748-6041/5/5/054110. [DOI] [PubMed] [Google Scholar]