

Abstract
Among the well-studied polypeptide-type gene carriers, transfection efficiency is empirically known to be higher for poly(L-arginine) (PR) than poly(L-lysine) (PK). The big difference between PR and PK should be determined at one of the intracellular trafficking steps based on the different charge densities, structures or PKa values. However, the endosomal escape and the intranuclear transcription efficiency in living cells have not been clarified yet. In this study, a novel method for quantifying the intranuclear transcription efficiency and the nuclear transport of the polyplex is established based on the nuclear and the cytosolic microinjection technique, and the results for PK and PR with different molecular weights (MWs) are compared in living cells. The intranuclear transcription efficiency is the same in PR and PK and it decreases rapidly with increasing MW, in spite of the commonly measured transfection efficiency. The transcription efficiency is strongly suppressed at high MW and strongly correlates with the polyplex forming ability expressed as a critical ratio of the number of polypeptide cationic groups to the number of pDNA anionic groups. When considered with the results of the cellular uptake and in vitro transfection with or without chloroquine, the rate-limiting step for their gene transfer is the buffering effect-independent endosomal escape.
Keywords: Poly(L-lysine), Poly(L-arginine), Microinjection, Transcription efficiency, Endosomal escape
Introduction
Polypeptide-type gene carriers have been well studied in nonviral gene delivery systems since they are degradable in vivo and possess various physicochemical and biological functions depending on their sequences [1–3]. Poly(L-lysine) (PK) and poly(L-arginine) (PR) are the most widely studied carriers. Arginine and lysine are the main components of histone proteins and their ability to fold genomic DNA is well known. Various physicochemical and biological differences based on their different side chains have been reported to affect their affinity for nucleic acids and the resultant polyplex structures [4,5]. The transfection efficiency of PR is higher than that of PK [6,7], and whether this disparity is due to the difference in their affinities or polyplex structures remains to be elucidated.
Intracellular trafficking steps in nonviral gene delivery have been gradually elucidated because the molecular design of polymeric carriers requires knowledge of the intracellular rate-limiting steps encountered by the polyplex [8–10]. In general, the polyplex-mediated transfection efficiency comprises the following four continuous steps: cellular uptake (step I), endosomal escape (step II), nuclear transport (step III) and transcription (step IV). Banks et al reported that mathematical modeling coordinated with experimental studies could provide detailed and quantitative understanding of nonviral gene delivery [9, 11]. They used a compartment model, and the rate-limiting step of gene transfer was identified to be the transport of pDNA from the cytosol to the nucleus (step III). Other groups have indicated that the rate-limiting step of polymeric gene delivery is endosomal escape (step II) [12, 13]. The buffering capacities of polymeric gene carriers provide an index of endosomal escape. Although microscopic observations of endosomal escape of fluorescence-labeled polyplexes in living cells have been well reported using pH-responsive fluorescent molecules or endosome marker probes [14, 15], quantitative and direct evaluations are difficult.
Recently, numerous studies have focused on the transcription of the transgene in the nucleus (step IV). Polyplexes of polymeric gene carriers and pDNA have to be recognized and transcribed after entering the nuclei. It has been reported that polymeric carriers inhibit transcription, and the extent of pDNA condensation may be a major factor determining the transcription efficiency [16]. Since polyplexes are not well transcribed in a cell-free system using reticulocyte lysates due to their strong compaction, it is difficult to quantitatively estimate their transcription efficiencies in living cells. The molecular weight (MW) of polymeric carriers is an important factor determining the gene transfection efficiency [17–23]. In general, polyplexes composed of pDNA and low MW polycations are easily disassembled in an aqueous solution [24]. For example, complexes of PK of 19 and 36 residues were reported to detach from DNA more rapidly than PK complexes of 180 residues in a cell-free system. Thus, it was concluded that this difference in polyplex disassembly led to larger difference in short-term gene expression. However, MW of the polycations may affect the other steps, including cellular uptake (step I) and nuclear transport (step IV); thus, the efficiency at each step should be analyzed separately to obtain detailed information with regard to the overall process.
The purpose of this study was to quantitatively clarify PR- and PK-based gene transfer with regard to the following four steps: cellular uptake (step I), endosomal escape (step II), nuclear transport (step III) and transcription (step IV) in living cells using nuclear and cytosolic microinjections.
Materials and methods
Chemicals
PK and PR were purchased from Sigma Chemicals (Missouri, USA). The other organic solvents and reagents were purchased from Wako Chemicals, Inc (Osaka, Japan).
Cell lines and genes
COS-1 cells (SV40-transformed African green monkey kidney fibroblast cells, RIKEN Cell Bank) were grown in Dulbecco's modified Eagle's medium (DMEM) without phenol red (Sigma Chemicals) but supplemented with 10% fetal bovine serum (FBS, Sigma Chemicals), 25 IU ml-1 of benzylpenicillin potassium (Sigma Chemicals) and 0.025 mg ml-1 of streptomycin sulfate (Wako).
Three reporter genes, pDNA, pCMV-Luc (a kind gift from Dr Niidome, Kyusyu University) and pEGFP-N1, were amplified to sufficient quantities by standard molecular biology techniques in JM109 and purified with the QIAGEN-tip 500 kit (Qiagen KK, Tokyo, Japan). Finally, pDNAs were dissolved in a Tris-EDTA solution (EDTA=ethylenediaminetetraacetic acid). The concentration and purity of pDNA solutions were measured using a UV1600 spectrophotometer (Shimadzu Corporation, Kyoto, Japan). Cy3 labeling of pCMV-Luc was performed using the LabelIT Cy3 Labeling Kit according to the manufacturer's protocol (Mirus Bio LLC, Wisconsin, US) and the number of Cy3-labeled cells was determined using the UV spectrophotometer.
Gel permeation chromatography measurements
MWs of PK and PR were measured by gel permeation chromatography (GPC; Shimadzu Corporation, Kyoto, Japan); the chromatograph was fitted with the TSK gel G6000PWXL (21.5 mm inner diameter × 300 mm length, Tosoh Corporation, Tokyo, Japan) and TSK gel G3000PWXL columns, and an SPD-M10A UV–vis detector (220 nm detection wavelength). Elution was performed with 0.1% TFA/45% acetonitrile at a rate of 0.3 ml min-1. Polyethylene glycol standards with MWs ranging from 24 000 to 51 0000 were used for calibration.
Polyplex formation
Polypeptide solutions were mixed with pCMV-Luc solutions at a given charge ratio, a specific ratio of the number of polypeptide cationic groups to the number of pDNA anionic groups (C/A ratio). The solutions were incubated for 30 min at 37 °C to facilitate polyplex formation and separated using a 0.8% (w/v) agarose gel in Tris-borate EDTA buffer at 100 V for 30 min. pCMV-Luc was visualized by staining with 0.5 μg ml-1 ethidium bromide (EtBr; Sigma Chemicals).
In vitro transfection
COS-1 cells were seeded in 96-well culture plates at a density of 1×10⁴ in 100 μl of DMEM containing 10% FBS per well. After 24 h of incubation, the cells were washed with phosphate buffered saline (PBS). Polyplexes formed using pCMV-Luc were added to the cells, and the mixture was incubated for 5 h without FBS. After incubation, the supernatants were removed, and the cells were washed with PBS. Fresh medium containing 10% FBS was then added. After 43 h of incubation, the cells were washed with PBS and treated with a lysis (Promega, Wisconsin, USA). Luciferase expression was expressed as light count per second and measured using an ARVO plate reader (PerkinElmer Life and Analytical Sciences, Massachusetts, USA). The protein concentration was determined using the DC Protein Assay kit (Bio-Rad Laboratories, California, USA) with bovine serum albumin as a standard. The measured value of luciferase activity was divided by the total protein content of the cell lysates.
Cellular uptake
COS-1 cells were seeded in 96-well culture plates at a density of 1×10⁴ in 100 μl−1 of DMEM containing 10% FBS per well. After 24 h of incubation, the cells were washed with 1× PBS. Polyplex solutions containing YOYO-1 iodide (Invitrogen Corporation, California, USA) were added to the cells and the mixture was incubated for 5 h. After incubation, supernatants were removed, and the cells were washed with PBS and treated with lysis buffer. YOYO-1 intensity in the lysate solutions was measured using an ARVO plate reader at an excitation wavelength of 485 nm and an emission filter of 535 nm. The measured value of YOYO-1 intensity was divided by the number of cells, which was calculated from the total protein amount measured with the DC Protein Assay kit.
Microinjection
COS-1 cells were seeded in collagen-coated glass-bottom culture plates (MatTek Corporation, Massachusetts, USA) at a density of 8×10⁴ in 2 ml-1 DMEM containing 10% FBS per well. After 24 h of incubation at 37 °C to allow adhesion, the cells were washed with 1× PBS. Polyplexes were formed between the polypeptides and pDNA mixtures (pEGFP-N1 and Cy3-pCMV-Luc, 1:9) at a C/A ratio of 1.5. The polyplex solutions were then back-loaded on a glass capillary and microinjected into the cytosol or nucleus of living cells using a microinjector fitted with a joystick micromanipulator (Narishige, Tokyo, Japan). After injection, the cells were incubated for 24 h at 37 °C in a 5% humidified CO2 environment.
Microinjected Cy3-pCMV-Luc and green fluorescent protein (GFP) expressed in the cells were observed using a Nikon Eclipse TE300 inverted fluorescence-microscope (Nikon Instech Co. Ltd, Tokyo, Japan). Images of fluorescence in cells were captured using a cooled monochrome digital CCD camera (Media Cybernetics, Inc, Maryland, USA). Fluorescence images were taken using two filter sets of EX 450/90, DM505, BA520 and EX510/60, DM575, BA590 for excitation, dichroic mirror and barrier filters. Images were modified using the computer software Image-Pro Plus (ver.5, NIPPON ROPER, Co, Ltd, Tokyo, Japan). GFP and Cy3 intensities were obtained from the images. Quantitative analysis was performed using the obtained images and background subtraction.
The Cy3 intensity was converted to the amount of injected pDNA (pDNA in pg) using linear calibration curves of Cy3-pCMV-Luc solutions ranging from 0.02 to 0.8 mg ml-1. Cy3 labeled pCMV-Luc/pEGFP-N1 (9:1) solutions (0.5 μl-1) ranging from 0 to 0.8 mg ml-1 were also dropped on coverslips. The drop area (A) was then photographed using a digital camera and measured. Fluorescence images of the coverslips were photographed using a fluorescence microscope and a similar procedure to that described for microinjected cells.
Results
MW of the polypeptides
The abbreviations and MWs of the polypeptides are listed in table 1. All polypeptides had narrow MW ranges from 1.1 to 1.8. The degree of polymerization (DP) was calculated from the measured MW. Carrier names are expressed as the combination of the abbreviation (PK or PR) and DP of the polypeptides. For example, PK20 indicates PK with a DP of 20.
Table 1.
Parameters of the used poly(L-lysine) and poly(L-arginine). Mw and Mn are weight average and number average Mws, respectively.
| Poly(L-lysine) | Poly(L-arginine) | ||||||||
|---|---|---|---|---|---|---|---|---|---|
| Carrier | DP | Mwa | Mw/Mna | Carrier | DP | Mwa | Mw/Mna | ||
| PK20 | 20 | 3.4×10³ | 1.1 | PR60 | 60 | 1.3×10⁴ | 1.2 | ||
| PK70 | 70 | 1.4×10⁴ | 1.2 | PR180 | 180 | 3.5×10⁴ | 1.3 | ||
| PK270 | 270 | 5.7×10⁴ | 1.8 | PR730 | 730 | 1.4×10⁵ | 1.3 | ||
| PK520 | 520 | 1.1×10⁵ | 1.5 | ||||||
| PK1350 | 1350 | 2.8×10³ | 1.1 | ||||||
aDetermined by GPC (0.1%TFA/45%AN).
Polyplex formation
Figure 1 shows EtBr-stained agarose gel electrophoresis of polyplexes of pDNA and PKs at various C/A ratios. Bands of free pDNA disappeared at increased C/A ratios. The C/A ratio at which all pDNAs formed a polyplex with the polypeptide was defined as the critical C/A (cC/A) ratio. The cC/A ratios for PK20 and PK70 were 12 and 1.5, respectively, suggesting that PKs with higher MWs had a better polyplex-forming ability (lower cC/A). The same tendency was observed for PR. The cC/A ratios of PK270, PK520, PK1350, PR60, PR180 and PR730 were 0.75, 0.75, 0.75, 3, 1.5 and 1.5, respectively (data not shown).
Figure 1.
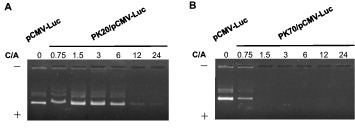
Ethidium bromide (EtBr) stained agarose gel (0.8% w/w) electrophoresis for polyplexes of PK20 (A) or PK70 (B) at various C/A ratios.
In vitro transgene expression
Luciferase activity was measured using a luciferase protein-coded pDNA, pCMV-Luc without chloroquine, throughout gene expression process (figure 2). Transgene expression in the absence of chloroquine was determined at each of the four steps (figure 3), namely cellular uptake (step I), endosomal escape (step II), nuclear transport (step III) and transcription (step IV). Figure 2(a) reveals that PK270 showed higher luciferase expression than the other PKs. In addition, PR180 and PR730 had higher luciferase expression than PR60 (figure 2(b)). The luciferase activity of the PR polyplexes was 1000-fold higher than that of the PK polyplexes at all C/A ratios.
Figure 2.
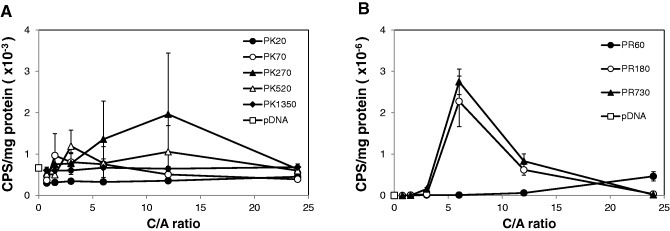
Luciferase activity of transfected COS-1 cells (efficiency of I, II, III and IV steps). Conventional in vitro Luc-gene transfection assay for COS-1 cells using PK (A) or PR (B) polyplexes at various C/A ratios in the absence of chloroquine. The results are presented as mean ± standard deviation of triplicates.
Figure 3.
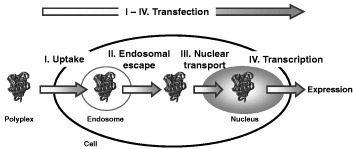
Proposed four intracellular trafficking steps: cellular uptake (I), endosomal escape (II), nuclear transport (III), and transcription (IV).
Cellular uptake
Internalization of positively charged polyplexes at the cell surface via an electrostatic interaction with anionic substances on the cell surface (such as sialic acid and proteoglycan) is an important step in effective gene transfer. Figure 4 shows the cellular uptake of YOYO-1-labeled pDNA delivered by PK and PR at C/A ratios ranging from 0.75 to 24. YOYO-1 is known to intercalate into double-stranded nucleic acids. The uptake of YOYO-1-labeled pCMV-Luc was used as a control. COS-1 cells were treated with lysate, and YOYO-1 intensity (485/535 nm) and the amount of cellular protein were measured. Ratios of YOYO-1 intensity to the amount of protein (mg) indicate uptake. In all the polyplexes, the highest uptakes were obtained at C/A ratios of 3 and 6. Cellular uptake increased and reached a plateau with increasing MWs of both PK and PR. The uptake of PR polyplexes was slightly higher than that of PK polyplexes.
Figure 4.
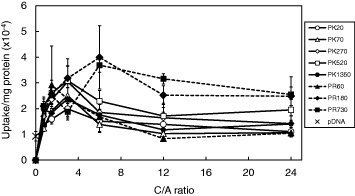
Cellular uptakes of YOYO-1 labeled pCMV-Luc (efficiency of step I) in COS-1 cells by use of PK or PR as carriers. The results are presented as mean ± standard deviation of triplicates.
Quantification of transcription efficiency
Results of microinjection of polyplexes into the cytosol of living cells indicate the efficiency of nuclear transport (step III) and transcription (step IV), whereas those of microinjection of the polyplexes into the nucleus indicate the efficiency of transcription (step IV). Mixtures of Cy3-labeled pCMV-Luc and pEGFP-N1 were microinjected into the cells. After 24 h of incubation, the fluorescence intensity of each fluorescent molecule in a single cell was measured. Cy3 intensity indicates the amount of pDNA (pg) per cell and GFP intensity indicates expression of the injected pDNA. The amount of pDNA (pg) was calculated from the linear calibration of Cy3 intensity versus the amount of pDNA (pg) in Cy3-labeled pDNA solutions (figure 5(b)). The transcription efficiency was defined as the ratio of GFP intensity to the amount of pDNA (pg).
Figure 5.
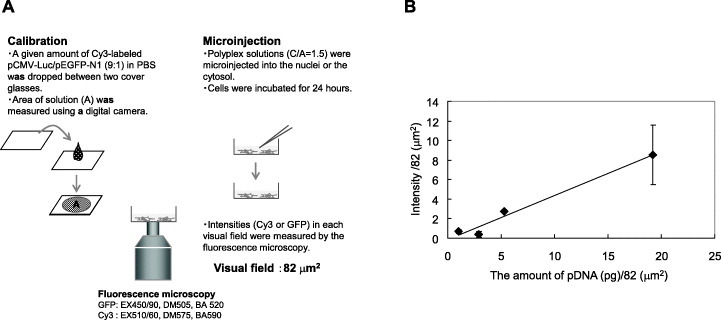
(A) Quantification system of microinjected pDNA in COS-1 cells. (B) Linear calibration of Cy3 intensity versus the amount of pDNA.
Quantitative GFP expression per pg of pDNA after nuclear or cytosolic microinjection of polyplexes is plotted in figure 6. GFP expression after nuclear or cytosolic microinjection of PK and PR polyplexes are on the same line, even though PK and PR have different side chains.
Figure 6.
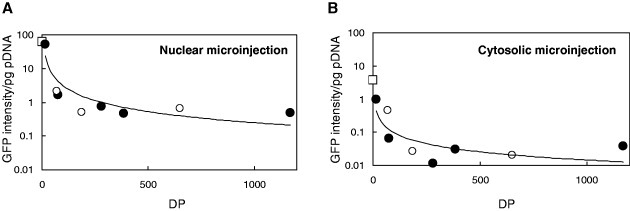
Quantification of GFP expression in COS-1 cells (GFP expressions per pg pDNA) 24 h after microinjection of (•) PK or (∘) PR-polyplexes at C/A=1.5 into the nucleus (A) or the cytosol (B). (□) represents the results for free pDNA.
6(a), which indicates transcription (step IV), free pDNA and PK20 showed a transcription efficiency of approximately 50 GFP pg-1 of pDNA. The reason that PK20 showed a similar transcription efficiency to free pDNA is its low ability to form polyplexes (figure 1(a)). The transcription efficiency in the nucleus for both PK and PR polyplexes decreased with increasing MWs of the polypeptides.
When polyplexes were microinjected into the cytosol, GFP expression efficiency could be determined at two points: nuclear transport (step III) and transcription (step IV) (figure 6(b)). Free pDNA showed GFP expression of 3.6 GFP pg-1 of pDNA. The dependence of GFP expression after cytosolic microinjection on MW was very similar to that observed after nuclear microinjection.
GFP expression of free pDNA after nuclear microinjection (61.2 GFP pg-1 of pDNA) was 17-fold higher than that after cytosolic microinjection (3.6 GFP pg-1 of pDNA). When the polyplexes were microinjected, the expression ratios after nuclear/cytosolic microinjections were similar or larger than this value. This difference in GFP expression/pg of pDNA reveals the efficiency of nuclear transport (step III).
The relationship between the cC/A ratios of the polypeptides and transcription efficiency is shown in figure 7.
Figure 7.
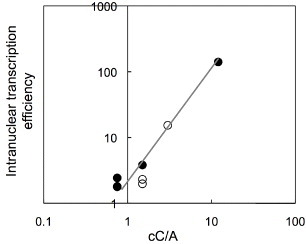
The relationship between the intracellular transcription efficiency (GFP intensity/Cy3 intensity) and the polyplex-forming ability expressed critical C/A (cC/A) ratios of polypeptides. (•) PK or (∘) PR-polyplexes were microinjected into the nucleus of COS-1 cells.
Discussion
The polyplex-mediated transfection efficiency can be described at the following four continuous steps of gene transfection: cellular uptake (step I), endosomal escape (step II) nuclear transport (step III), and transcription (step IV) (figure 3).
When cells were transfected in the absence of chloroquine, the transfection efficiency was determined by all four steps, and that of PR was much higher than that of PK at all MWs (figure 2). The unequal transfection efficiencies may result from the large differences in the efficiencies of PR and PK at each intracellular step due to dissimilar charge densities, structures and pKa values [25]. Differences in PK and PR polyplex structures have previously been revealed by circular dichroism spectroscopy [5], but the reason for the disparity in their transfection efficiencies remains unclear.
To address this uncertainty, we first quantitatively evaluated the cellular uptake (step I) of PK and PR polyplexes using YOYO-1-labeled pDNA. The cellular uptake of PR and PK polyplexes reached a plateau with increasing MWs (figure 4). Furthermore, the cellular uptake of PR was slightly more efficient than that of PK but the difference was not significant. Since positively charged complexes interact with the cell surface through an electrostatic interaction with anionic substances on the cell surface, internalization events are affected by the zeta-potential of the polyplexes. It has been reported that polyplexes composed of polycations with MWs of several thousands exhibit high zeta-potentials [13, 26–30], irrespective of the polycations used. PK and PR are known to form polyplexes with pDNA in a different manner [31]. The equilibrium binding constant between the polypeptide and pDNA is related to the polyplex formation ability of the polypeptide [32]. Fromm et al reported that arginine peptides bound more tightly to GAGs than lysine peptides due to the difference in their side chains [33]. They suggested that the strong affinity of the guanidino cation for sulfate is in accord with the more negative ΔH of the interaction of arginine with GAGs due to high hydrogen binding or soft acid-soft base arguments. Thus, it is possible that slightly more PR polyplexes are incorporated into cells than PK polyplexes (step I).
We next quantified transgene (GFP) expression after nuclear or cytosolic microinjection of pDNA. In a previous study, Zauner et al reported that when pDNA was injected into the nucleus and cytosol, 90 and 6.5% of cells, respectively, expressed the transgene [34]. They determined the transcription efficiency of the β-gal gene using the ratio of the number of cells expressing the transgene to the number of injected cells. However, quantitative investigation is required to evaluate intracellular events. In this study, we quantitatively evaluated the transcription efficiency of the transgene. Free pDNAs injected into the nucleus had a 17-fold higher transcription rate than free pDNA injected into the cytosol. These differences in the efficiencies between nuclear and cytosolic microinjection reveal the efficiency of free pDNA transport (step III).
In the case of polyplexes, the transcription efficiencies after nuclear microinjection showed a decreased propensity compared with that after cytosolic microinjection (figure 6). Pollard et al reported that polymeric carriers did not prevent intranuclear transcription like liposomes; however, they only used polycations with a MW of 25 000 [35]. In this study, the transcription efficiency of PK and PR decreased gradually as MWs increased (figure 6). This decrease in the transcription efficiency may be caused by the strong compaction of polyplexes. A strong compaction of polyplexes (40–60% fluorescence quenching of EtBr emission compared with free pDNA, data not shown) is expected to inhibit recognition by transcription factors. As MW of the polypeptides increases, interactions between pDNA and the polypeptide are increased. Mascotti and Lohman calculated the equilibrium binding constant between various lengths of oligolysine and pDNA by measuring the thermodynamic extent of counterion release resulting from polyplex formation [32]. The equilibrium binding constant rapidly increased as oligolysine was elongated. Their thermodynamic results strongly support our result of decreasing cC/A ratios.
Interestingly, the GFP expressions after nuclear or cytosolic microinjection of PK and PR showed identical suppression (figure 6). A similar tendency in the transcription efficiency of PK and PR indicates that there is no difference in the efficiency at steps III and IV between PK and PR, and thus, the side chains of PK and PR may not be affecting the transcription efficiency in living cells. Morohashi et al reported that the B′- or Z-form of DNA stimulates transcription by improving accessibility to the promoter [36]. Their study indicates that DNA conformation in nucleosomes affects recognition by transcription factors. Nucleosomes are complexes formed with DNA, and cationic proteins such as polyplexes are formed with pDNA and cationic carriers. We compared the circular dichroism spectra of PK and PR polyplexes in Tyrode's solution at a C/A ratio of 1.5. C-form DNA structures were observed in PK and PR polyplexes, while the circular dichroism spectrum of pDNA only displayed a B-form structure (data not shown). It appears that pDNAs in PK and PR polyplexes are difficult for transcription factors to recognize because of their conformation and inaccessibility. The transcription efficiencies of PK and PR polyplexes were measured 24 h after microinjection in this study. The structures were considered to be stable, and transcription factors could not recognize PK and PR polyplexes within 24 h.
The cC/A ratios were in agreement with the tendency shown by the transcription efficiency (figure 7). The cC/A ratios of the polypeptides decreased with increasing MW. These results indicate that the cC/A ratio can provide an index of the transcription efficiency.
Nuclear transport (step III) is considered to be an important step in gene delivery into mammalian cells [9,11]. One of the pathways for entering the nucleus is the recognition of the nuclear localization signal by importins on the nuclear membranes. Minimum nuclear localization signal (PKKKRKV) involves both lysine and arginine and has been well used as a carrier [37, 38]. There have been no previously published studies comparing the difference in the efficiency of L-lysine and L-arginine in nuclear transport. Here, we evaluated the efficiencies of the nuclear transport of PK and PR using microinjection. When the polyplexes were microinjected into the nuclei of living cells, GFP expression efficiency represented the efficiency of transcription (step IV) only (figure 6(a)). On the other hand, GFP expression efficiency after cytosolic microinjection indicated the efficiencies of nuclear transport (step III) and transcription (step IV) (figure 6(b)). This difference in GFP expression/pg pDNA between nuclear and cytosolic microinjection revealed the efficiency of nuclear transport (step III). GFP expressions after nuclear or cytosolic microinjection of PK and PR polyplexes lay on the same line. Thus, efficiency of the nuclear transport of PK (step III) is considered to be similar to that of PR.
To summarize, there were no clear differences between efficiencies of PR and PK during cellular uptake (step I), nuclear transport (step III) and transcription (step IV). Thus, the rate-limiting step during gene transfer is predicted to be endosomal escape (step II). The transfection efficiencies in the absence of chloroqione are shown in figure 2, and these were determined by the efficiencies at all steps I–IV. Figure 2 suggests the predominance of the transfection efficiency of PR during all steps from cellular uptake (step I) to transcription (step IV). When transfection experiments were performed in the presence of chloroquine, endosomal escape (step II) was removed from the process. A weak-base reagent, chloroquine has been used in nonviral gene delivery for effective endosomal escape because it has the ability to block endosomal acidification [39]. The transfection efficiencies of PR polyplexes in the presence of 100 M chloroquine were twofold higher than those in the absence of chloroquine. In the case of PK, 10-fold higher transgene expression was obtained when cells were transfected with chloroquine (data not shown). These effects of chloroquine on PK and PR polyplex-mediated transfection indicate that PR is superior to PK during endosomal escape (step II). Thus, PK appears to have less ability to escape from endosomes than PR.
Generally, the buffering capacities of polymeric gene carriers are used as an index of their endosomal escape ability. Acid titration experiments have been performed using PK and PR polypeptides, with the polypeptide solution (3 mM) adjusted to pH 11.0 and then titrated with 0.1M HCl at room temperature (data not shown). We found that the buffering capacities of all PRs were similar to those of the control NaCl solution, while all PKs showed only slight buffering capacities. These results disagree with the results from the chloroquine experiments and indicate that PR may have another mechanism of escaping from endosomes. Bondeson and Sundler reported that PR provoked remarkable leakage from anionic liposomes compared with PK at neutral pH [40]. Their result was inferred from their different side chains, guanidine groups or primary amino groups. Our results indicate that the predominance of PR over PK in in vitro transfection results from superior PR endosomal escape (step II).
Conclusions
We have successfully evaluated the transcription efficiency in living cells by a microinjection technique. Our results indicate that the transcription efficiency of PK is unexpectedly equal to that of PR, although overall, the transfection efficiency of PR is higher than that of PK. Transcription efficiency is greatly dependent on MW, and high MW polypeptides suppress transcription efficiency due to stronger compaction of the polyplexes. This tendency is negatively correlated with the cC/A ratios of the polypeptides, and the cC/A ratio can be used as an index of transcription efficiency.
Results from measurements of the cellular uptake of the polyplexes, in vitro transfection with or without chloroquine, and nuclear and cytosolic microinjection revealed that the rate-limiting step appears to be endosomal escape in PK and PR polyplex-mediated transfections.
Acknowledgments
The authors thank Professor Kazuhiko Ishihara from the University of Tokyo for excellent discussions. This study was partially supported by grants-in-aid from the Ministry of Health, Labor and Welfare of Japan.
References
- Niidome T, Ohmori N, Ichinose A, Wada A, Mihara H, Hirayama T. and Aoyagi H. J. Biol. Chem. 1997;272:15307. doi: 10.1074/jbc.272.24.15307. [DOI] [PubMed] [Google Scholar]
- Leng Q. and Mixson A J. Nucleic Acids Res. 2005;33:e40. doi: 10.1093/nar/gni040. [DOI] [PMC free article] [PubMed] [Google Scholar]
- Hashimoto T, Tachibana Y, Nozaki H, Mazda O, Niidome T, Murakami A. and Yamaoka T. Chem. Lett. 2009;38:718. doi: 10.1246/cl.2009.718. [DOI] [Google Scholar]
- Zama M. Biochim. Biophys. Acta. 1974;366:124. [PubMed] [Google Scholar]
- Zama M. and Ichimura S. Biochim. Biophys. Acta. 1975;414:256. doi: 10.1016/0005-2787(75)90164-1. [DOI] [PubMed] [Google Scholar]
- Kurosaki T, Kitahara T, Kawakami S, Higuchi Y, Yamaguchi A, Nakagawa H, Kodama Y, Hamamoto T, Hashida M. and Sasaki H. J. Control. Release. 2010;142:404. doi: 10.1016/j.jconrel.2009.11.010. [DOI] [PubMed] [Google Scholar]
- Naik R J, Chandra P, Mann A. and Ganguli M. J. Biol. Chem. 2011;286:18982. doi: 10.1074/jbc.M111.227793. [DOI] [PMC free article] [PubMed] [Google Scholar]
- Masuda T, Akita H. and Harashima H. FEBS Lett. 2005;579:2143. doi: 10.1016/j.febslet.2005.02.071. [DOI] [PubMed] [Google Scholar]
- Banks G A, Roselli R J, Chen R. and Giorgio T D. Gene Ther. 2003;10:1766. doi: 10.1038/sj.gt.3302076. [DOI] [PubMed] [Google Scholar]
- Akita H, Tanimoto M, Masuda T, Kogure K, Hama S, Ninomiya K, Futaki S. and Harashima H. J. Gene Med. 2006;8:198. doi: 10.1002/(ISSN)1521-2254. [DOI] [PubMed] [Google Scholar]
- James M B. and Giorgio T D. Mol. Ther. 2000;1:339. doi: 10.1006/mthe.2000.0054. [DOI] [PubMed] [Google Scholar]
- Varga C M, Hong K. and Lauffenburger D A. Mol. Ther. 2001;4:438. doi: 10.1006/mthe.2001.0475. [DOI] [PubMed] [Google Scholar]
- Putnam D, Gentry C A, Pack D W. and Langer R. Proc. Natl Acad. Sci. USA. 2001;98:1200. doi: 10.1073/pnas.031577698. [DOI] [PMC free article] [PubMed] [Google Scholar]
- Remy-Kristensen A, Clamme J P, Vuilleumier C, Kuhry J G. and Mely Y. Biochim. Biophys. Acta. 2001;1514:21. doi: 10.1016/S0005-2736(01)00359-5. [DOI] [PubMed] [Google Scholar]
- Bieber T, Meissner W, Kostin S, Niemann A. and Elsasser H. J. Control. Release. 2002;82:441. doi: 10.1016/S0168-3659(02)00129-3. [DOI] [PubMed] [Google Scholar]
- Honore I, Grosse S, Frison N, Favatier F, Monsigny M. and Fajac I. J. Control. Release. 2005;107:537. doi: 10.1016/j.jconrel.2005.06.018. [DOI] [PubMed] [Google Scholar]
- Schaffer D V, Fidelman N A, Dan N. and Lauffenburger D A. Biotechnol. Bioeng. 2000;67:598. doi: 10.1002/(ISSN)1097-0290. [DOI] [PubMed] [Google Scholar]
- Symonds P, Murray J C, Hunter A C, Debska G, Szewczyk A. and Moghimi S M. FEBS Lett. 2005;579:6191. doi: 10.1016/j.febslet.2005.09.092. [DOI] [PubMed] [Google Scholar]
- Godbey W T, Wu K K. and Mikos A G. Proc. Natl Acad. Sci. USA. 1999;96:5177. doi: 10.1073/pnas.96.9.5177. [DOI] [PMC free article] [PubMed] [Google Scholar]
- Kunath K, von Harpe, Fischer D, Petersen H, Bickel U, Voigt K. and Kissel T. J. Control. Release. 2003;89:113. doi: 10.1016/S0168-3659(03)00076-2. [DOI] [PubMed] [Google Scholar]
- Breunig M, Lungwitz U, Liebl R, Fontanari C, Klar J, Kurtz A, Blunk T. and Goepferich A. J. Gene Med. 2005;7:1287. doi: 10.1002/(ISSN)1521-2254. [DOI] [PubMed] [Google Scholar]
- Koping-Hoggard M, Mel'nikova Y S, Varum K M, Lindman B. and Artursson P. J. Gene Med. 2003;5:130. doi: 10.1002/(ISSN)1521-2254. [DOI] [PubMed] [Google Scholar]
- Bettinger T, Carlisle R C, Read M L, Ogris M. and Seymour L W. Nucleic Acids Res. 2001;29:3882. doi: 10.1093/nar/29.18.3882. [DOI] [PMC free article] [PubMed] [Google Scholar]
- Reschel T, Konak C, Oupicky D, Seymour L W. and Ulbrich K. J. Control. Release. 2002;81:201. doi: 10.1016/S0168-3659(02)00045-7. [DOI] [PubMed] [Google Scholar]
- Zama M. and Ichimura S. Biochem. Biophys. Res. Commun. 1971;44:936. doi: 10.1016/0006-291X(71)90802-3. [DOI] [PubMed] [Google Scholar]
- Ahn C H, Chae S Y, Bae Y H. and Kim S W. J. Control. Release. 2002;80:273. doi: 10.1016/S0168-3659(01)00547-8. [DOI] [PubMed] [Google Scholar]
- Wolfert M A, Schacht E H, Toncheva V, Ulbrich K, Nazarova O. and Seymour L W. Hum. Gene Ther. 1996;7:2123. doi: 10.1089/hum.1996.7.17-2123. [DOI] [PubMed] [Google Scholar]
- Toncheva V, Wolfert M A, Dash P R, Oupicky D, Ulbrich K, Seymour L W. and Schacht E H. Biochim. Biophys. Acta. 1998;1380:354. doi: 10.1016/S0304-4165(98)00004-X. [DOI] [PubMed] [Google Scholar]
- Cherng J Y, van de Wetering P, Talsma H, Crommelin D J. and Hennink W E. Pharm. Res. 1996;13:1038. doi: 10.1023/A:1016054623543. [DOI] [PubMed] [Google Scholar]
- Howard K A, Dash P R, Read M L, Ward K, Tomkins L M, Nazarova O, Ulbrich K. and Seymour L W. Biochim. Biophys. Acta. 2000;1475:245. doi: 10.1016/S0304-4165(00)00076-3. [DOI] [PubMed] [Google Scholar]
- Liquier J, Pinot-Lafaix M, Taillandier E. and Brahms J. Biochemistry. 1975;14:4191. doi: 10.1021/bi00690a007. [DOI] [PubMed] [Google Scholar]
- Mascotti D P. and Lohman T M. Biochemistry. 1997;36:7272. doi: 10.1021/bi970272n. [DOI] [PubMed] [Google Scholar]
- Fromm J R, Hileman R E, Caldwell E E, Weiler J M. and Linhardt R J. Arch. Biochem. Biophys. 1995;323:279. doi: 10.1006/abbi.1995.9963. [DOI] [PubMed] [Google Scholar]
- Zauner W, Brunner S, Buschle M, Ogris M. and Wagner E. Biochim. Biophys. Acta. 1999;1428:57. doi: 10.1016/S0304-4165(99)00022-7. [DOI] [PubMed] [Google Scholar]
- Pollard H, Remy J S, Loussouarn G, Demolombe S, Behr J P. and Escande D. J. Biol. Chem. 1998;273:7507. doi: 10.1074/jbc.273.13.7507. [DOI] [PubMed] [Google Scholar]
- Morohashi N, Yamamoto Y, Kuwana S, Morita W, Shindo H, Mitchell A P. and Shimiz M. Eukaryot. Cell. 2006;5:1925. doi: 10.1128/EC.00105-06. [DOI] [PMC free article] [PubMed] [Google Scholar]
- Chan C K. and Jans D A. Hum. Gene Ther. 1999;10:1695. doi: 10.1089/10430349950017699. [DOI] [PubMed] [Google Scholar]
- Branden L J, Mohamed A J. and Smith C I. Nat. Biotechnol. 1999;17:784. doi: 10.1038/11726. [DOI] [PubMed] [Google Scholar]
- Maxfield F R. J. Cell Biol. 1982;95:676. doi: 10.1083/jcb.95.2.676. [DOI] [PMC free article] [PubMed] [Google Scholar]
- Bondeson J. and Sundler R. Biochim. Biophys. Acta. 1990;1026:186. doi: 10.1016/0005-2736(90)90063-T. [DOI] [PubMed] [Google Scholar]