Abstract
Separating and purifying cell membrane-associated biomolecules has been a challenge owing to their amphiphilic property. Taking these species out of their native lipid membrane environment usually results in biomolecule degradation. One of the new directions is to use supported lipid bilayer (SLB) platforms to separate the membrane species while they are protected in their native environment. Here we used a type of crosslinkable diacetylene phospholipids, diynePC (1,2-bis(10,12-tricosadiynoyl)-sn-glycero-3-phosphocholine), as a packed material to create a ‘two-dimensional (2D) packed bed’ in a SLB platform. After the diynePC SLB is exposed to UV light, some of the diynePC lipids in the SLB can crosslink and the non-crosslinked monomer lipids can be washed away, leaving a 2D porous solid matrix. We incorporated the lipid vesicle deposition method with a microfluidic device to pattern the location of the packed-bed region and the feed region with species to be separated in a SLB platform. Our atomic force microscopy result shows that the nano-scaled structure density of the ‘2D packed bed’ can be tuned by the UV dose applied to the diynePC membrane. When the model membrane biomolecules were forced to transport through the packed-bed region, their concentration front velocities were found to decrease linearly with the UV dose, indicating the successful creation of packed obstacles in these 2D lipid membrane separation platforms.
Keywords: 10.01, 10.13, 20.11
Keywords: supported lipid bilayers, 2D packed bed, separation, diacetylene phospholipids, crosslinking
1. Introduction
Cell membrane is a biological membrane that separates the interior of a cell from its outside environment. Understanding the functions and structures of cell membrane-associated species could allow us to know when a certain signal or pathogen can enter into the cell [1]. However, processing and handling membrane-associated species while maintaining their intact structural information remains a challenge. Most of the problem stems from their amphiphilic properties. Many current strategies rely on the use of harsh chemicals and conditions to remove the membrane species from cells and to purify membrane species for further characterization [2, 3]. When these approaches are applied to membrane species, they may cause denaturation of the target species, or disrupt the species’ function originated from the interactions with the lipid membrane. Therefore, approaches that can process membrane species in their native-like environment would offer a way to open this bottleneck.
A recently developed approach is to carry out the necessary processing steps within a membrane environment, such as a supported lipid bilayer (SLB), so that the delicate hydrophobic core of the membrane species can be protected [4–6]. SLBs are planar extended bilayers adsorbed on a suitable solid surface [7, 8], and the planar geometry position is compatible with a wide range of surface analytical tools requiring planar geometry, such as surface plasmon resonance [9], atomic force microscopy (AFM) [10], Brewster angle microscopy, quartz crystal microbalance [11], ellipsometry and fluorescence recovery after photobleaching [12–15]. SLBs can be formed by the vesicle deposition method, in which small lipid vesicles can undergo rupture and fusion to form an extended, adsorbed, planar bilayer on suitably prepared surfaces [16]. SLBs can retain their fluid property by trapping a thin water layer between the solid support and lipid bilayers [17–19]. In addition, many studies have been shown to successfully incorporate cell membrane functional components such as proteins onto or into the SLB [12, 20].
Membrane species are able to transport in the two-dimensional (2D) SLBs by diffusion or convection. Previous studies have shown the possibilities of separating membrane-bound biomolecules in 2D SLBs based on the biomolecules’ different responses to various types of applied driving forces. Daniel et al [21] have used electrophoresis to separate membrane-bound species in SLBs. Liu et al [22] applied an electrophoretic–electroosmotic focusing method in SLBs. Jönsson et al [23] used hydrodynamic force to separate membrane species based on the target species’ different head group sizes. Neumann et al [24] applied surface acoustic waves to SLBs and the membrane species could be separated based on their preference for either wave nodes or wave antinodes. These current approaches majorly focus on exploring different types of driving forces and very few approaches have been developed by modulating the properties of a separation medium [21].
Tailoring the separation medium property could influence the species’ transport rates and therefore influence the separation efficiency. Many of the conventional ways of tailoring the medium's properties include adding obstacles or packed particles in the separation medium region, such as generating a packed-bed column for chromatography. In order to form packed obstacles in SLBs, we used a type of polymerizable lipid, diynePC (1,2-bis(10,12-tricosadiynoyl)-sn-glycero-3-phosphocholine), to create obstacles in an SLB platform. The diynePC lipid has triple bonds and can form covalent bonding with another diynePC lipid next to it after exposure to 254 nm UV light [25]. The polymerized or crosslinked lipid membrane region becomes solid and has a fixed location in the platform.
Many studies have constructed polymerized lipid membranes with a micron-scaled or nano-scaled structure. Photolithography has been used to selectively polymerize or crosslink the diynePC lipids at the desired region [26]. When the lipid membrane composed of diynePC lipids is exposed to UV light through a photomask, the lipids in the region exposed to the UV light can be polymerized and the non-polymerized lipids can be removed with detergents, leaving a patterned solid structure in a 2D membrane platform. The lipid-free region can be refilled with new lipids to construct solid–fluid composite membranes. In addition to the micron-scaled structure made by photolithography, Okazaki et al [27] have reported that different UV doses can cause different nano-scaled structures. The UV dose is found to positively correlate with the degree of polymerization, leaving a solid matrix with different nano-scaled porosity.
Although these 2D structured polymerized membranes have been generated and characterized, no application has been reported. In addition, the previous studies all used the Langmuir–Blodgett method to prepare diynePC bilayers, which cannot be used to form the bilayers in a covered inner surface, such as the surface inside a microfluidic device. Formation of lipid membranes in a microfluidic device can provide several advantages. The major advantage is that the laminar flow configuration inside a microfluidic channel can allow us to pattern SLBs. The lipid vesicles can follow the streamline and deposit to form a SLB at the desired region in the channel. The bilayer only forms on the surface where the vesicles are flowed through. In addition, after the SLB platform is formed, the strong hydrodynamic shear stress provided by the bulk flow in the microchannel can be used to transport membrane species in the SLB.
Here we created a 2D fluid lipid membrane platform with a nano-scaled packed-bed structure and demonstrated how this membrane platform can be used for separating lipid membrane-associated species. As illustrated in figure 1, we used the vesicle deposition method incorporated with the laminar flow patterning technique to direct the polymerizable diynePC lipid membranes to form at the desired region. After the lipid membrane composed of diynePC lipids is exposed to UV light, the lipids can crosslink to form solid matrices. We controlled the nano-scaled matrix structure by varying the UV dose applied to the lipid membrane. We demonstrated that the membrane species’ moving speed can be significantly influenced by the packed-bed matrix structure after they are transported into the packed-bed membrane region.
Figure 1.
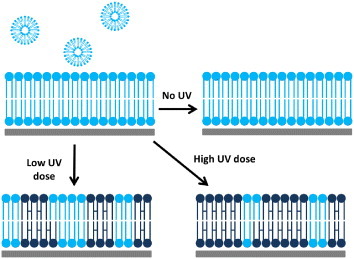
The lipid vesicle deposition method was used to form diynePC SLBs. The UV dose was used to adjust the degree of crosslinking and therefore influenced the nano-scaled structure of the solid matrix in the 2D packed-bed membrane platform.
2. Experimental
2.1. Materials
Diacetylene phospholipid (1,2-bis(10,12-tricosadiynoyl)-sn-glycero-3-phosphocholine (DiynePC)) and 1,2-dioleoyl-sn-glycero-3-phosphocholine (DOPC) were purchased from Avanti Polar Lipids (Alabaster, AL). Texas-Red 1,2-dihexa-decanoyl-sn-glycero-3-phosphoethanolamine triethylammonium salt (Texas-Red DHPE), N-((6-(Biotinoyl)amino)hexanoyl)-1,2-dihexadecanoyl-sn-glycero-3-phosphoethanolamine, triethylammonium salt (Biotin-X DHPE) and Alexa Fluor® 488 conjugated streptavidin were purchased from Invitrogen (Eugene, OR). Polydimethylsiloxane (PDMS; Sylgard 184) used to fabricate microfluidic channels was purchased from Corning (Corning, NY). Sodium dodecyl sulfate (SDS) was purchased from Sigma (St Louis, MO).
2.2. Preparation of large unilamellar vesicles for lipid vesicle deposition on glasses
Large unilamellar vesicles (LUVs) were prepared in order to form SLBs on glass supports using the vesicle deposition method. To create a desired composition of SLB, appropriate amounts of lipids and additives were first mixed together in chloroform and then the chloroform was removed by drying under a vacuum. The dried lipids were then reconstituted in the phosphate buffered saline (PBS) buffer (10 mM PBS and 150 mM NaCl at a pH of 6.6) at a concentration of 2 mg ml−1. LUVs were formed by passing the reconstituted mixture 19 times through a 50 nm polycarbonate filter in an Avanti Mini-Extruder (Alabaster, AL). The vesicle solutions were diluted to 0.2 mg ml−1 before use. The prepared LUV solutions were heated to a temperature (60 °C) above the miscibility transition temperature of the lipid mixture and sent into a microfluidic device which had been already heated to the same temperature. The LUV solutions were in contact with the desired region for 5 min and rinsed extensively with water at the same temperature.
2.3. Fabrication of the microfluidic device
The microfluidic channel was made of PDMS using the technique of soft lithography. The mold for PDMS casting was fabricated by using SU8 photoresist (Microchem, USA). The standard fabrication procedure used for an SU8 mold was from the vendor's website. Glass coverslips were cleaned by argon plasma for 10 min, and they were also treated with oxygen plasma for 30 s in order to seal with the PDMS microchannel slab.
2.4. UV radiation treatment
SLBs placed in a PDMS microfluidic channel were irradiated with a UV lamp (UVP, short-wave assembly 115 V, 60 Hz, 254 nm) for 0.5–2 h at room temperature. The sample is placed at a location 1 cm away from the lamp. After the UV irradiation, non-crosslinked diynePC monomers were removed from the substrate surface by immersing the sample in a 0.1 M SDS solution at 30 °C for 30 min. Then the sample was rinsed extensively with deionized water. The crosslinked diynePC membranes were stored in the dark at 4 °C before use.
2.5. Atomic force microscopy (AFM) observation of crosslinked diynePC lipid membranes
AFM observations of the crosslinked lipid bilayers were examined by bioatomic force microscopy (bio-AFM) in contact mode. The instrument is equipped with a NanoWizard scanner and operated in liquid (Millipore water, temperature inside the liquid cell is 20 °C). A V-shaped silicon nitride cantilever was used (OMCL-TR400PSA, Olympus, knominal = 0.02 N m−1). All AFM images were acquired with a JPK Instruments AG multimode NanoWizard (Germany). Scan rates of 0.6 and 0.8 Hz were used to collect the images. The collected images were treated with the JPK image processing for plane correction and low-pass Gaussian smoothing.
2.6. Images by fluorescence microscopy
The fluorescence images were obtained using an Olympus IX81 inverted microscope with a 20 × objective. Fluorescence from the Alexa-Fluoro488© fluorophore was observed by the Olympus U-WIBA filter set (excitation wavelength: 470–490 nm, emission wavelength: 510–550 nm), and Texas-Red fluorophore was observed by the Olympus U-MWIY filter set (excitation wavelength: 545–580 nm; emission wavelength: >610 nm). Fluorescence images were collected with a CCD camera (ORCA-R2, Hamamatsu, Japan) and processed with the HCImage program (Hammatsu, Japan).
3. Results and discussion
3.1. Principle of the method
To construct a 2D packed-bed lipid membrane platform, we used polymerizable lipids, diynePC (1,2-bis(10,12-tricosadiynoyl)-sn-glycero-3-phosphocholine), to create obstacles or packed materials in the platform. The diynePC lipid has triple bonds and can form covalent bonding with other diynePC lipids next to it after exposure to 254 nm UV light. The crosslinked lipids solidified and could not be easily moved by applying external force in the 2D membrane, compared to the non-crosslinked lipids. The porosity of the ‘2D packed bed’ is determined by the packed material density in this membrane platform. Since it has been shown that the degree of crosslinking is directly correlated to the UV dose applied to the diynePC lipid membrane, we adjusted the UV dose to control the porosity of our 2D packed-bed membrane platform.
When the membrane species embedded in SLBs were forced to transport through this part of the membrane platform, the velocity of biomolecules became slower with the increasing porosity. The driving force for the lipid membrane and the embedded biomolecules to transport on the solid support is the applied hydrodynamic flow of the bulk solution in the microchannel. Owing to the small length scale of a microchannel, a large shear stress can occur at locations close to the solid glass support. The shear stress from hydrodynamic flow above the supported bilayers can easily make the fluid lipid membrane to have a relative moving speed with the solid support [28]. However, we hypothesized that the crosslinked diynePC matrix cannot be easily moved by the bulk flow shear stress and therefore can be viewed as stationary obstacles in the membrane platform. As illustrated in figure 2, when there are more created obstacles in the 2D membrane, the mobile fluid lipid membrane region becomes smaller. The velocity of the membrane species in the fluid membrane can become slower due to the obstacles' blocking effect.
Figure 2.
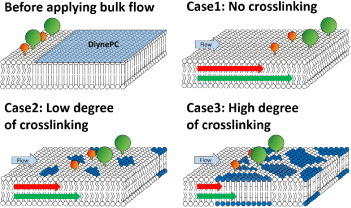
Illustration of how the membrane embedded species’ moving speeds in the packed-bed membrane platform can be influenced by the degree of crosslinking of diynePC lipids. The white lipids are the lipids composed of the fluid membrane, which can be easily moved by the shear stress from the bulk flow. The dark blue lipids are the crosslinked diynePC lipids, which can be viewed as obstacles with fixed location on the solid support. The red and green colors denote the model membrane species with different sizes. They can have different moving speeds in the platform and therefore be separated into different positions.
3.2. Fabrication of a 2D packed-bed membrane platform in a microfluidic device
To construct a 2D packed-bed membrane platform, we have to form not only the packed-bed region, but also the load region in the same membrane platform. To control their spatial locations in the membrane platform, we used the laminar flow to deliver lipid vesicles with desired compositions to the target regions within the microfluidic channel. The lipid vesicles can deposit and form SLBs at the region they were flowing through.
We used the following procedure, as illustrated in figure 3. Firstly, we sent diynePC lipid vesicles from port 1 and a buffer stream from port 2, and let them leave from ports 3 and 4. The buffer stream was intended to keep diynePC lipid vesicles staying in the right half of the channel, so that the diynePC lipid membrane only formed in the right half of the channel (figure 3(a), light blue color). Before and during this step, the system was heated to 60 °C (both the device and the diynePC lipid vesicles), so that the diynePC lipid vesicles were above the phase transition temperature and readily fused to glass surface to form an SLB. We found that if we fused the diynePC lipid vesicles at room temperature, they did not rupture well and the solid support could not be fully covered by the diynePC lipid membrane. Afterward, a 60 °C buffer was used to rinse out the excess vesicles and the system was quenched to 4 °C immediately. The sample was kept at 4 °C for 1 day to allow the diynePC lipids to reorganize their assembly situation in the membrane, as has been described in many previous studies [27, 29].
Figure 3.
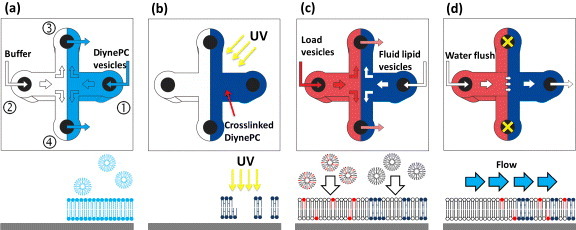
Formation of a 2D packed-bed membrane platform in a microfluidic device by the vesicle deposition method. The upper panels are the top views of the microchannel and the lower panels are the side views in the middle part of the channel at different steps. The channel has four arms and each arm is 0.7 cm long, 500 μm wide and 110 μm high. The laminar flow can be used to pattern the locations of the load region and packed-bed region in the membrane platform. White lipids: the lipids composed of the fluid membrane; light blue lipids: the diynePC lipids; dark blue lipids: the crosslinked diynePC lipids; and red lipids: model membrane species.
Secondly, as illustrated in figure 3(b), the formed diynePC membranes were exposed to UV light at various doses, and the non-crosslinked diynePC lipids were removed with SDS. The system was incubated in SDS at 30 °C for 30`min and rinsed extensively with water. For the rinsing step, water entered into the device from port 1 and left the device from ports 2–4. The flow rate of the input arm was 180 μl min−1 and the flow rate in each of the three output arms was 60 μl min−1.
Thirdly, as illustrated in figure 3(c), the vesicles with load composition were sent from port 2, and the vesicles with fluid phase composition were sent from port 1. Both streams were forced to leave from ports 3 and 4 to ensure that the load vesicles only stayed on the left side of the channel and the fluid phase vesicles stayed on the right side. Note that the fluid phase vesicles can only be refilled to the empty glass surface where there were no crosslinked diynePC lipids. The fluid phase was composed of DOPC, which is an unsaturated phospholipid and is highly fluid in lipid membranes at room temperature, and can be viewed as the mobile phase in the packed-bed region. The load vesicles were composed of a small amount of model membrane species and a large amount of DOPC.
Fourthly, as illustrated in figure 3(d), ports 3 and 4 were blocked and buffer solutions were sent from port 2 to port 1 at a flow rate of 560 μl min−1, in order to drive the model membrane species from the load region to the packed-bed region.
Note that the vesicles were exposed to the glass surface for 5 min under flow and then rinsed with buffer or water for 10 min in all of the lipid membrane formation steps. During the SLB formation, the flow rates of lipid vesicle solutions and rinsing buffers were kept at 80 μl min−1 in each arm of the device (500 μm wide and 110 μm high).
3.3. Bilayer packed-bed matrices imaged with AFM
AFM images of the crosslinked lipid membranes were taken in water to check the morphology of the bilayers (figure 4). A bio-AFM was used for the measurements in contact mode with the V-shaped silicon nitride cantilever (OMCL-TR400PSA, Olympus, knominal = 0.02 N m−1). The crosslinked diynePC membranes for the AFM measurements were prepared in a microchannel as described in sections 3.2 and 2.4. The non-crosslinked monomers were removed by SDS and rinsed extensively in water. The PDMS microchannels were removed from the glass after the crosslinked diynePC matrices were formed.
Figure 4.
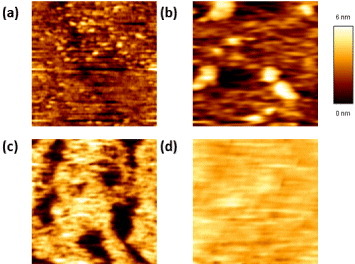
AFM image (1 × 1μm2) of crosslinked lipid bilayers with various UV doses: (a) 1 J cm−2, (b) 2 J cm−2, (c) 3 J cm−2 and (d) 4 J cm−2.
Figure 4 shows the AFM images of crosslinked diynePC matrices after the membranes were treated with 1, 2, 3 and 4 J cm−2 UV doses. The uplift pillar-shape area indicates the region with crosslinked bilayers, whereas the dark color indicates the region where the non-crosslinked diynePC monomers were removed by SDS. As shown in figure 4 and the thickness calibration bar, the crosslinked bilayer thickness is ∼5.5 nm, which agrees well with the previous studies [26, 27, 29]. We also observed some ∼2.7 nm height features, which could be the crosslinked monolayer. Figure 4 shows that the coverage of the crosslinked region increased with the UV dose. For the case when the UV irradiation dose was equal to 4.0 J cm−2 (figure 4(d)), the surface was almost fully covered by the crosslinked bilayers. This result indicates that the degree of crosslinking increased with the UV doses, and therefore we could use the UV dose to tune the density of the crosslinked diynePC matrices.
3.4. Movement of model membrane species in the 2D packed-bed membranes
Membrane-associated species have a hydrophilic part exposed to the outside aqueous solution and a hydrophobic part embedded in the membrane. To demonstrate that the crosslinked diynePC matrices can significantly influence the molecule's moving speed in the membrane, we chose a two-model membrane species with the same hydrophobic size but a different hydrophilic size, as shown in figure 5(a). One is the Texas-Red DHPE (TR-DHPE), which is a phospholipid with a Texas-Red fluorophore attached to its head group. The other is a biotinylated lipid with Alexa Fluor® 488 labeled streptavidin attached to its head group (A488-streptavidin–biotin-X DHPE).
Figure 5.
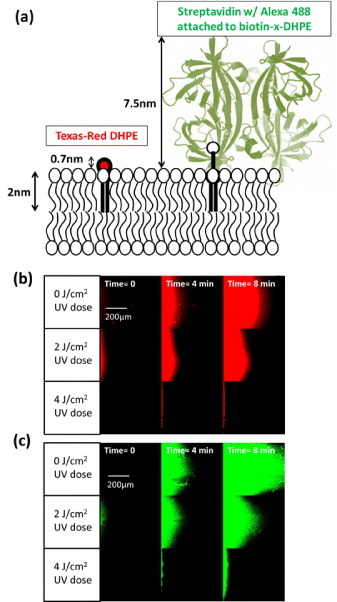
Movement of model membrane species in the 2D packed-bed membranes. (a) The two model membrane species used in this study: the left one is Texas-Red DHPE (TR-DHPE) and the right one is Biotin-DHPE with Alexa- Fluor®488 labeled streptavidin attached to its head group (A488-streptavidin–biotin-X DHPE). (b) The movement of TR-DHPE with time in packed-bed membranes when their crosslinked diynePC matrices were formed under 0, 2 and 4 J cm−2 UV doses. (c) The movement of A488-streptavidin–biotin-X DHPE under the same situations as (b).
We observed that the species with the larger head group, A488-streptavidin–biotin-X DHPE, can move faster in the membrane than the one with the smaller head group, TR-DHPE, does. In this study, we used the shear force by the bulk flow in the microfluidic channel to drive the motion of the lipid bilayer and the species embedded in it at the velocities that scale linearly with the bulk flow rate [23, 28]. For a membrane species with the larger hydrophilic head group exposed in the bulk solution, it can experience more hydrodynamic force from the bulk solution and can move faster than the other lipids constituting the SLB. The moving speed relative to the SLB is found to have a positive correlation with the hydrophilic head group size, which can explain why A488-streptavidin–biotin-X DHPE can move faster than TR-DHPE in either the homogeneous membranes or in the membranes with crosslinked obstacles.
As shown in figures 5(b) and (c), both TR-DHPE and A488-streptavidin–biotin-X DHPE moved slower in the 2D packed bed exposed to a higher UV dose when we provided the same driving force, indicating that the crosslinked diynePC lipids can act as obstacles to block the movement of membrane species. For the case when the UV dose was up to 4 J cm−2, we did not see any membrane species penetrating into the packed-bed region. We observed that the concentration fronts of TR-DHPE and A488-streptavidin–biotin-X DHPE have parabolic shapes. This observation is because the bulk flow velocity distribution developed in the channel has a parabolic shape and the membrane species’ moving velocity is found to scale linearly with the bulk flow rate.
Although the concentration fronts of both TR-DHPE and A488-streptavidin–biotin-X DHPE are in parabolic shape, we observe that the parabolic shape at the front edge of TR-DHPE is rounder than that of A488-streptavidin–biotin-X DHPE. The longer, sharper parabolic shape of the concentration front indicates that the ratio of the axial convection rate to the radial diffusion rate is larger, and vice versa. Under the situation that these two species have similar diffusivities in the membrane, this shape difference also supports that A488-streptavidin–biotin-X DHPE experiences larger hydrodynamic force by the bulk flow in the axial direction.
3.5. Data analyses to quantify front velocity
The fluorescence intensity of the membrane species is supposed to be proportional to the concentration of the species in the concentration range used in this study. Therefore, we used the detected fluorescence intensity to quantify the transporting rate of the membrane species. Note that the feed type in many previous studies is a pulse and the velocity can be easily estimated by the position of the fluorescence intensity profile peak. In this case, our feed from the load region can be viewed as a continuous feed, which is composed of numerous pulses entering into the packed bed continuously, and no single peak can be observed. Under this situation, we decided to track the location of the concentration front to quantify model species’ moving velocity in the membrane platform.
Figure 6 illustrates how we obtained the concentration front velocity from fluorescence image data. We defined the direction of the flow as x-direction and the perpendicular direction as y-direction (figure 6(a)). In order to obtain a representative velocity of the concentration front, we took the following steps. The first step was to eliminate the fluorescence background in the data, average the fluorescence intensity in the y-direction and plot it along the x-axis. The second step was to determine the position of the front at various time points. The intensity profile along the x-axis at some specific given time is illustrated in figure 6(b). Determining the exact position of the leading edge point of each intensity profile is not an easy task, since the fluctuation of the detected fluorescence intensity becomes significant when the signal becomes small compared to the noise. To eliminate the noise effect, we defined a leading edge area and found its center of mass as the leading edge position. The leading edge area needs to be small so that it can well represent the position of the concentration front. However, it needs to be large enough so that the intensity integration is much larger than the noise integration over the same x-distance. The lower bound of the leading edge area was defined at the position above which the integration of the fluorescence intensity over length is equal to 10% of the overall intensity integration in the middle time of our observation (t ∼ 3 min). After defining the lower bound position of the leading edge area, we decided on the leading edge area for all of the recorded time points and found the center of mass for each of them. After deciding the representative positions of the leading edge with time (red points in figure 6(b)), we found that they have a positive linear correlation and the leading edge velocity was obtained by applying linear regression to the location versus time (figure 6(c)).
Figure 6.
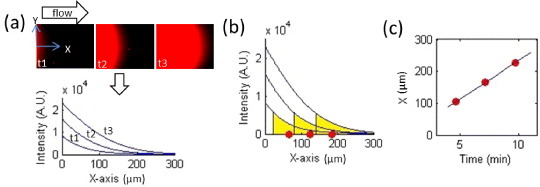
Illustration of how we obtained the membrane species’ concentration front velocity. (a) The y-direction averaged fluorescence intensity was plotted along the x-axis. (b) The leading edge area of the intensity profiles at different time points were defined and their center of mass positions were determined. (c) The front velocity was obtained by tracking how the leading edge position changes with time.
After processing the image data, we obtained the membrane species’ concentration front velocities in the various membrane platforms, as shown in figure 7. In the case when no UV is applied to the membranes, the velocity of the species should be influenced only by the shear stress provided by the bulk flow. In our system, the applied bulk flow rate was 560 μl min−1, which is equal to an average velocity of 0.187 m s−1 in the channel and a surface shear stress close to 7.4 N m−2. When applying this shear stress to the homogeneous fluid membrane, we found that the Texas-Red DHPE concentration front velocity was 16.6 ± 1.2 μm min−1 and the A488-streptavidin–biotin-X DHPE concentration front velocity was 56.6 ± 8.4 μm min−1. These observed front velocities are consistent with the drift velocities of the membrane species, with similar sizes reported in the previous literature [23, 28, 30].
Figure 7.
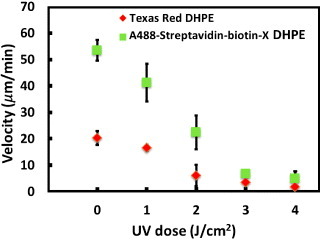
The front velocity decreases approximately linearly with the UV dose applied to the diynePC membranes.
In this study, we constructed obstacles composed of crosslinked diynePC lipids in the membrane platforms. These obstacles could decrease the moving rate of the fluid membrane and the species embedded in the membrane. Figure 7 shows that the front velocity of Texas-Red DHPE was always slower than that of A488-streptavidin–biotin-X DHPE in the membrane platforms exposed to various UV doses. The Texas-Red DHPE front velocity was 16.4 ± 1.2, 10.6 ± 6.2, 3.8 ± 3.4, 2.1 ± 1.2 and 1.1 ± 0.1 μm min−1 in the diynePC membranes exposed to 0, 1, 2, 3 and 4 J cm−2 UV doses, respectively. The A488-streptavidin–biotin-X DHPE front velocity was 56.6 ± 8.4, 34.8 ± 5.2, 19.3 ± 4.1, 6.0 ± 3.8 and 3.5 ± 2.5 μm min−1 in the diynePC membranes exposed to the same range of UV dose. These data show that the front velocity scales are approximately linear with the UV dose applied to the diynePC lipid bilayers, indicating that the front velocity can be tuned by the degree of crosslinking.
Although the front velocity significantly decreases with the degree of crosslinking for both model species, we found that their velocity difference remains the same with an increased degree of crosslinking (below 2 J cm−2 UV dose). If we stop the driving force for separation at the same time for the different platforms, the species concentration front positions in the membranes with a higher degree of crosslinking can be found to stay closer to the inlets. However, the front position difference can be still large, indicating that the species can be separated to the same level in a shorter platform.
Therefore, using the membrane platforms with crosslinked diynePC lipid obstacles could significantly reduce the length of the platform needed for the species to be separated, which is especially important when there are many species to be separated. The reason is that the purpose of separating membrane proteins to different spatial locations on a platform is for their later characterization. Drug candidates or test molecules can be added to the platform in order to assess their interactions with the target membrane proteins. Being able to observe and characterize the response of more membrane species in a single field of view can increase the observation or detection efficiency.
4. Conclusion
We successfully developed a microfluidic device to pattern diynePC membranes in the desired region and to move the model membrane species in the desired direction for separation purposes. The AFM result shows that the crosslinked region of the diynePC membranes increases with the applied UV dose, implying that UV dose can be used to control the crosslinking density and therefore the nano-structure of the packed-bed matrix. The model membrane species’ speeds are indeed found to become slower in the diynePC membranes exposed to a larger UV dose. Based on the observation of the two tested model membrane species, using the membrane platforms with packed obstacles could reduce the length of the platform needed for the species to be separated and therefore increase the detection efficiency and capacity of the platform.
Acknowledgments
We thank the National Science Council of Taiwan (NSC 102-2221-E-002-153-MY3) and the Career Development Grant from National Taiwan University for the financial support.
References
- Rajendran L. and Simons K. J. Cell Sci. 2005;118:1099. doi: 10.1242/jcs.01681. [DOI] [PubMed] [Google Scholar]
- Sprenger R R. and Horrevoets J G. Proteomics. 2007;7:2895. doi: 10.1002/pmic.200700189. [DOI] [PubMed] [Google Scholar]
- Zheng Y Z. and Foster L J. Proteomics. 2009;72:12. doi: 10.1016/j.jprot.2008.09.003. [DOI] [PubMed] [Google Scholar]
- Castellana E T. and Cremer P S. Surf. Sci. Rep. 2006;61:429. doi: 10.1016/j.surfrep.2006.06.001. [DOI] [PMC free article] [PubMed] [Google Scholar]
- Chao L. and Daniel S. J. Am. Chem. Soc. 2011;133:15635. doi: 10.1021/ja205274g. [DOI] [PubMed] [Google Scholar]
- Chao L, Gast A P, Hatton T A. and Jensen K F. Langmuir. 2009;26:344. doi: 10.1021/la902084u. [DOI] [PubMed] [Google Scholar]
- Steinem C, Janshoff A, Ulrich W-P, Sieber M. and Galla H-J. Biochim. Biophys. Acta. 1996;1279:169. doi: 10.1016/0005-2736(95)00274-X. [DOI] [PubMed] [Google Scholar]
- Nielsen L K, Vishnyakov A, Jorgensen K, Bjornholm T. and Mouritsen O G. J. Phys.: Condens. Matter. 2000;12:A309. doi: 10.1088/0953-8984/12/8A/340. [DOI] [Google Scholar]
- Salamon Z, Huang D, Cramer W A. and Tollin G. Biophys. J. 1998;75:1874. doi: 10.1016/S0006-3495(98)77628-3. [DOI] [PMC free article] [PubMed] [Google Scholar]
- Reviakine I. and Brisson A. Langmuir. 2000;16:1806. doi: 10.1021/la9903043. [DOI] [Google Scholar]
- Keller C A. and Kasemo B. Biophys. J. 1998;75:1397. doi: 10.1016/S0006-3495(98)74057-3. [DOI] [PMC free article] [PubMed] [Google Scholar]
- Salafsky J, Groves J T. and Boxer S G. Biochemistry. 1996;35:14773. doi: 10.1021/bi961432i. [DOI] [PubMed] [Google Scholar]
- Nollert P, Kiefer H. and Jaehnig F. Biophys. J. 1995;69:1447. doi: 10.1016/S0006-3495(95)80014-7. [DOI] [PMC free article] [PubMed] [Google Scholar]
- Cremer P S. and Boxer S G. J. Phys. Chem. B. 1999;103:2554. doi: 10.1021/jp983996x. [DOI] [Google Scholar]
- Starr T E. and Thompson N L. Langmuir. 2000;16:10301. doi: 10.1021/la000992m. [DOI] [Google Scholar]
- Raedler J, Strey H. and Sackmann E. Langmuir. 1995;11:4539. doi: 10.1021/la00011a058. [DOI] [Google Scholar]
- Kiessling V. and Tamm L K. Biophys. J. 2003;84:408. doi: 10.1016/S0006-3495(03)74861-9. [DOI] [PMC free article] [PubMed] [Google Scholar]
- Tamm L K. Biochemistry. 1988;27:1450. doi: 10.1021/bi00405a009. [DOI] [PubMed] [Google Scholar]
- Dietrich C, Merkel R. and Tampe R. Biophys. J. 1997;72:1701. doi: 10.1016/S0006-3495(97)78816-7. [DOI] [PMC free article] [PubMed] [Google Scholar]
- Hook F, Kasemo B, Nylander T, Fant C, Sott K. and Elwing H. Anal. Chem. 2001;73:5796. doi: 10.1021/ac0106501. [DOI] [PubMed] [Google Scholar]
- Daniel S, Diaz A J, Martinez K M, Bench B J, Albertorio F. and Cremer P S. J. Am. Chem. Soc. 2007;129:8072. doi: 10.1021/ja0720816. [DOI] [PMC free article] [PubMed] [Google Scholar]
- Liu C, Monson C F, Yang T, Pace H. and Cremer P S. Anal. Chem. 2011;83:7876. doi: 10.1021/ac201768k. [DOI] [PMC free article] [PubMed] [Google Scholar]
- Jönsson P, Beech J P, Tegenfeldt J O. and Höök F. J. Am. Chem. Soc. 2009;131:5294. doi: 10.1021/ja809987b. [DOI] [PubMed] [Google Scholar]
- Neumann J, Hennig M, Wixforth A, Manus S, Rädler J O. and Schneider M F. Nano Lett. 2010;10:2903. doi: 10.1021/nl100993r. [DOI] [PubMed] [Google Scholar]
- Morigaki K, Kiyosue K. and Taguchi T. Langmuir. 2004;20:7729. doi: 10.1021/la049340e. [DOI] [PubMed] [Google Scholar]
- Morigaki K, Schönherr H, Frank C W. and Knoll W. Langmuir. 2003;19:6994. doi: 10.1021/la034078f. [DOI] [Google Scholar]
- Okazaki T, Inaba T, Tatsu Y, Tero R, Urisu T. and Morigaki K. Langmuir. 2008;25:345. doi: 10.1021/la802670t. [DOI] [PubMed] [Google Scholar]
- Jönsson P, Beech J P, Tegenfeldt J O. and Höök F. Langmuir. 2009;25:6279. doi: 10.1021/la8042268. [DOI] [PubMed] [Google Scholar]
- Morigaki K, Schönherr H. and Okazaki T. Langmuir. 2007;23:12254. doi: 10.1021/la701346x. [DOI] [PubMed] [Google Scholar]
- Peter Jönsson A G. and Höök F. Anal. Chem. 2011;83:604. doi: 10.1021/ac102979b. [DOI] [PubMed] [Google Scholar]


