Abstract
The repeatability of the adsorption and removal of fibrinogen and fetal bovine serum on hydroxyapatite (HAp) nanocrystal sensors was investigated by Fourier transform infrared (FTIR) spectroscopy and quartz crystal microbalance with dissipation (QCM-D) monitoring technique. The HAp nanocrystals were coated on a gold-coated quartz sensor by electrophoretic deposition. Proteins adsorbed on the HAp sensors were removed by (i) ammonia/hydrogen peroxide mixture (APM), (ii) ultraviolet light (UV), (iii) UV/APM, (iv) APM/UV and (v) sodium dodecyl sulfate (SDS) treatments. FTIR spectra of the reused surfaces revealed that the APM and SDS treatments left peptide fragments or the proteins adsorbed on the surfaces, whereas the other methods successfully removed the proteins. The QCM-D measurements indicated that in the removal treatments, fibrinogen was slowly adsorbed in the first cycle because of the change in surface wettability revealed by contact angle measurements. The SDS treatment was not effective in removing proteins. The APM or UV treatment decreased the frequency shifts for the reused HAp sensors. The UV/APM treatment did not induce the frequency shifts but decreased the dissipation shifts. Therefore, we conclude that the APM/UV treatment is the most useful method for reproducing protein adsorption behavior on HAp sensors.
Keywords: reusability, protein adsorption, hydroxyapatite sensor, thin layer, quartz crystal microbalance
Introduction
The reproducibility of results and the reusability of a sensor for detecting protein adsorption, antigen-antibody reactions, and cell adhesion are of great importance for ensuring reliable measurements. There are few technologies for analyzing the in situ dynamic interaction of biomolecules or cells on material surfaces and the change in physicochemical properties including viscoelasticity. The quartz crystal microbalance with dissipation (QCM-D) is an excellent monitoring technique for analyzing such reactions in liquids, because the modification on sensor surfaces (gold) is easier to detect with QCM-D [1, 2] than with ellipsometry [3, 4] or surface plasmon resonance [5–7].
The treatment with ammonia and hydrogen peroxide mixture (APM, NH3/H2O2/H2O) removes dust and nanoparticles from the SiO2/Si surface; it is a standard treatment of the Radio Corporation of America [8]. The APM generates the hydroxyl radical ( ) through the reaction of H2O2 with H2O; the hydrogen peroxide radical (
 ) is then produced by the reaction of the
  radical with H2O2 [9–11]. These radical species have also been used as a SiO2/Si etchant. The free-radical-mediated oxidation leads to the hydroxylation of amino groups of proteins, the conversion of amino acid residues to carbonyl derivatives and the cleavage of polypeptide chains [12].
Bolon and Kunz [13] reported that exposure to ultraviolet light (UV) in an oxygen atmosphere leads to the depolymerization of photoresist polymers. The UV treatment has been widely used as an effective method of decomposing hydrocarbons on substrates [14, 15]. The common light source in such a treatment, a low-pressure mercury lamp, has intense emission lines at 185 and 254 nm. The 185 nm photons induce the dissociation of O2 by generating singlet oxygen (O(1D)), which collides with inert N2 to generate triplet oxygen (O(3P)) and reacts with O2 to produce ozone (O3). The UV also breaks O3 to O(1D), which cleaves organic bonds such C–C, C–H and O–H [16, 17].
In the instruction manual, Q-Sense Co. Ltd recommends a combined APM and UV treatment for cleaning gold from organic substances. Other removal methods for organic chemicals [18] or proteins [19] adsorbed on metal sensors involve detergents and monitoring by the QCM technique. For example, the amount of tripalmitin or dotriacontane desorbed from gold sensors is 88 or 78 wt%, respectively, when using octaethylene glycol mono-n-dodecyl ether as the detergent [18], and the removal of albumin adsorbed on titanium and chromium sensors is 90 wt% when using an ionic surfactant of sodium dodecyl sulfate (SDS) at 37 or 90 °C [19].
Hydroxyapatite (Ca10(PO4)6(OH)2; HAp) is a biocompatible ceramic used as a bone filling material together with collagen [20–23] and as a drug delivery carrier [24–27]. Its biocompatibility can be attributed to its mild adsorption of proteins; hence, this adsorption behavior has been widely investigated [28, 29]. HAp nanocrystal sensors used in the QCM-D technique were recently fabricated by our group by electrophoretic deposition and ultrasonic irradiation [30–32]. The HAp sensors were constructed of HAp nanocrystals precipitated by a wet chemical method, and the thickness of the HAp layer was approximately 20 nm. Repeated adsorption and removal of a tea stain on another HAp sensor (HAp/phosphate-terminated polymer/gold) was studied using the flow of a water solution of sodium tripolyphosphate and the QCM-D technique. A decrease in the frequency shift was observed during repeated testing [33]. Ionic surfactants, such as SDS, have been considered as candidates for removing chemicals adsorbed on bioceramics because of their strong exchange reactions; however, these surfactants were easily adsorbed on HAp [34–37]. Effective removal methods for HAp that do not damage or change the surface properties and retain the reusability of HAp sensors are still to be developed.
In this paper, we describe the reproducibility of the adsorption of fibrinogen and fetal bovine serum (FBS) proteins on the surface of HAp nanocrystals. The proteins were removed from the HAp sensors by five different treatments: APM, UV, UV/APM, APM/UV and SDS. Surface properties, such as morphology, roughness, wettability and protein adsorption after repeated removal treatments were analyzed by contact angle measurements, Fourier transform infrared (FTIR) spectroscopy and the QCM-D technique.
Experimental details
Bovine plasma fibrinogen with the isoelectric point pI=5.5 and molecular weight of 340 kDa was purchased from Calbiochem Co. Ltd. Fetal bovine serum (product number: 12603C, lot no.: 6D0975) was obtained from SAFC Bioscience Co. Ltd and phosphate buffered saline (PBS) was obtained from Dulbecco Co. Ltd. Alpha minimum essential medium (αMEM; product number: 12571-063; Invitrogen Co. Ltd.) was used as a buffer. Ethanol (99.5 vol%), H2O2 (30 vol%), NH3 (25 vol%) and SDS were supplied by Wako Chemicals Co. Ltd.
HAp nanocrystals were synthesized at 21 °C by the wet chemical method [38]. A dilute H3PO4 solution was added dropwise into a Ca(OH)2 suspension until the pH value was 8.0. HAp nanocrystal sensors were fabricated by electrophoretic deposition, as described in previous reports [30, 32]. The HAp suspension was centrifuged at 2000 g for 15 min, washed three times with ethanol and ultrasonically dispersed in ethanol at 1 wt%. Before the deposition, the gold surface of the sensor was cleaned by immersing it in APM (a 5:1:1 mixture by weight of Milli-Q-quality distilled water, H2O2 and NH3) for 10 min at 70 °C and then dried by blowing with N2 gas. The cleaned surface was irradiated with UV (λirr=254 and 185 nm; UV/Ozone, Bioforce Nanoscience Co. Ltd) for 10 min in air. Direct-current voltage was applied at 100 V cm−1 for 1 min. The surplus nanocrystals were removed with a 1-min ultrasonic treatment (28 kHz, 100 W) in ethanol. The deposited weight and thickness of the HAp layer were measured with the QCM-D while shifting the frequency, Δf, in air.
QCM-D (D300; Q-Sense AB) measurements were performed by monitoring Δf (Hz) and dissipation shifts (ΔD) at 15 MHz. The frequency shift was converted to Δfn=3/3 at the frequency of 5 MHz. Viscoelastic properties of the adsorbed proteins were evaluated by the time-saturated value taken from the ΔD/(Δfn=3/3) plot. The weight change was calculated with the Sauerbrey equation [39],
where C is a constant equal to 17.7 ng Hz–1 cm–2.
Fibrinogen was dissolved in PBS at 1 g l−1, and FBS was dissolved in αMEM at 10 vol%. Protein adsorption was measured after stabilizing Δf and ΔD as a baseline in each buffer for 60 min. The temperature was controlled at 24.00±0.05 °C for fibrinogen and at 37.00±0.05 °C for FBS. After monitoring the sensor for 60 min, we rinsed it with PBS (for fibrinogen) and with αMEM (for FBS) and then dried it by blowing with N2 gas.
The reusability of the HAp nanocrystal sensor and its measurement reproducibility for protein adsorption were investigated by the QCM-D technique with five treatments: APM, UV, their combinations and SDS. The fibrinogen adsorbed on the HAp sensor was removed after ten cycles of APM or UV treatments or their combinations. The combinations were in the order of UV and APM (UV/APM) and the reverse, APM/UV. These treatments were applied under the same conditions as adopted for the gold sensors mentioned above. The FBS proteins adsorbed on the HAp sensor were removed by the APM treatment or with 2 wt% of SDS in water. FBS proteins were adsorbed on the HAp surface after stabilizing the baseline and were then treated repeatedly with three cycles of αMEM, SDS and αMEM at 20 min intervals.
The crystalline phase of the nanocrystals dried in air was identified with powder x-ray diffraction (XRD; Ultima-III, Rigaku, CuKα radiation, λ=1.5418 Å, V=40 kV). The diffraction patterns were collected at room temperature in the 2θ range from 5° to 60°. The surface morphology and roughness after the treatments were measured by atomic force microscopy (AFM; SPM-9500; Shimadzu Inc.) in an area of 1×1 μm2. A silicon cantilever (Olympus, OMCL-AC160TS) was used in a dynamic mode. The roughness was calculated as the root-mean-square (RMS) value. The surface wettability was analyzed in air by the sessile drop method using distilled water and a contact angle meter (CA-W200; Kyowa Interface Science). The volume of the droplet was fixed at 1.5 μl and the surface area of the attached droplet was 1.6 mm2. The sensor surfaces were analyzed with an FTIR spectrometer (Spectrum GX; Perkin Elmer Inc.) at 2.0 cm–1 resolution and with 128-scan averaging. A variable-angle specular reflectance accessory was used at an incident angle of 60°, and the reflected IR light was measured with a mercury–cadmium–telluride detector.
Results and discussion
Figure 1 shows the XRD pattern of HAp nanocrystals synthesized at 21 °C. The characteristic peak at approximately 2θ=32° is attributed to the 211 and 112 reflections of HAp. All XRD peaks can be assigned to HAp, indicating the absence of other phases, whereas the large peak width reflects a small size of crystalline domains.
Figure 1.
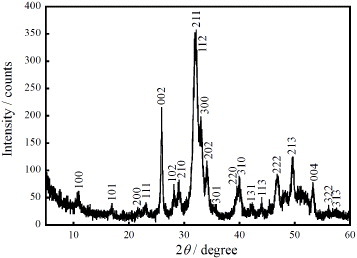
XRD pattern of the synthesized HAp nanocrystals and Miller indexes of the corresponding reflections.
Figure 2 shows the AFM topographical images of (a) gold and (b) HAp sensors. The HAp surface on the gold sensor had an RMS value of 4.1±0.4 nm, which was greater than that of the gold surface (0.6±0.1 nm). The gold surface was evenly covered with the HAp nanocrystals. The weight change of the deposited HAp nanocrystals was 4.6±0.3 μg cm−2, and the thickness was calculated to be 15.1±0.8 nm from the density of HAp (3.14 g cm−3). The contact angle of the as-prepared HAp nanocrystal sensors was 49±2°. These findings were consistent with our previous reports [30, 32].
Figure 2.
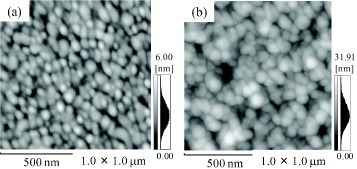
AFM topographical images of (a) gold and (b) HAp sensors.
Figure 3 shows typical time evolutions of Δfn=3/3 and ΔD for the fibrinogen adsorption on the HAp sensors after up to ten cycles of the APM treatment. Most of the fibrinogen was adsorbed on the as-prepared HAp sensors in less than 2 min with a rapid frequency decrease of –79.5±2.6 Hz (1.41 ± 0.05 μg cm–1); the adsorption continued up to 60 min with the associated frequency decrease of –90.6±3.5 Hz (1.60±0.06 μg cm–1). The adsorption behavior after 60 min (t=120 min in figure 3) was classified into two regions with different ΔD/(Δfn=3/3) values of (–6.4±0.5)×10–8 and (–17.7±1.5)×10–8 Hz-1, which were attributed to the conformational change of the adsorbed fibrinogen [30, 32]. The first APM treatment showed a different adsorption behavior with a decrease in Δf; the amount of adsorption after 2 min was less than that on the as-prepared HAp sensors, indicating slow binding to HAp nanocrystals. The same adsorption behavior was observed for the other removal treatments in the first cycle. The contact angles of water on the fibrinogen adlayer on the HAp sensors were constant at 62 ± 1° even after the treatments.
Figure 3.
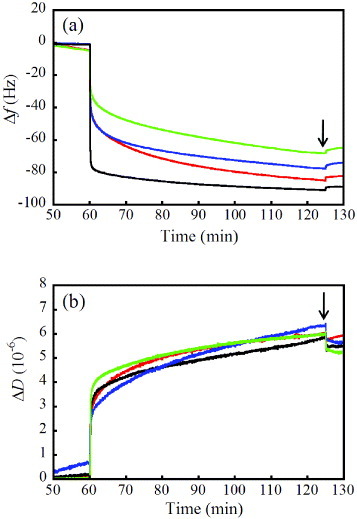
Typical (a) Δfn=3/3 and (b) ΔD evolutions of fibrinogen adsorption on the HAp sensors after up to ten cycles of APM treatment; the adsorption behaviors on the as-prepared HAp sensor (black) and in the first (blue), fifth (red) and tenth (green) cycles of APM treatment are shown. The arrows indicate the introduction of PBS for washing.
Figure 4 shows the contact angles of water on the HAp sensors after up to 10 cycles of different treatments of the preadsorbed fibrinogen. The APM treatment generated the radical species of  and
and  , but the hydrophilic functional groups, such as the hydroxyl group, were not formed on HAp. As a result, the APM treatment did not change the contact angle. In contrast, the first UV treatment dramatically decreased the contact angle to 19±3° in the third cycle and made the surface hydrophilic. The UV irradiation generated O(1D), which reacted with the HAp surface and formed hydroxyl groups on the surface. The contact angles of the surfaces, treated with UV/APM and APM/UV changed to 39.4±5.5° and 35±10° after the first cycle and became constant with further cycles. Similar trends were observed for these treatments of HAp without protein adsorption.
Figure 4.
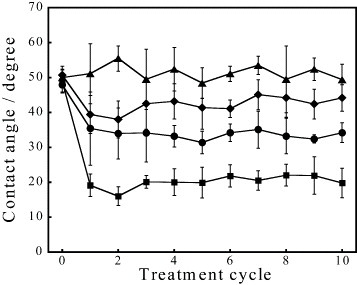
Contact angles of water on the HAp sensors after one to ten cycles of APM (triangles), UV (squares), UV/APM (diamonds) and APM/UV (circles) treatments.
Figure 5 shows FTIR spectra of the HAp sensors with adsorbed fibrinogen before and after one to five cycles of APM and APM/UV treatments. The FTIR spectrum of the as-prepared HAp sensor exhibits bands at 1100 and 1040 cm–1, which can be attributed to the phosphate groups in the HAp lattice. The adsorption of fibrinogen reveals itself in the amide-I band at 1650 cm–1 for a  stretching vibration and in the amide-II band at 1550 cm–1 for an in-plane N–H bending and a C–H stretching vibration. These findings are consistent with our previous report [30]. After removing fibrinogen, we could observe the phosphate bands, indicating that the HAp nanocrystals were still bound to the gold surface. While repeating fibrinogen adsorption and removing fibrinogen with the APM treatment, the amide I and II bands were detected because of the existence of some fragments of fibrinogen. The band at 1750 cm−1 was observed after the APM treatment and is attributed to the
  stretching vibration of the decomposed peptide fragments [12]. This suggests that the APM treatment is not effective in the removal procedure. In contrast, no amide I and II bands were observed after the UV, UV/APM and APM/UV treatments.
Figure 5.
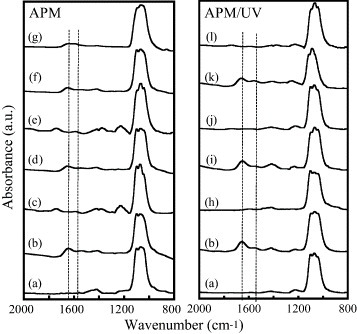
FTIR spectra of the (a) as-prepared HAp sensor; (b) fibrinogen adlayer on the as-prepared HAp sensor; HAp sensors with adsorbed fibrinogen after one to five cycles of (b–g) APM and (h–m) APM/UV treatments. Curves (c, e, g, h, j and l) correspond to the treated HAp sensor, and curves (d, f, i and k) to the fibrinogen adlayer on the reused HAp sensor.
Figure 6 shows typical ΔD versus Δfn=3/3 plots of fibrinogen adsorption on (a) the as-prepared HAp sensor, and of repeated fibrinogen adsorption for one to ten cycles of (b) APM, (c) UV, (d) UV/APM and (e) APM/UV treatments. The APM treatment decreased both the frequency shift and the saturated ΔD/(Δfn=3/3) value at 60 min to –67.7±7.5Hz and (–10.5±1.3)×10−8 Hz−1, respectively, in the tenth cycle. It did not change the surface wettability; however, the amount of adsorbed protein was decreased. This result can be explained as either some fragments of hydrolyzed fibrinogen or by nonreactive H2O2 remaining on the surface and occupying the adsorption sites on the HAp nanocrystals. This interpretation is supported by the FTIR results. The UV treatment also decreased the frequency shift to –76.3 Hz in the tenth cycle because of the change in surface wettability to hydrophilic, while the saturated ΔD/(Δfn=3/3) values were almost constant with the cycle number at (–17.2±0.7)×10−8 Hz−1. The protein adsorption behavior generally depends on the surface wettability; therefore, we conclude that the hydrophilic surface prevented the adsorption of proteins [40]. The UV/APM and APM/UV treatments did decompose fibrinogen. However, the UV/APM treatment decreased the frequency shift and the saturated ΔD/(Δfn=3/3) values in the tenth cycle to –80.7±3.2 Hz and (–6±2)×10−8 Hz−1, respectively. The APM/UV treatment was most efficient for the decomposition of fibrinogen and for the reproducibility of protein adsorption on the HAp sensors, indicating the importance of the order of applying the APM and UV treatments. The saturated ΔD/(Δfn=3/3) values were consistent for all cycles. Although further experiments are required to evaluate the differences in protein adsorption after these treatments, note that the change in the hydrophilic property of the HAp surface did not affect the three-dimensional configuration of the adsorbed proteins.
Figure 6.
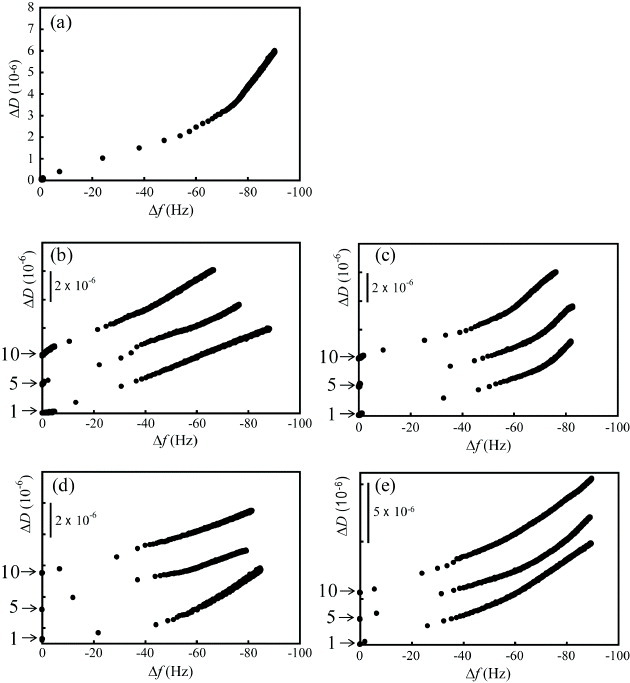
Typical ΔD versus Δfn=3/3 plots of fibrinogen adsorption on (a) as-prepared HAp sensor, and of repeated fibrinogen adsorption/desorption on the sensor subjected to up to ten cycles of (b) APM, (c) UV, (d) UV/APM and (e) APM/UV treatments. The default value of ΔD is zero.
Figure 7 shows AFM images of the HAp sensor before and after the APM/UV treatment. The RMS values over an area of 1.0×1.0 μm2 are 4.4±0.8 nm for 1 cycle, 4.7±0.5 nm for 3 cycles, 4.5±0.7 nm for 5 cycles and 4.3±0.8 nm for 10 cycles. These results suggest that the APM/UV treatment did not alter the surface morphology.
Figure 7.
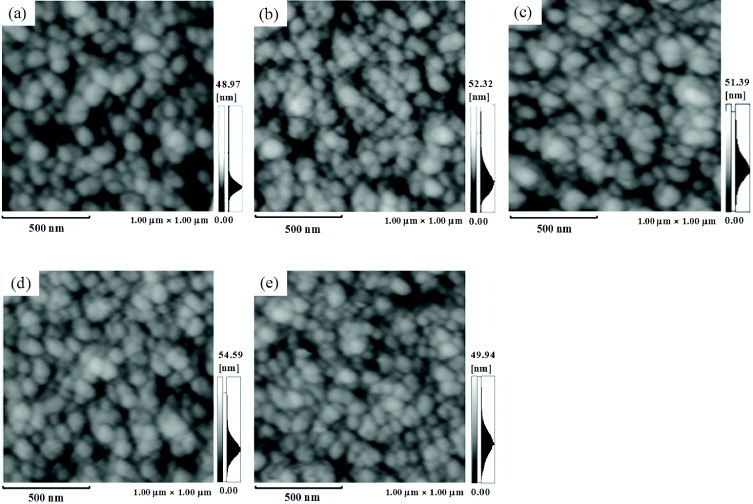
AFM topographical images (1 ×1 μm2) of the HAp sensor subjected to (a) 0, (b) 1, (c) 3, (d) 5 and (e) 10 cycles of APM/UV treatment.
We have further clarified the effects of FBS adsorption and removal in the HAp sensors using treatments with APM/UV and an ionic surfactant SDS. The adsorption behavior of FBS in different solvents was described in detail in [41]. In brief, the amount of adsorption of FBS in PBS on the HAp sensors was twice that when the minimum essential medium was used as a cell culture buffer because of the adsorption of the phosphate or carbonate ions on the HAp surface.
Figure 8 shows typical Δfn=3/3 and ΔD time evolutions for the adsorption of FBS on the HAp sensors with the SDS treatment. The FBS adsorption caused a rapid decrease in the Δf and ΔD within 2 min. Most FBS was adsorbed on the HAp nanocrystals, as in the case of fibrinogen adsorption, in less than 2 min with a rapid frequency decrease of –49.9 ± 2.8 Hz (0.88 ± 0.05 μg cm–2) and the adsorption continued up to 60 min with a corresponding shift of −50.3± 2.5 Hz (0.89 ±0.04 μg cm–2). The ΔD versus Δfn=3/3 plots (data not shown) also reveal a rapid increase stop within 2 min, and the saturated ΔD/(Δfn=3/3) value was (–5.6 ± 2.2)×10–8 Hz−1. The combination of SDS and αMEM flushing was conducted twice. The Δf was reduced to approximately –18 Hz by the SDS treatment and restored after αMEM flushing. The subsequent FBS adsorption decreased the Δf, and the corresponding amount of adsorbed FBS was smaller than that in the first adsorption run. The insufficient removal of FBS by the SDS treatment alone led to the strong adsorption of SDS on HAp surfaces [37], i.e. the exchange reaction between SDS and FBS did not occur. We conclude that the SDS treatment was not effective in removing the proteins adsorbed on the HAp nanocrystals.
Figure 8.
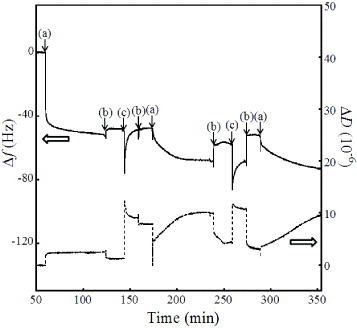
Typical Δfn=3/3 and ΔD time evolutions for the adsorption of FBS on HAp sensors with the SDS treatment. The arrows indicate the injection of (a) FBS in αMEM, (b) αMEM and (c) SDS solution.
Figure 9 shows the ΔD versus Δfn=3/3 plots for the FBS adsorption on the as-prepared HAp sensors and the repetitive FBS adsorption behavior on the APM/UV-treated HAp sensors. The FBS adlayer on the HAp sensor had a constant contact angle of 61±4° up to the third cycle. A slight increase in the adsorbed protein mass was observed via a frequency shift of less than 5 Hz. The complete removal of FBS was also confirmed from FTIR measurements (data not shown). The saturated ΔD/(Δfn=3/3) value at 60 min was the same as that for three cycles of FBS adsorption. The FBS contains various acidic proteins such fibrinogen, bovine serum albumin, fibronectin and laminin, as well as immunoglobulin G. These proteins were successfully removed by the APM/UV treatment, which we consider the most efficient removal method for the HAp sensors.
Figure 9.
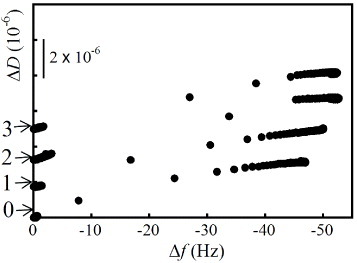
ΔD versus Δfn=3/3 plots for FBS adsorption on as-prepared HAp sensors and the repetitive FBS adsorption behavior on APM/UV-treated HAp sensors. The default value of ΔD is zero.
Conclusion
We investigated the reusability of the HAp sensors and the reproducibility of their measurements for the adsorption of fibrinogen or FBS proteins after removal procedures that included APM, UV and SDS treatments as well as their combinations. The adsorption behavior of fibrinogen depended on the removal method; in the first cycle of every treatment, the rate of fibrinogen adsorption decreased because the sensor surface became hydrophilic. The AMP and SDS treatments were not efficient in removing the proteins or their fragments from the HAp. The UV treatment decreased the amount of adsorption because the surface became hydrophilic. The UV/APM treatment retained the frequency change in the sensor, but decreased the viscoelasticity of the adsorbed proteins. The APM/UV treatment resulted in reproducible adsorption and the complete removal of proteins, and we consider it to be the most efficient procedure for removing proteins from the HAp sensor.
References
- Rodahl M, Höök F, Krozer A, Kasemo B. and Brzezinski P. Rev. Sci. Instrum. 1995;66:3924. doi: 10.1063/1.1145396. [DOI] [Google Scholar]
- Höök M, Rodahl M, Brzezinski P. and Kasemo B. J. Colloid Interface Sci. 1998;208:63. doi: 10.1006/jcis.1998.5774. [DOI] [PubMed] [Google Scholar]
- Höök F, Kasemo B, Nylander T, Fant C, Sott K. and Elwing H. Anal. Chem. 2001;73:5796. doi: 10.1021/ac0106501. [DOI] [PubMed] [Google Scholar]
- Höök F. et al 2002. Colloids Surf. B 24 155 10.1016/S0927-7765(01)00236-3 [DOI] [Google Scholar]
- Karlsson R. Anal. Biochem. 1994;221:142. doi: 10.1006/abio.1994.1390. [DOI] [PubMed] [Google Scholar]
- Pei R J, Cui X Q, Yang X R. and Wang E K. Talanta. 2000;53:481. doi: 10.1016/S0039-9140(00)00495-1. [DOI] [PubMed] [Google Scholar]
- Reimhult E, Larsson C, Kasemo B. and Höök F. Anal. Chem. 2004;76:7211. doi: 10.1021/ac0492970. [DOI] [PubMed] [Google Scholar]
- Kern W. and Puotinen D A. RCA Rev. 1970;31:187. [Google Scholar]
- van der Meerakker J E A M. and van der Straaten M H M. J. Electrochem. Soc. 1990;137:1239. doi: 10.1149/1.2086639. [DOI] [Google Scholar]
- Yamamoto K, Nakamura A. and Hase U. IEEE Trans. Semicond. Manuf. 1999;12:288. doi: 10.1109/66.778192. [DOI] [Google Scholar]
- Hiroki A and LaVerne J A. 2005. J. Phys. Chem. B 109 3364 10.1021/jp046405d [DOI] [PubMed] [Google Scholar]
- Stadtman E R. and Levine R L. Amino Acids. 2003;25:207. doi: 10.1007/s00726-003-0011-2. [DOI] [PubMed] [Google Scholar]
- Bolon D A. and Kunz C O. Polym. Eng. Sci. 1972;12:109. doi: 10.1002/pen.760120206. [DOI] [Google Scholar]
- Sowell R R, Cuthrell R E, Mattox D M. and Bland R D. J. Vac. Sci. Technol. 1974;11:474. doi: 10.1116/1.1318658. [DOI] [Google Scholar]
- Vig J R. 1985. J. Vac. Sci. Technol. A 3 1027 10.1116/1.573115 [DOI] [Google Scholar]
- Ye T, McArthur E A and Borguet E. 2005. J. Phys. Chem. B 109 9927 10.1021/jp0474273 [DOI] [PubMed] [Google Scholar]
- Lunts A C. J. Chem. Phys. 1980;72:1143. doi: 10.1063/1.440266. [DOI] [Google Scholar]
- Weerawardena A, Drummond C J, Caruso F. and McCormick M. Langmuir. 1998;14:575. doi: 10.1021/la971076k. [DOI] [Google Scholar]
- Payet V, Brunner S, Galtayries A, Frateur I. and Marcus P. Surf. Interface Anal. 2008;40:215. doi: 10.1002/sia.2655. [DOI] [Google Scholar]
- Yunoki S, Ikoma T, Monkawa A, Ohta K. and Tanaka J. J. Nanosci. Nanotechnol. 2007;7:818. doi: 10.1166/jnn.2007.504. [DOI] [PubMed] [Google Scholar]
- Letic-Gavrilovic A, Piattelli A. and Abe K. J. Mater. Sci.-Mater. Med. 2003;14:95. doi: 10.1023/A:1022099208535. [DOI] [PubMed] [Google Scholar]
- Liao S S. and Cui F Z. Tissue Eng. 2004;10:73. doi: 10.1089/107632704322791718. [DOI] [PubMed] [Google Scholar]
- Yunoki S, Ikoma T, Monkawa A, Ohta K, Kikuchi M, Sotome S, Shinomiya K. and Tanaka J. Mater. Lett. 2006;60:999. doi: 10.1016/j.matlet.2005.10.064. [DOI] [Google Scholar]
- Kim H W, Knowles J C and Kim H E. 2005. J. Biomed. Mater. Res. B 74 686. [DOI] [PubMed] [Google Scholar]
- Mizushima Y, Ikoma T, Tanaka J, Hoshi K. and Ishihara T. J. Controlled Release. 2006;110:260. doi: 10.1016/j.jconrel.2005.09.051. [DOI] [PubMed] [Google Scholar]
- Ikoma T, Tonegawa T, Watanabe H, Chen G P, Tanaka J. and Mizushima Y. J. Nanosci. Nanotechnol. 2007;7:822. doi: 10.1166/jnn.2007.523. [DOI] [PubMed] [Google Scholar]
- Yongli C, Xiufang Z, Yandao G, Nanming Z, Tingying Z. and Xinqi S. J. Colloid Interface Sci. 1999;214:38. doi: 10.1006/jcis.1999.6159. [DOI] [PubMed] [Google Scholar]
- Ohta K, Monma H. and Takahashi S. J. Biomed. Mater. Res. 2001;55:409. doi: 10.1002/1097-4636(20010605)55:3<409::AID-JBM1030>3.0.CO;2-Z. [DOI] [PubMed] [Google Scholar]
- Kandori K, Miyagawa K. and Ishikawa T. J. Colloid Interface Sci. 2004;273:406. doi: 10.1016/j.jcis.2004.01.069. [DOI] [PubMed] [Google Scholar]
- Monkawa A, Ikoma T, Yunoki S, Yoshioka T, Tanaka J, Chakarov D. and Kasemo B. Biomaterials. 2006;27:5748. doi: 10.1016/j.biomaterials.2006.07.029. [DOI] [PubMed] [Google Scholar]
- Yoshioka T, lkoma T, Monkawa A, Tonegawa T, Chakarov D, Kasemo B, Hanagata N. and Tanaka J. Key Eng. Mater. 2008;361–363:1119. doi: 10.4028/www.scientific.net/KEM.361-363.1119. [DOI] [Google Scholar]
- Ikoma T, Tagaya M, Hanagata N, Yoshioka T, Chakarov D, Kasemo B. and Tanaka J. J. Am. Ceram. Soc. 2009;92:1125. doi: 10.1111/j.1551-2916.2009.02957.x. [DOI] [Google Scholar]
- Langford J, Pavey K D, Olliff C J, Cragg P J, Hanlon G W, Paul F. and Rees G D. The Analyst. 2002;127:360. doi: 10.1039/b109684m. [DOI] [PubMed] [Google Scholar]
- Bose S. and Saha S K. Chem. Mater. 2003;15:4464. doi: 10.1021/cm0303437. [DOI] [Google Scholar]
- Koumoulidis G C, Katsoulidis A P, Ladavos A K, Pomonis P J, Trapalis C C, Sdoukos A T. and Vaimakis T C. J. Colloid Interface Sci. 2003;259:254. doi: 10.1016/S0021-9797(02)00233-3. [DOI] [PubMed] [Google Scholar]
- Lim G K, Wang J, Ng S C. and Gan L M. J. Mater. Chem. 1999;9:1635. doi: 10.1039/a809644i. [DOI] [Google Scholar]
- Shimabayashi S, Tanaka H. and Nakagaki M. Chem. Pharm. Bull. 1986;34:4474. doi: 10.1248/cpb.37.2514. [DOI] [PubMed] [Google Scholar]
- Ikoma T, Yamazaki A, Nakamura S. and Akao M. J. Solid State Chem. 1999;144:272. doi: 10.1006/jssc.1998.8120. [DOI] [Google Scholar]
- Sauerbrey G. Z. Phys. 1959;155:206. doi: 10.1007/BF01337937. [DOI] [Google Scholar]
- Jonsson M and Johansson H O. 2004. Colloids Surf. B 37 71 10.1016/j.colsurfb.2004.06.010 [DOI] [PubMed] [Google Scholar]
- Tagaya M, Ikoma T, Migita S, Okuda M, Takemura T, Hanagata N, Yoshioka T and Tanaka J. 2010. Mater. Sci. Eng. B 173 176 10.1016/j.mseb.2010.01.034 [DOI] [Google Scholar]


