Abstract
The concentration of salivary secretory immunoglobulin A (sIgA) is a well-known stress marker for humans. The concentration of salivary sIgA in dogs has also been reported as a useful stress marker. In addition, salivary sIgA in dogs has been used to determine the adaptive ability of dogs for further training. There are conventional procedures based on enzyme-linked immunosorbent assay (ELISA) for measuring salivary sIgA in dogs. However, ELISA requires long assay time, complicated operations and is costly. In the present study, we developed an immunochromatographic assay for measuring salivary sIgA in dogs using a dilution buffer containing a non-ionic surfactant. We determined 2500-fold dilution as the optimum condition for dog saliva using a phosphate buffer (50 mM, pH 7.2) containing non-ionic surfactant (3 wt% Tween 20). The results obtained from the saliva samples of three dogs using immunochromatographic assay were compared with those obtained from ELISA. It was found that the immunochromatographic assay is applicable to judge the change in salivary sIgA in each dog. The immunochromatographic assay for salivary sIgA in dogs is a promising tool, which should soon become commercially available for predicting a dog's psychological condition and estimating adaptive ability for training as guide or police dogs.
Keywords: immunochromatographic assay, secretory immunoglobulin A (sIgA), nonionic surfactant, gold nanoparticles, stress marker
Introduction
Immunochromatographic assays that are in wide-spread use for pregnancy and influenza tests are one of the promising tools for the development of easy-handling biosensors. The rapid observation of results directly by the naked eye and the utilization of a membrane strip as the immunosorbent, have provided a unique analytical platform that permits one-step, rapid and low-cost analysis [1–4]. In the immunochromatographic assay, the ligands such as antibodies are immobilized on the carrier gold nanoparticles. The analytical signals are observed after the specific interaction of antigen–antibody reaction. The specific interaction takes place on membrane by capillary action of the medium. Generally, on the membrane, the sandwich assay is achieved between the antigen, the secondary antibodies conjugated with gold nanoparticle and the primary antibodies immobilized on the membrane. After the antigen–antibody reaction, a red color appears, caused by the accumulation of gold nanoparticles at the test line and control line on the membrane. Gold nanoparticles are more stable and easier to use than the conventional systems utilizing fluorescence or enzymatic labels. Moreover, nanoscale surfaces of gold nanoparticles are appropriate for accelerating the antibody–antigen recognitions that enhances the immunoassay signals [5–7].
Salivary secretory immunoglobulin A (sIgA) plays an important role in mucosal immunity and the sIgA has been proven as an objective and sensitive marker of stress in humans [8–11]. Saliva samples are readily obtained without causing distress to the individuals and only a little volume of sample is required. In dogs, salivary sIgA has also been suggested as a useful stress marker [12]. In addition, adaptive ability of police dogs was associated with sIgA levels [13]. The sIgA concentration was also useful for estimating the adaptive ability of guide dogs [14].
In the present study, we report a gold nanoparticle based immunochromatographic assay for measuring salivary sIgA in dogs. We also determined the optimum dilution ratio for the buffer containing a non-ionic surfactant. Normally, the concentrations of sIgA have been determined using ELISA. However, ELISA requires a long assay time, complicated operations and is costly. The immunochromatographic assay for detecting sIgA in dogs is a promising tool for reducing cost and time of measuring sIgA levels and understanding the dog's psychological conditions. The research in our laboratory is in progress to bring this assay into the commercial market.
Materials and methods
Materials
Polyclonal anti-dog IgA (Pab-Dog IgA), dog IgA ELISA quantitation kit and dog reference serum containing 1.5 mg ml−1 IgA were purchased from BETHYL laboratories Inc. (TX, USA). Polyclonal anti-mouse IgG for the control line of the immunochromatographic test strip was purchased from DakoCytomation (Glostrup, Denmark). Gold nanoparticles for labeling the antibodies were purchased from Tanaka Kikinzoku Kogyo (Tokyo, Japan). High-flow nitrocellulose membrane (HF135) and absorption pad were purchased from Nihon Millipore K.K. (Tokyo, Japan). For collecting of the saliva samples, cotton was purchased from Hakuzou Medical Corporation (Osaka, Japan). For fabrication of the immunochromatographic assay system, Na2HPO4, NaH2PO4·2H2O, sucrose, polyethylene glycol (PEG), and potassium dihydrogen phosphate (KH2PO4) were purchased from Wako Pure Chemical Industries (Osaka, Japan). Bovine serum albumin (BSA) for blocking on antibody immobilized nitrocellulose membrane was purchased from Sigma Aldrich Japan, (Tokyo, Japan). Sodium azide (NaN3) was purchased from Nakarai Tesque (Kyoto, Japan) for preserving the proteins in blocking and diluting solutions.
Apparatus
The dispensing system (Biojet Quanti 300) for the immobilization of the antibody on the nitrocellulose membrane was purchased from BioDot, Inc. (CA, USA). A table-top ultrasonic cleaner (Model 2510) for the dispersion of gold nanoparticles was purchased from Branson Ultrasonics Corporation (CT, USA). After the immunochromatographic assay, the color intensity of images at the test line was scanned using a Canonscan 4400F from Canon, Inc. (Tokyo, Japan). The scanned images were then converted into gray-scale readings by Adobe Photoshop Elements 6. The intensities of each signal were quantified using Image SMX vol 1.74. The plate reader EL800 for ELISA was purchased from Biotek Instruments, Inc (VT, USA).
Preparation of gold nanoparticle conjugated Pab-Dog IgA
Pab-Dog IgA solution at 50 μg ml−1 was prepared by diluting with 50 mM KH2PO4 buffer (pH 7.5) and the final volume was 250 μl. The diluted Pab-Dog IgA solution at 200 μl was added to a 1.8 ml colloidal solution of gold nanoparticle (40 nm in diameter, 0.0065 wt%) and mixed immediately. The mixture was kept for 10 min at room temperature for the immobilization of antibodies onto the surface of gold nanoparticles by the physical adsorption. After immobilization, 100 μl of 1 wt% PEG, which was dissolved in 50 mM KH2PO4 buffer (pH 7.5), and 200 μl of 10 wt% BSA, which was also dissolved in 50 mM KH2PO4 buffer (pH 9.0), were added to block the surfaces of non-coated gold nanoparticles. After the immobilization and blocking procedure, gold nanoparticle conjugated Pab-Dog IgA was separated by a centrifugal operation (12 000 g for 15 min at 4 °C). The obtained pellet was pulse-sonicated for a few seconds and was added to 2 ml of preserving solution (1 wt% BSA, 0.05 wt% PEG 20 000 and 150 mM NaCl in 20 mM Tris–HCl buffer, pH 8.2). After mixing, gold nanoparticle conjugated Pab-Dog IgA was collected by the same process as described above. After pulse sonication, the gold nanoparticle conjugated Pab-Dog IgA were suspended in preserving solution and the absorbance was adjusted to optical density at 520 nm O.D.520=6.
Preparation of immunochromatographic test strip
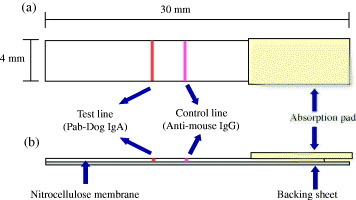
Pab-Dog IgA solution at 1 mg ml−1 was prepared by diluting with 50 mM phosphate buffered saline (pH 7.2). For the immobilization at the test line on nitrocellulose membrane, the Pab-Dog IgA solution of 650 μl was mixed with 20 wt% sucrose solution diluted with 50 mM KH2PO4 buffer (pH 7.5) of 50 μl and 50 μl of 2-propanol. For the preparation of the control line, 40 μl of polyclonal anti-mouse IgG was mixed with both 60 μl of 2-propanol and 1100 μl of 50 mM KH2PO4 buffer (pH 7.5). The Pab-Dog IgA solution and the polyclonal anti-mouse IgG solution were applied to the nitrocellulose membrane by using dispensing system. After drying for 1 h at room temperature, the membrane was blocked against the non-specific protein adsorption by immersing in 50 mM boric acid solution containing 0.5% casein (pH 8.5) and incubating for 30 min at room temperature. Then, the blocked membrane was washed by immersion in 5.0 mM phosphate buffer (pH 7.5) containing 0.01 wt% sodium dodecyl sulfate for 30 min at room temperature. After drying the membrane overnight, the membrane was prepared on a backing sheet, and absorbent pad was pasted. The membrane was cut into individual strips (4.0 mm strip−1), using a guillotine cutting system (figure 1).
Figure 1.

Schematic representation of the immunochromatographic test strip. (a): top view, (b): cross-section.
Collection of saliva samples from dogs
Dogs from the training course at the Okayama University of Science Specialized Training College were used as test subjects. We obtained saliva samples from all of 18 dogs in the college. The species of the dogs were one Golden Retriever, three Labrador Retrievers, three Border Collies, German Shepherd Dog, Shiba Inu of two-year-old or less, two Labrador Retrievers, Beagle, Schnauzer, Shetland Sheepdog, three Pembroke Welsh Corgis and Japanese Spitz of one-year-old or less. The dogs were led by a wall-regulated hours system to feed and give a run. We collected the dog's saliva every Monday morning (10:00 AM) and afternoon (2:00 PM) for three weeks. The dog's saliva samples were collected with a cotton swabs. We modified the collecting procedure of a previous article [12]. The cotton swab with diameter ∼3 cm was placed on dog's cheek pouch and wiped gently. Upon removal, the absorbent cotton swab was placed immediately in a pipette tip (5 ml) and the saliva was extracted by centrifugation at 2500 g for 15 min at room temperature. The saliva samples were stored at −20 °C for the analysis. Salivary sIgA concentration of all samples was determined using ELISA. All the results are expressed in ELISA units (EU), where the concentration of the serum IgA (1 mg ml−1) was defined as 100 EU ml−1.
Evaluation of the diluted saliva solutions
Two types of diluted saliva solutions were tested to measure the dog sIgA using the immunochromatographic test strip. Dog reference serum containing 1.5 mg ml−1 IgA was diluted at 50 ng ml−1 with 50 mM phosphate buffer (pH 7.2) or the phosphate buffer containing 3 wt% Tween 20. The dog saliva containing about 100 EU ml−1 sIgA was also diluted 2500-fold with 50 mM phosphate buffer (pH 7.2) or the phosphate buffer containing 3 wt% Tween 20. Gold nanoparticle conjugated Pab-Dog IgA at 6 μl and the diluted reference serum or dog saliva at 40 μl were mixed together in a dry microtiter plate. Each of the mixed solutions was then absorbed into the immunochromatographic test strip using the capillary force. The intensity of red color, which was produced by the accumulation of the gold nanoparticle conjugated Pab-Dog IgA on the test line, was scanned and processed as described in the Apparatus section. The scanned images were converted into gray-scale readings. The intensity of each test line was measured by an image analyzer.
Determination of saliva dilution rate
Dog's saliva containing about 100 EU ml−1 sIgA was diluted at different rates (500, 1000, 2000, 2500 and 3000) with 50 mM phosphate buffer containing 3 wt% Tween 20. The dilution rate was determined with the intensity of red color of the test line. The intensity was also measured using the same procedure as described above for the evaluation of the diluted saliva solution.
Comparison of the immunochromatographic test strip results with ELISA
The concentration of salivary sIgA in dogs was confirmed with the well-described ELISA. The saliva samples from three dogs containing different concentrations of sIgA were measured with the immunochromatographic test strip. The evaluation of the immunochromatographic test strip for dog salivary sIgA was performed following the same procedure as described above for the evaluation of the diluted saliva solution. The intensity measurements of the test line on the strips were compared with the results obtained from ELISA.
Results and discussion
Evaluation of the diluted saliva solution
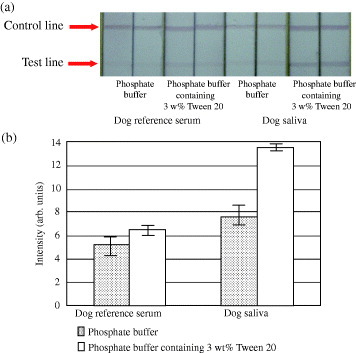
We measured dog reference serum and dog's saliva with immunochromatographic test strip to evaluate the effect of dilution on different samples. The intensity of red color at the test line was clear, when the dilutions were carried out using 50 mM phosphate buffer containing 3 wt% Tween 20 for serum and saliva (figure 2). We also used diluted the phosphate buffer with 5 or 10 wt% Tween 20; the red color of test line became stronger than the one observed using the phosphate buffer with 3 wt% Tween 20. When negative control solution of 50 mM phosphate buffer with 5 or 10% Tween 20 was measured, we could observe a very light red color at the test line as background (data not shown). However, the background of test line could not be seen with negative control solution or saliva in diluted the phosphate buffer solution in the presence of 3 wt% Tween 20. This result was attributed to the decrease in the specificity of the antibody in the presence of excess non-ionic surfactant. Therefore, the red color at the test line was anticipated due to the accumulation of gold nanoparticles. We have already proposed a new enhancing method for immunochromatographic assay to immobilize a very small volume of gold nanoparticles that does not cause red color at test line [6]. Only a negligible amount of gold nanoparticles might accumulate at the test line, while using the diluted the phosphate buffer with 3 wt% Tween 20, and enhance the intensity of the red color. From these results, we decided to use the diluted buffer of 50 mM phosphate buffer in the presence of 3 wt% Tween 20.
Figure 2.

Image of the test line for sIgA in dog reference serum and dog saliva. Results obtained from an immunochromatographic test strip treated with buffers of different dilution (a). Intensity of the test line for sIgA in reference serum and saliva with buffers of different dilution (b). Error bars indicate the standard deviations (n = 3).
Determination of the saliva dilution rate
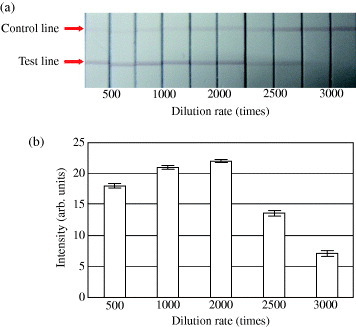
The saliva samples at some dogs, containing about 100 EU ml−1 sIgA and diluted at rates (500, 1000, 2000, 2500 and 3000) with 50 mM phosphate buffer containing 3 wt% Tween 20, were measured using our immunochromatographic test strip (figure 3). The decrease of intensity for 500-fold dilution might be caused by the use of polyclonal antibodies. Previously, it was reported that the concentration of salivary sIgA in dogs for estimating their adaptive ability was determined as 90 EU ml−1 [14]. The red color at the test line appeared too deep at around 90 EU ml−1 sIgA when diluted less than 2500-fold. On the other hand, we observed that the red color was too light when the saliva samples were diluted 3000-fold. We also applied our immunochromatographic test strip for measuring human salivary sIgA using the polyclonal anti-human IgA, and determined the optimum dilution rate with 50 mM phosphate buffer containing 3 wt% Tween 20. The optimum dilution rate for human saliva samples was ∼2000-fold (data not shown). Then, we proposed the optimum dilution ratio of 2500-fold for dog saliva.
Figure 3.

Effect of dilution rate on color intensity. Results obtained from an immunochromatographic test strip treated with diluted saliva (a). Intensity for diluted dog sIgA under different dilutions (b). Error bars indicate the standard deviations (n= 3).
Evaluation of immunochromatographic test strip for sIgA using dog saliva
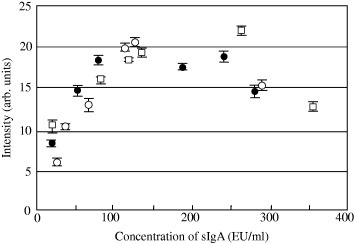
The concentrations of salivary sIgA in all dog saliva samples were measured by ELISA. Salivary sIgA had a wide range of concentration in each dog. German et al [15] have already reported the difference of sIgA concentration in each dog. We could see the fluctuations of sIgA concentrations between morning and afternoon, however, the concentration of sIgA in each dog differed negligibly between sampling days. The concentration of sIgA from only three dogs (Labrador Retrievers of one year or less and two years or less, German Shepherd Dog of two years or less) differed between sampling days. Those dogs had a long period during the sampling, and they showed no vigor. They were apparently stressed. Therefore, the precise values obtained from ELISA for the three dogs were compared with the intensities of red color at the test line of our immunochromatographic test strip for evaluation (figure 4). The intensity of red color at the test line increased up to around 140 EU ml-1. However, the intensity differed a little nearly at the same concentration for each dog. The difference of intensity at close concentrations might have occurred due to a negligible amount of influence of non-specific binding in saliva samples of each dog. Immunochromatographic assay is different from ELISA, and there is no washing step to eliminate the non-specific binding antibody. Therefore, it is difficult to avoid the influences and measure accurate value. However, we could clearly observe the change of responses with salivary sIgA (20–140 EU ml−1) for each dog. The intensity in this study decreased with increasing sIgA concentration above ∼140 EU ml−1. This was attributed to the fact that the polyclonal antibody was used for the immunochromatographic test strip. The excess amount of sIgA, that bound with the antibody conjugated gold nanoparticles, proceeded more rapidly on the nitrocellulose membrane in comparison with the large molecular weight of gold nanoparticle conjugated Pab-Dog IgA and sIgA complex. Thus, the sIgA bound to the antibodies immobilized on the test line, and the slowly approaching complex that displayed the red color was no longer able to react at the test line. Therefore, in spite of a high concentration of sIgA, the intensity of red color at the test line decreased. If two kinds of monoclonal antibodies were bound with different sites of sIgA or an excess amount of gold nanoparticle conjugated Pab-Dog IgA were used, the decrease in the intensity of the red color should not have been seen. We also evaluated our immunochromatographic test strip at dilution ratio of 3000 for the dog saliva samples. The intensity of the red color at the test line increased up to around 190 EU ml−1. The decrease in the red color intensity could not be observed at higher concentrations, moreover, the red color at the test line could not be observed at ∼20 EU ml−1 sIgA. We could not judge the difference between the color intensities of the background and 4 with naked eyes. As a result, the analytical range of the immunochromatographic test strip was determined as 20–140 EU ml−1 for sIgA in dog saliva samples.
Figure 4.

Dependence of sIgA concentration on color intensity at the test line in each dog. •: Labrador Retriever aged ⩽1 year, ○: German Shepherd aged ⩽2 years, □: Labrador Retriever aged 2 years or less. Error bars indicate the standard deviations (n= 3).
Conclusion
We have demonstrated an immunochromatographic assay for measuring sIgA in dogs. We determined the optimum dilution ratio to be 2500-fold for dog saliva using phosphate buffer (50 mM, pH 7.2) containing non-ionic surfactant (3 wt% Tween 20) in our measuring conditions. Under the optimum conditions, the limit of detection (LOD) for sIgA was 20 EU ml−1. We could judge the changes of each dog sIgA concentration between 20 and 140 EU ml−1, which wasimportant to estimate the adaptive ability for training the guide or police dogs. In this study, the intensity decreased with increasing sIgA concentration above around ∼140 EU ml−1 sIgA, however, the effect could be avoided while producing the commercial immunochromatographic assay. The commercial immunochromatographic assay will be appended to a conjugate pad containing dried excess volume of gold nanoparticle conjugated antibodies for a one-step analysis. Our results also provide know-how information to develop immunochromatographic assays for sIgA in humans and other animals. We suggest that our immunochromatographic assay for salivary sIgA in dogs will help understanding our pet's mood changes and also help estimating the adaptive ability of guide or police dogs. Thus, our assay is a promising candidate for entering the commercial market in the future.
Acknowledgment
We gratefully acknowledge Professor Kagan Kerman at the University of Toronto for reading our manuscript. This work was supported by Grant-in-Aid for Scientific Research (C) 20560731. The authors thank Jin Ishii for his excellent assistance in data collection.
References
- Paek S, Lee S, Cho H. and Kim Y. Methods. 2000;22:53. doi: 10.1006/meth.2000.1036. [DOI] [PubMed] [Google Scholar]
- Xiulan S, Xiaolian Z, Jian T, Zhou J. and Chu F S. Int. J. Food Microbiol. 2005;99:185. doi: 10.1016/j.ijfoodmicro.2004.07.021. [DOI] [PubMed] [Google Scholar]
- Sato I, Kojima K, Yamasaki T, Yoshida K, Yoshiike M, Takano S, Mukai T. and Iwamoto T. J. Immunol. Methods. 2004;287:137. doi: 10.1016/j.jim.2004.01.017. [DOI] [PubMed] [Google Scholar]
- Chiao D J, Shyu R H, Hu C S, Chiang H Y and Tang S S. 2004. J. Chromatogr. B 809 37 10.1016/j.jchromb.2004.05.033 [DOI] [PubMed] [Google Scholar]
- Nagatani N, Tanaka R, Yuhi T, Endo T, Kerman K, Takamura Y. and Tamiya E. Sci. Technol. Adv. Mater. 2006;7:270. doi: 10.1016/j.stam.2006.02.002. [DOI] [Google Scholar]
- Tanaka R, Yuhi T, Nagatani N, Endo T, Kerman K, Takamura Y. and Tamiya E. Anal. Bioanal. Chem. 2006;385:1414. doi: 10.1007/s00216-006-0549-4. [DOI] [PubMed] [Google Scholar]
- Nagatani N.et al2006NanoBiotechnology 279. 10.1007/BF02697262 [DOI] [Google Scholar]
- Deinzer R, Kleineidam C, Stiller-Winkler R, Idel H. and Bachg D. Int. J. Psychophysiol. 2000;37:219. doi: 10.1016/S0167-8760(99)00112-9. [DOI] [PubMed] [Google Scholar]
- Deinzer R. and Schuller N. Behav. Med. 1998;23:161. doi: 10.1080/08964289809596372. [DOI] [PubMed] [Google Scholar]
- Fahlman M M, Engels H J, Morgan A L. and Kololouri I. Int. J. Sports Med. 2001;22:127. doi: 10.1055/s-2001-11339. [DOI] [PubMed] [Google Scholar]
- Ring C, Drayson M, Walkey D G, Dale S. and Carroll D. Biol. Psychol. 2002;59:1. doi: 10.1016/S0301-0511(01)00128-4. [DOI] [PubMed] [Google Scholar]
- Kikkawa A, Uchida Y, Nakade T. and Taguchi K. J. Vet. Med. Sci. 2003;65:689. doi: 10.1292/jvms.65.689. [DOI] [PubMed] [Google Scholar]
- Skandakumar S, Stoduski G. and Hau J. Anim. Welf. 1997;4:339. [Google Scholar]
- Kikkawa A, Uchida Y, Suwa Y. and Taguchi K. J. Vet. Med. Sci. 2005;67:707. doi: 10.1292/jvms.67.707. [DOI] [PubMed] [Google Scholar]
- German A J, Hall E J. and Day M J. Vet. Immunol. Immunopathol. 1998;64:107. doi: 10.1016/S0165-2427(98)00132-9. [DOI] [PubMed] [Google Scholar]


