

Abstract
We have prepared all-biopolymer nanocomposite films using lignin as a filler and cellulose triacetate (CTA) as a polymer matrix, and characterized them by several analytical methods. Three types of lignin were tested: organosolv, hydrolytic and kraft, with or without acetylation. They were used in the form of nanoparticles incorporated at 1 wt% in CTA. Self-supported films were prepared by vapor-induced phase separation at controlled temperature (35–55 °C) and relative humidity (10–70%). The efficiency of acetylation of each type of lignin was studied and discussed, as well as its effects on film structure, homogeneity and mechanical properties. The obtained results are explained in terms of intermolecular filler-matrix interaction at the nanometer scale, for which the highest mechanical resistance was reached using hydrolytic lignin in the nanocomposite.
Keywords: self-supported films, nanocomposites, lignin, biopolymer
Introduction
The level of interest in producing biopolymer-based nanocomposites from renewable resources has increased recently in the framework of sustainable development, searching for environment-friendly technologies [1]. Cellulose is one of the preferred materials for preparing them, because it is abundant in nature and available from a large variety of sources [2, 3]. Among the various commercial cellulose derivatives, cellulose esters have been a major source for composite production owing to their thermoplastic character [4]. Nanofillers improve the stiffness, strength, toughness, thermal stability and barrier properties of the pure polymer matrix [5]. Only a few per cent (1–5%) of nanofiller, with a particle size smaller than 100 nm, is generally incorporated into the polymer to markedly enhance the material properties. Nanocomposites perform better than traditional composites because of the higher specific surface area of their filler [1].
One noteworthy application of cellulose esters is membrane production. Cellulose triacetate (CTA) is usually used for this purpose, but it has several disadvantages, namely low mechanical strength and poor resistance to oxidation, among others [6]. Several attempts were made to overcome these limitations, such as developing mixed matrix-composite membranes [7]. These materials have been obtained using two interpenetrated components: polymers—for mechanical properties and easy processing, and rigid, porous, inorganic filler—for sieving or adsorption properties [8–10]. For instance, cellulose esters have been tested for film preparation with activated carbon nanoparticles. Mechanical properties were improved by one order of magnitude, compared with those of pure acetylated cellulose films [11]. Good adhesion between phases was achieved, provided that dispersion was continuous and appropriate, and undesirable interactions, possibly leading to clogging of the dispersed phase by the polymer and/or loss of the matrix phase continuity, were minimized [12]. Both the homogeneity and integrity of membranes should be very sensitive to any modification of the interfacial regions. The surface chemistry of the filler should be considered to enhance its compatibility with the bulk polymer used as a nanocomposite matrix. Therefore, using biopolymers as fillers of cellulose derivatives is advantageous from the chemical viewpoint.
The development of biopolymer membranes for aqueous applications presents promising economic perspectives. As mentioned in a recent US study [13], the demand for membrane materials is expected to increase by 8.2% per year to $4.3 billion dollars in 2012, and further advances are predicted for ultrafiltration and reverse osmosis membranes. Biopolymer membranes will not present disposal problems such as those reported for materials not having a vegetal origin [14]. Lignin, of which more than 70 million tons per year are generated as a residue of chemical pulping [15], could be incorporated in acetylated cellulose for the production of hybrid materials [16].
Among the different available processes for extracting lignin from vegetal sources, organosolv and kraft pulping processes are particularly relevant. In the organosolv process, lignin is extracted with an organic solvent and water, usually in the presence of an acid catalyst. Advantages are that such lignin has a low molecular weight compared with lignin obtained from other processes and contains many reactive sites available for functionalization [17]. On the other hand, kraft pulping is the most used delignification process in the paper and cellulose industries [18]. Kraft lignin is a polydispersed, branched, biopolymer of high molecular weight. Finally, hydrolytic lignin is a heterogeneous product of acidic wood processing, which is composed of lignin itself (up to 88%), poly and monosaccharide residues, organic acids, resins, waxes, nitrogenous compounds, ashes and mineral acids that were not washed out after wood hydrolysis [19]. Consequently, hydrolytic lignin maintains an acidic character, unlike the two other types of lignin.
In this study, biopolymer-based nanocomposites were prepared using CTA as a matrix and lignin as a filler. Commercial lignin derived from the three aforementioned processes: kraft, organosolv or hydrolytic, was incorporated into CTA, and films were prepared by vapor induced-phase separation (VIPS) [20]. In VIPS, a vapor of a non solvent (usually water) is introduced into a polymer solution to generate phase separation and porosity. Water vapor can be drawn to the polymer solution by condensation due to evaporative cooling [21] or by the affinity of the solvent for water [22, 23]; and the former method has been used in this work. Because of the humidity inside the preparation chamber, water molecules can condense into the polymeric mixture. This phenomenon produces a non solvent effect, which allows polymer precipitation.
Previous studies have demonstrated some compatibility between cellulose derivatives and a modified lignin. Studies of melt-extruded and solvent-cast films made of hydroxyl propyl cellulose and a lignin revealed the presence of secondary interactions between the two components [24]. Lignin was found to reinforce the amorphous cellulose matrix, which forms an oriented mesophase structure, thus leading to a nanocomposite [25]. Abe et al [26] have recently reported high-strength nanocomposites based on a fibrillated chemi-thermomechanical pulp. Cellulose micro- and nanofragments were embedded in a lignin matrix by hot compression molding, and the resultant composites had a plastic like gloss on the surface and bending strengths as high as 220 MPa. Nevertheless, despite of the good mechanical properties, these materials were not based on esterified cellulose, which is more adequate for membrane synthesis.
In this work, the principal objective was to study lignin-CTA interaction in the preparation of self-supported films for potential membrane applications [27]. To increase the lignin affinity for cellulose ester, lignin was acetylated following the method of Thielemans and Wool [18]. These materials were evaluated and compared with their nonacetylated counterparts. The effects of esterification on the properties of the resultant nanocomposites were evaluated and analyzed.
Experimental details
Esterification procedure
Three commercial lignins (Sigma-Aldrich) were tested. The first one (KL or Indulin AT) is a purified form of kraft pine lignin obtained by the kraft pulping process. It is soluble in aqueous alkali, is hydrophilic and has a high phenol content (see figure 1(a)). The second lignin (OL) is obtained by organosolv pulping. This lignin has high purity, low molecular weight, low polydispersity and high solubility in organic solvents (see figure 1(b)). The third one, hydrolytic lignin (HL), is a heterogeneous product of wood processing with acid. HL is acidic (pH 2.0–4.0) and contains aromatic substances of both low and high molecular weight (see figure 1(c)).
Figure 1.
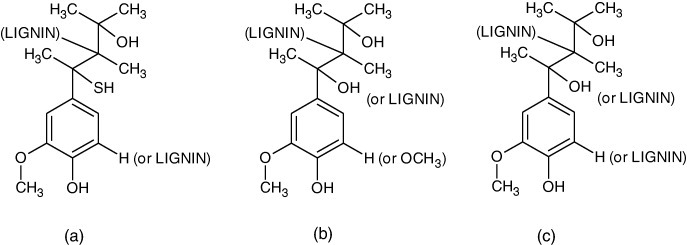
Chemical structures provided by the supplier (Sigma-Aldrich): (a) kraft lignin (b) organosolv lignin derived from hardwood by ethanolysis and (c) hydrolytic lignin.
Each lignin has been chemically modified by the esterification of its hydroxyl groups in order to both change the lignin solubility and increase the interaction with the polymer matrix in the nanocomposite. Acetylated kraft, organosolv and hydrolytic lignins were labeled as AKL, AOL and AHL, respectively. Esterification of each lignin sample (10 g) was performed using 4-dimethyl amino pyridine (0.5 g) as a catalyst. Acetic anhydride was added to lignin with a weight ratio of 2 : 1. The reaction was carried out under nitrogen atmosphere at 50 °C for 8 h [18]. The solubility of lignin in pure anhydride mostly depends on molecular weight. However, as the acetylation proceeded, all the samples became completely soluble in the reaction mixture. Solid acetylated kraft lignin was obtained by the addition of ethyl ether (10 ml), which quenched the reaction. In the case of AOL and AHL, a 1 : 2 cold water–methanol mixture was added to precipitate the lignin. Then, the residue was continuously washed with the water-methanol mixture, as reported elsewhere [18]. The aqueous phase was finally drained to completely remove the catalyst.
Lignin analysis
UV/Vis spectroscopy
The amount of free phenolic hydroxyl content was estimated from UV/Vis spectrometry [28], taking advantage of the fact that ionized phenolic groups in lignin absorb at 300 nm and the absorption follows the Beer–Lambert law. Ionized lignin was obtained in alkaline pH (11–12). Difference absorption spectra between ionized and non ionized samples were obtained, from which the OH content in each kind of lignin was calculated before and after esterification [29].
The measurements were performed with a Lambda 900 PerkinElmer UV/Vis spectrometer in the wavelength range of 200–400 nm, at a slit width of 1 nm and a scan velocity of 250 nm min−1. Spectra were acquired for all lignins in alkaline solutions. For that purpose, 0.015 g of lignin was dissolved in 30 ml of a water : dioxane mixture (weight ratio 1 : 2), which was then diluted with water. The pH was adjusted with an aqueous solution of sodium hydroxide.
Nuclear magnetic resonance (NMR)
All the experiments were performed with an NMR JEOL Eclipse 300+ spectrometer, at 300 MHz and 7.05 T, using sample tubes of 5 mm outer diameter. The analysis temperature was 25 °C, and the spectra were acquired with 16 accumulations and an acquisition time of 1.73 s. Raw and acetylated lignin samples (15 mg) were dissolved in 0.6 ml of deuterated dimethyl sulfoxide and 1H NMR spectra were recorded.
The measured chemical shifts, expressed in parts per million (ppm), were compared with tabulated values (see table 1) [30–32]. Aromatic proton signals (8–6.2 ppm) were used to normalize the spectra. The degree of esterification was determined from the ratio of the integral of the ester protons signal, specifically α-CH2, to that of methoxy protons −OCH3. Individual aromatic and aliphatic esters could not be separated due to insufficient signal discrimination, even when the number of scans was increased, as also observed elsewhere [33]. The signal of residual water was suppressed by the application of a presaturation pulse, i.e. of a low-power pulse at the solvent frequency.
Table 1.
NMR chemical shifts of selected protons.
| Structure or functional group | Chemical shift (ppm) |
|---|---|
| Aromatic H | 8.0–6.2 |
| Hα in CH2 Ester | 6.2–5.8 |
| -OCH3 | 4.2–3.6 |
| Aromatic acetate | 2.6–2.2 |
| Aliphatic acetate | 2.2–1.6 |
| TMS | 0.0 |
Fourier transform infrared spectroscopy (FTIR)
Measurements were performed with a PerkinElmer FTIR spectrometer equipped with a deuterated triglycine sulfate (DTGS) detector and a KBr beam splitter. The attenuated total reflectance (ATR) configuration was used, with a small amount of lignin, dispersed or dissolved in methylene chloride, deposited on the ATR crystal. A total of 25 scans were accumulated in transmission mode with a resolution of 2 cm−1.
Gel permeation–high performance liquid chromatography (GPC–HPLC) analysis
The GPC–HPLC system Alliance 2695 was used with an ultraviolet detector and a PL gel 5 MIXED-C 300×7.5 mm (Polymer Laboratories) column. This column (pore sizes of 104–105 Å) allowed the determination of molecular weights ranging from 0.2 to 2000 kDa. The column was operated at a flow rate of 1 ml min−1 and was calibrated with polystyrene standards.
Raw and acetylated lignin samples were dissolved in tetrahydrofuran (THF) with 0.1 M LiCl added for GPC (100 mg of lignin per 3 ml of THF/LiCl solution). LiCl was used to avoid the association of lignin molecules, even modified, which would significantly increase the measured weight-average molecular mass and polydispersity, and result in solvent-dependent molecular weights [34].
Transmission electron microscopy (TEM)
The transmission electron microscope JEOL CM 200 was used to observe the structure of lignin at an acceleration voltage of 200 kV. A drop of a dilute suspension (approximately 0.01 wt%) of lignin in methylene chloride was deposited on a carbon-coated grid and allowed to dry before observation. Image Pro Plus software from Media Cybernetics Inc. was used to analyze the particle size distribution of raw and acetylated lignins.
Nanocomposite synthesis
Nanocomposite membranes were prepared by solution casting using methylene chloride (Sigma-Aldrich) as a solvent. Relative humidity (RH) and temperature (T) were kept at 10, 30 or 70%, and 35, 45 or 55 °C using a controlled-humidity chamber (Shell Lab). Films were prepared either without or with 1 wt% lignin. In the latter case, CTA (Sigma-Aldrich) and lignin nanoparticles were separately dissolved in methylene chloride for 24 h and stirred at a controlled temperature (25 °C). The final solution concentrations were 3.3 wt% for CTA and 1% for lignins. Such lignin concentration was selected for better dispersion in CTA [11]. Afterwards, both solutions were mixed to obtain the casting liquid mixture, which was uniformly spread over a 14×19 cm2 glass dish.
Polymer precipitation was performed under controlled RH-T conditions for 2 h as mentioned above. Then, the samples were immersed in a water bath for 30 min. The films were finally removed from the Petri dishes, dried and stored under dry conditions at room temperature. In the following, the films are called CTA for pure cellulose triacetate and MXL or MAXL for composite films, where M means ‘membrane’, L is ‘lignin’, A is ‘acetylated’ and X stands for kraft (K), organosolv (O) or hydrolytic (H).
Nanocomposite analysis
Scanning electron microscopy (SEM)
The produced films were fractured in liquid nitrogen and metalized with gold (Denton Desk-II Gatan) for SEM characterization (JEOL JSM5800-LV). SEM images were taken at 15 kV, and each face and cross section of the films were observed at a 300× magnification.
Dynamic mechanical analysis (DMA)
Stress-strain tests of nanocomposites were carried out on a dynamic mechanical analyzer (DMA) RSA III from TA Instruments, equipped with a system for evaluating the tensile properties of thin films. Averaged elastic moduli for each of the 35 film samples were obtained from three repeated measurements. The temperature was maintained at 25 °C and the speed of traction was 5 μm s−1. All the samples had a length and a cross-sectional area of 8 mm and 0.384 mm2, respectively. The thickness was measured using a calibrated micrometer (Mitutoyo) with an accuracy of 5 μm.
Optical microscopy
The films were observed using the optical microscope Olympus SZ-CTV. Micrographs were taken from several sections of the membranes, at 50× magnification, before AFM analysis.
Atomic force microscopy (AFM)
The film samples were investigated without pretreatment in a Multimode Nanoscope IVa, Veeco Instruments microscope. Images were obtained in the tapping mode using a silicon tip (model TESP Veeco®). The scan rate was around 1 Hz. A feedback loop maintained a constant oscillation amplitude by moving the scanner vertically at every x,y data point. This movement was recorded as a topographical image. Image processing and determination of the root mean square roughness (Rrms) were carried out with the WSxM software [35].
Results and discussion
Chemical structure
The characterization and analysis of lignin are complex procedures because its structure and molecular weight depend on both its origin and the way it was separated from biomass [36, 37]. Phenolic hydroxyls are among the main reactive groups of lignin [38, 39]. Through acetylation, these groups are substituted to improve the hydrophobic character and solubility in organic solvents of the lignin used as filler in nanocomposites. Spectroscopy techniques such as UV/Vis, FTIR and NMR were used to characterize the structure and acetylation of lignins.
UV/Vis spectroscopy
The aromatic rings of lignin have characteristic π→π∗ electronic transitions; they result in a strong UV absorption at approximately 300–380 nm, from which the free phenolic hydroxyls can be quantified [40–42]. Lignin was treated as explained in section 2.1, and the results are shown in figures 2(a)–(c).
Figure 2.
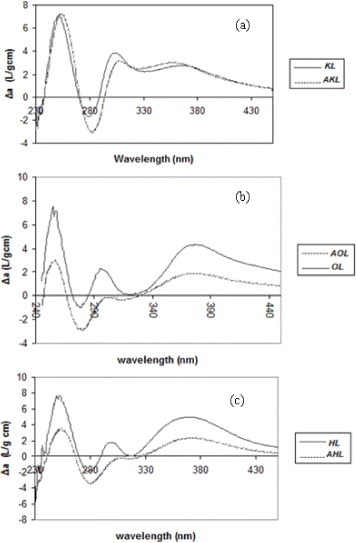
Difference in UV/Vis spectra between ionized and non ionized raw and acetylated lignins: (a) kraft lignin (b) organosolv lignin and (c) hydrolytic lignin.
The amount of OH groups, q (mmol g−1), was determined from the difference spectra using the equation:
where Δamax (l g−1 cm−1) is the difference in absorptivity between ionized and non ionized compounds, and Δε (l mol−1 cm−1) is the difference of molar absorptivity. Figure 3 shows unconjugated (type I) and conjugated phenolic structures (types II–IV) that may exist in lignin; they show a maximum of UV absorption within the ranges 298–300 and 320–380 nm, respectively.
Figure 3.
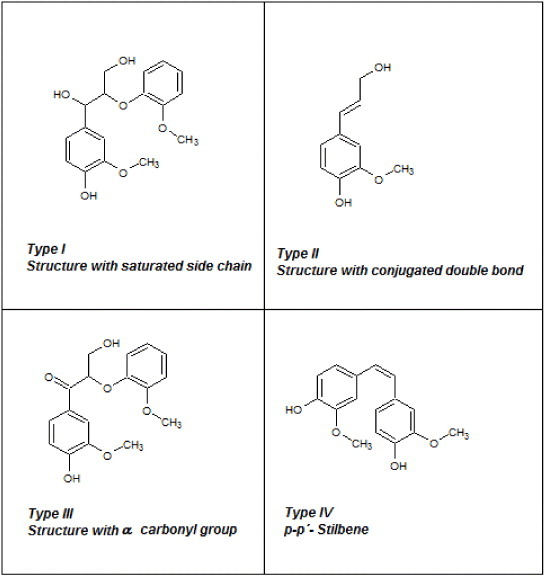
Possible phenolic structures of lignin.
The difference spectra shown in figure 2, presenting both the raw and acetylated lignins of each kind, have their Δamax at approximately 298 and 370 nm. According to Lin and Dence [16], these wavelengths correspond to type I and type IV phenolic structures, respectively. The OH content of types I and IV can be estimated using equation (1), our experimental data and the calculations of Lin and Dence [16] for various phenolic structures in lignins. The results are given in table 2. All lignins are basically composed of type I units whose amounts decrease from KL to OL and HL, and the OL lignin contains the highest fraction of type IV phenols. The degree of esterification was calculated from the amounts of OH groups before and after Acetylation (see table 2).
Table 2.
Phenol content of commercial and acetylated lignins deduced from UV/Vis spectra, and the corresponding percentage of esterification.
| Lignin | Type I OH | Type IV OH | % Esterification |
|---|---|---|---|
| (mmol g−1) | (mmol g−1) | ||
| KL | 0.936 | 0.097 | |
| AKL | 0.765 | 0.089 | 17.3 |
| OL | 0.528 | 0.123 | |
| AOL | 0.0 | 0.055 | 91.6 |
| HL | 0.424 | 0.156 | |
| AHL | 0.0 | 0.073 | 87.6 |
According to the reaction mechanism suggested in figure 4, structures having a conjugated double bond, such as type IV phenols, are less prone to esterification. This is because of their resonant structures including the hydroxyl electron pair of the alcohol. Their correspondingly lower reactivity might result in a lower esterification degree of type IV OH groups in all lignins. Table 2 indeed shows that the amounts of type IV hydroxyls only slightly decreased after acetylation, whereas those of type I decreased much more, particularly for AOL and AHL for which all the OH groups of type I have been substituted. Thus, esterification was almost complete for HL and OL. The saturated side chain of KL should be less hydrophilic, and the solubility of modified lignin could increase when the reaction proceeds: these features could be the reason for the lower acetylation degree of KL, as reported elsewhere [18].
Figure 4.
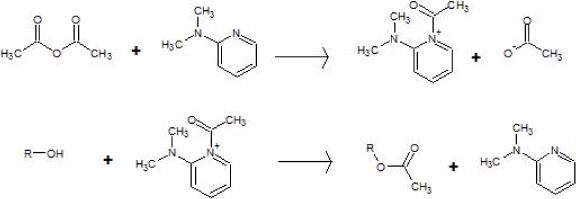
Esterification mechanism of alcohols using acetic anhydride and 4-dimethylaminopyridine (DMAP) as a catalyst.
NMR
NMR allows the detailed structural investigation of lignins [43]. It was used here for calculating in each lignin the ratio of ester to methoxy (aromatic methyl ether) protons. The integral of the former signal should increase with acetylation, whereas the latter should remain constant. As reported in previous studies [44], acetylated lignins lead to better signal resolution and to lower signal overlapping and proton coupling effects.
Figures 5(a)–(c) show the 1H NMR spectra of all the lignin samples: raw and acetylated. As pointed out in table 1, all the signals ranging from 6.0 to 8.0 ppm can be attributed to aromatic protons in guaiacyl units, whereas those between 0.8 and 1.5 ppm are related to aliphatic groups.
Figure 5.
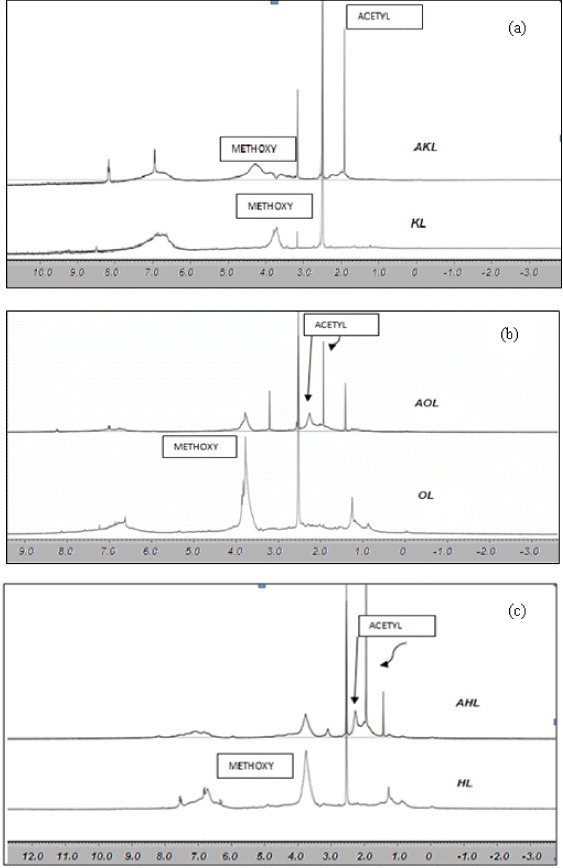
1H NMR spectra of raw and acetylated lignins: (a) KL and AKL, (b) OL and AOL, and (c) HL and AHL. The x-axis is in ppm.
Methoxy protons (–OCH3) give an intense signal centered at 3.8 ppm, that of KL being the smallest among the three raw, commercial, tested lignins. This fact was reported previously [45] and explained by the cleavage of the alkyl-aryl-ether union during the kraft process. Acetylation broadens proton signals, those corresponding to aliphatic and aromatic groups of esters being hardly separated despite different chemical shifts: 2.3 and 2.1 ppm, respectively. Separate quantification is therefore difficult, as reported elsewhere [18]. Nevertheless, it is possible to quantitatively analyze integrated signals, and to measure acetylation by comparing the methoxy signal, which does not vary during esterification, to that of alfa-CH2 incorporated by acetylation. Thus, 1H NMR spectra of acetylated lignin samples reveal the total content of acetyl (related to OH content) and methoxyl groups. The quantitative analysis described in figure 5 yielded the results given in table 3. The acetylation reaction was more effective for HL and OL, as already deduced from UV/Vis spectroscopy. Nevertheless, UV/Vis and NMR techniques show no significant difference between AHL and AOL.
Table 3.
Integrated values of the proton signals (O-CH3, α-CH2) and their ratio for each type of raw and acetylated lignin.
| ID Lignin | Aromatic H | O-CH3 | α-CH2 | α-CH2/O-CH3 |
|---|---|---|---|---|
| KL | 1 | 0.714 | 0.319 | 0.6702 |
| AKL | 1 | 1.16 | 1.91 | 1.6466 |
| OL | 1 | 1.744 | 0.502 | 0.2878 |
| AOL | 1 | 1.34 | 1.97 | 1.4701 |
| HL | 1 | 1.211 | 0.419 | 0.5190 |
| AHL | 1 | 1.46 | 1.8 | 1.8493 |
Infrared spectroscopy
IR spectra of raw and acetylated lignins are shown in figure 6. The absorbance of OH bands around 3400 cm−1 is higher in KL than in HL and OL, which may be attributed to both the precursor and pulping processes [44]. Bands at 2800–3000 cm−1 can be assigned to C–H of methyl and methylene groups present in alkyl chains. Methoxyl groups correspond to the bands at 2850–2960 cm−1 [44, 46], which are the strongest in HL among raw lignins. In KL, the OH band (3500 cm−1) is more prominent than the OCH3 band, probably because of the partial hydrolysis of the methoxyl groups of lignin into phenolic OH groups during the pulping process [44].
Figure 6.
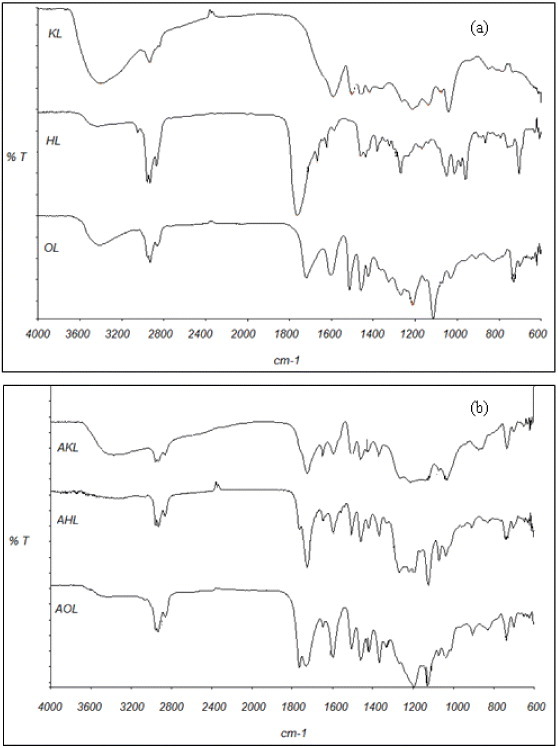
FTIR transmission spectra of (a) raw and (b) acetylated lignins.
Accordingly, the relative absorbance of the C=C aromatic ring vibrations at 1600 and 1500 cm−1 is much higher for HL than for KL and OL. For KL, there is no evidence of carbonyl groups (1700 cm−1), unlike in OL and HL. In the organosolv method, the acetic acid released from the hemicelluloses of wood dissolves the lignin. Acid hydrolysis of lignin is promoted, generating phenolic hydroxyl and carbonyl groups that can be seen at 1328 and 1721 cm-1, respectively [47]. The kraft method cleaves β-O-4 and α-O-4 linkages, leaving non etherified phenolic OH groups in lignin. The carbonyl groups in HL have a stretching band at 1660–1725 cm-1 [19, 48]. Finally, absorption bands at 1420, 1085–1125 and 1035 cm−1 have been ascribed to the C–H aromatic ring vibration, tension vibration of C–O in secondary alcohols and aliphatic ethers, and C–O vibration of primary alcohol, respectively [49].
Acetylation (see figure 6(b)) induced new bands at 1736 and 1765 cm−1 attributed to non conjugated carbonyl groups (aromatic and aliphatic, respectively) that occurred during the esterification process.
GPC-HPLC
The number and weight-average molecular weights of lignin samples, Mn and Mw, respectively, were analyzed by THF-eluted GPC, and the results are given in table 4. The solubility of acetylated lignin was enhanced in THF. HL has the lowest Mw (544 g mol−1), followed by KL (751 g mol-1) and OL (1157 g mol−1). The last value agrees well with that in the literature, but those of HL and KL are lower than the previously reported ones [50, 51]. KL is known to have a high average Mw owing to the reaction of some α-hydroxyl groups during the pulping process [50]. For composite production, the lignin having the lowest molecular weight is expected to have the highest surface area-to-volume ratio, and should thus lead to the best adhesion with the polymer structure [52]. After acetylation, a significant increase in Mw occurred, particularly for HL, which is the most functionalized lignin.
Table 4.
Results of GPC–HPLC analysis of raw and acetylated lignins: Number (Mn) and weight average molecular weight (Mw) and polydispersity index (PD).
| Lignin | Mn | Mw | PD |
|---|---|---|---|
| KL | 651 | 751 | 1.154 |
| AKL | 737 | 941 | 1.27 |
| OL | 571 | 1157 | 2.027 |
| AOL | 907 | 2492 | 2.74 |
| HL | 366 | 544 | 1.48 |
| AHL | 817 | 2833 | 3.47 |
Polydispersity indexes (PDs) also agree with the literature data and are consistent with what was expected from Acetylation (see table 4). HL and KL have low PDs, within the range of 1–1.5. OL has the highest PD owing to the presence of large phenylpropane units that contribute more to the Mw value in OL than in the other lignins. AHL is the acetylated lignin with the broadest molecular weight distribution, as suggested by its high polydispersity index.
TEM
All the lignins were observed by TEM, and the results are presented in figure 7. Lignin particle sizes vary from 10 to approximately 100 nm, even after acetylation. Therefore, a ‘nano’ effect is expected in lignin composites, i.e. changes in the local properties of the matrix caused by both the extremely high surface area of the filler and the small distances between the filler particles, even at low mass loadings. Figure 7(a) shows KL and AKL in the form of aggregates larger than 100 nm and consisting of rounded particles. Such aggregates are inconsistent with the measured low molecular weight (<1000 Da), and were probably generated during solution casting or drying of the TEM samples. Such aggregates are also seen for HL and AHL (figure 7(b)), but not for OL and AOL (figure 7(c)). In membrane casting, secondary bonding to CTA might force lignin molecules to remain dispersed during solvent evaporation, thus such agglomerates are always avoided in the final composite films. Acetylation does not change the structure of the filler, regardless of the lignin type.
Figure 7.
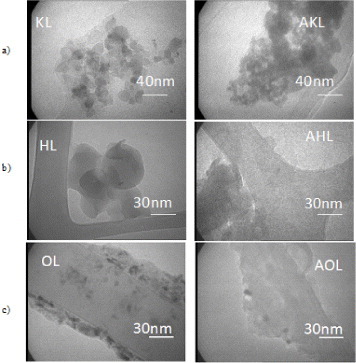
TEM images of raw and acetylated lignins: (a) kraft, (b) hydrolytic and (c) organosolv (KL and AKL, HL and AHL and OL and AOL, respectively).
Figure 8 shows the particle size distributions of raw and acetylated lignins. The mean particle size is smaller in HL than in KL and OL (figures 8(a), (c) and (e)). The larger size of the KL particles may be due to their hydrophilic character, promoting aggregation in organic solvents. Acetylation of KL improved its dispersion for particle analysis, whereas that of OL did not change the particle size. In contrast, AHL particles were much larger, probably due to the increase in molecular weight after acetylation. Particle size is an important factor for achieving a good interaction between the filler and matrix, as discussed in section 3.2.2.
Figure 8.
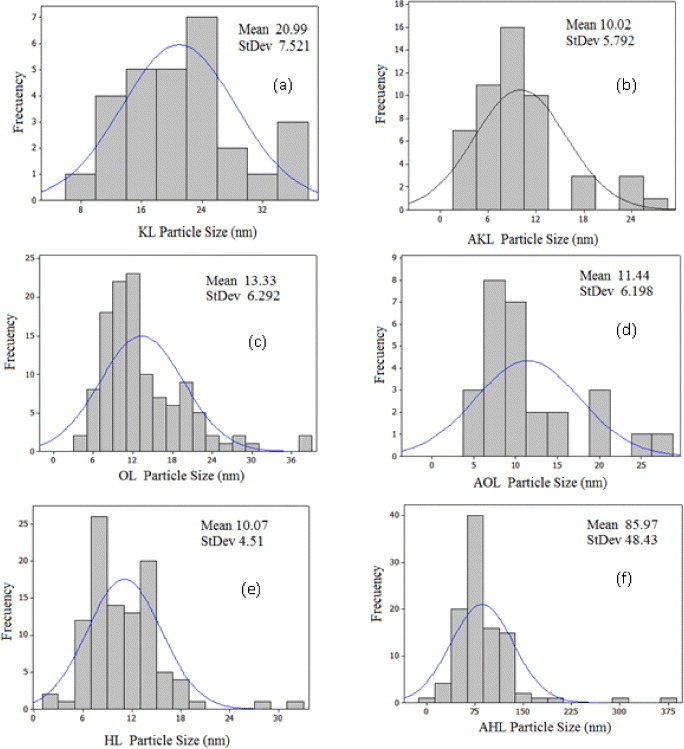
Particle size distribution of lignins: (a) KL, (b) AKL, (c) OL, (d) AOL, (e) HL and (f) AHL.
Nanocomposite synthesis and analysis
SEM
One of the challenges in composite manufacturing is achieving a good adhesion between a polymer matrix and filler particles, particularly in combination with a homogeneous distribution of the filler [7, 53]. Several methods, such as surface modification, have been developed to enhance the polymer-filler interaction and reduce the void formation [53]. Lignin esterification has proved to be effective for increasing the affinity with cellulose derivatives [6, 18].
In this work, lignin particles were wetted with the solvent of the casting solution prior to their incorporation into the polymer solution. The solvation of lignin particles was expected to decrease the interaction between them, thus improving their dispersion and, hence, their adhesion to the CTA matrix. As a result, a macroscopically homogenous distribution was obtained.
Polymer composite membranes exhibit changes in structure and morphology induced by preparation conditions such as RH and temperature. These parameters are known to produce similar effects in cellulose systems [54]. In the evaporation casting process, the polymer is dissolved in a semi volatile solvent. When the solvent is released, the solubility of the polymer in the solution decreases and a phase separation occurs. Hence, the casting temperature affects the kinetics of solvent evaporation [55, 56]. In general, any physicochemical condition that can modify the evaporation rate should affect the film structure. In previous studies [11], temperature and humidity were varied when producing CTA films, and the solvent diffusion and evaporation rate both increased with temperature.
About 50 SEM images of lignin-triacetate composite films (made at 35, 45 or 55 °C at 10, 30 or 70% RH) were obtained, from which only a few are shown in figure 9. The following trends were observed.
Figure 9.
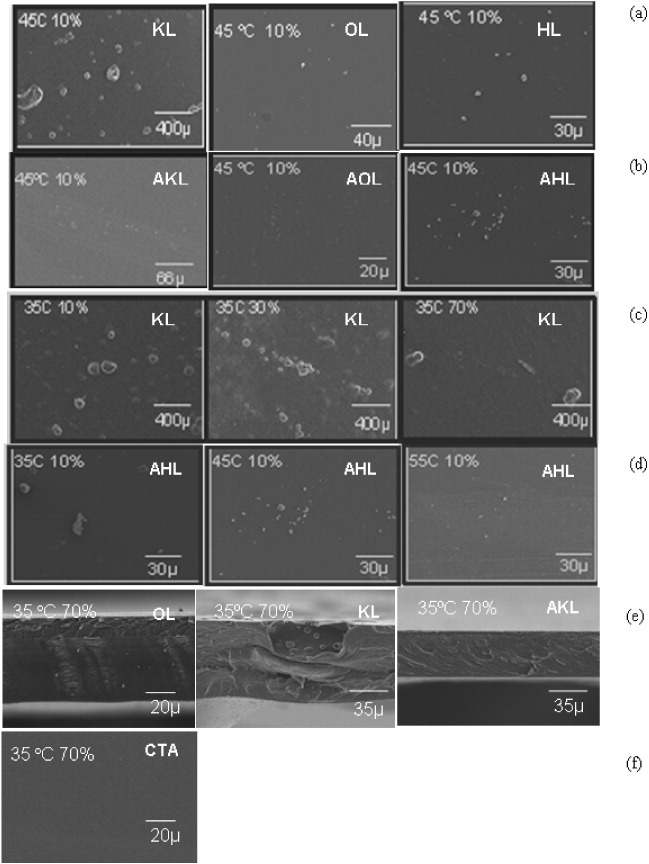
Selected SEM images of nanocomposite films based on CTA and 1 wt% raw or acetylated lignin. Comparison of (a) raw and (b) acetylated lignins under identical preparation conditions: examples of effects of (c) RH at constant temperature and (d) temperature at constant RH on the dispersion of lignins. (e) Cross section of films prepared from raw lignins. (f) Pure CTA film shown as a reference.
1. At the same temperature and relative humidity, the quality of the dispersion of lignin particles is the highest for OL and the lowest for KL, (see figure 9(a)). KL always formed heterogeneous films without adhesion between the matrix and filler. Particles of 1–200 μm diameter were observed occasionally, as in the aforementioned aggregates.
2. Nearly all the membranes made from acetylated lignins (AKL, AOL and AHL) were relatively dense, smooth and homogeneous (see figure 9(b)).
3. The dispersion of lignin particles in the polymer increased with humidity and temperature (see figures 9(c) and (d)).
4. Cross-sectional imaging performed for all types of lignin, raw and acetylated, revealed a dense material, except for KL. A dense matrix around lignin aggregates was observed for KL only (figure 9(e)).
These experimental results can be explained as follows. On the one hand, small filler particles may act as obstacles during solvent evaporation, lengthening the diffusion path of solvent molecules and creating heterogeneities. On the other hand, polymer adsorption on the lignin surface may affect the diffusion rate of solvent during solidification of the composite. Thus, AKL formed homogeneous membranes, owing to its acetyl groups that interacted with the solvent. By contrast, agglomeration of KL particles occurred because of their lack of acetyl groups. Furthermore, OL presents a high affinity for organic solvents [57], and this fact could explain its easier incorporation into CTA, leading to films free of lignin segregation. Additionally, owing to their hydrophilic character, lignin particles dispersed better in the polymer at higher RH and temperature, thereby improving the homogeneity of the resultant films. When RH and temperature were independently fixed during membrane precipitation, two separate effects were observed. Water vapor acts as a non solvent in the casting process, and temperature determines the rate of solvent evaporation. At high RH, water activity is such that polymer precipitation occurs due to a non solvent mechanism. Temperature and humidity effects have been reported by other authors [58] studying cellulose nitrate in acetone at different RHs up to 90%. They observed that RH increases the driving force for a net diffusion into the film and for an accumulation of water inside the film, thus altering the final membrane morphology.
Finally, it is important to emphasize that all the materials studied here were homogenous, as revealed by observing the cross sections of the thin films.
DMA
The dynamic mechanical characteristics of nanocomposite materials are related to the properties of their components, the morphology of the system, and the nature of the interface between the filler and polymer matrix. This interface is very sensitive to any surface modification controlling the compatibility between the lignin and the matrix. Thus, dynamic mechanical measurements can be effectively used for investigating such compatibility and its impact on the nanocomposite properties.
A filler is usually added to polymers to increase their modulus or stiffness through reinforcement mechanisms described on the basis of the theories of composites [59]. The ratio of stress to strain in the linear deformation region is the Young's modulus (E). The Young's moduli of nanocomposite films of 0.05 mm average thickness are listed in table 5. The differences between the E values were analyzed statistically. The standard deviation of different measurements (of which three are independent) was calculated with the analysis of variance (ANOVA). We used the MINITAB 14 software to evaluate the hypothesis, according to which no difference exists at a significance level of 0.05, among the variances of Young's moduli of membranes synthesized using different lignins and different preparation conditions. Each analysis led to a probability (P) value. If differences in Young's modulus were statistically significant, i.e. P < 0.05, then the aforementioned hypothesis was rejected. Additionally, a Tukey test was performed to show which values were different.
Table 5.
Young's moduli of membranes made of pure cellulose triacetate (CTA) or comprising either raw KL, OL or HL lignins: (MKL, MOL and MHL, respectively), or acetylated AKL, AOL or AHL lignins: (MAKL, MAOL and MAHL, respectively).
| Synthesis conditions | Young's moduli (GPa) of membranes: | |||||||||
|---|---|---|---|---|---|---|---|---|---|---|
| With raw lignins | With acetylated lignins | |||||||||
| T (°C) | HR (%) | CTA | MKL | MOL | MHL | MAKL | MAOL | MAHL | ||
| 35 | 10 | 0.97 | 0.98 | 0.69 | 2.00 | 1.05 | 0.75 | 0.84 | ||
| 35 | 70 | 0.94 | 0.90 | 1.20 | 2.98 | 1.45 | 0.73 | 1.66 | ||
| 45 | 30 | 0.31 | 1.09 | 0.80 | 1.55 | 1.70 | 0.75 | 0.81 | ||
| 45 | 70 | 1.03 | 0.93 | 0.62 | 1.68 | 1.23 | 1.27 | 1.95 | ||
| 55 | 10 | 1.10 | 0.48 | 0.60 | 2.04 | 1.05 | 0.63 | 0.88 | ||
First, we compared different lignins. Tukey tests showed that the Young's moduli of membranes made with HL particles (MHL) are different (P=0.001) from all the other films, compared to those without lignin (CTA), (see table 5). When the analysis was made for all the acetylated lignin films, no differences among all the conditions tested could be found. In the same way, when each type of lignin was compared according to different synthesis parameters, no difference in Young's moduli was evidenced for all the MKL, MAKL and MHL membranes. These materials are thus mechanically equivalent, regardless of the preparation conditions. The following films, prepared at 70% RH, have a significantly higher Young's modulus: MOL (P=0.008) prepared at 35 °C, MAOL (P=0.036) at 45 °C and MAHL (P=0.005) at 35 and 45 °C. ANOVA did not show any significant difference among the films of different thicknesses (P=0.016). Similar CTA membranes with an average thickness of 50 μm were reported elsewhere [11], and the addition of only 1% lignin affected the crystallinity of CTA, as observed by other authors [6].
Finally, we analyzed all the films by lignin type and preparation conditions. The average particle size is the smallest for HL (10.07 nm), and thus MHL has the highest Young's moduli, indicating that for this system, the size and functionalization controlled well the polymer-particle interaction. This finding may be attributed to: (i) the rigid polymeric network structure formed, (ii) the nanofiller itself when combined with the system and (iii) the interaction (adhesion) between the nanoparticles and the polymer [60]. The particles agglomerated for MKL, and the worst mechanical properties are observed for samples prepared at 55 °C and 10% RH. In this case, acetylation promotes the particle adhesion, resulting in better composites as seen in table 5. There is no improvement for OL, where the size and hydrophobic character of lignin particles remained almost the same after acetylation. For instance, the mechanical properties of MOL samples did not change much after acetylation.
Tables 6 and 7 list the values of stress and elongation at break, respectively. Statistical analysis revealed that only MHL is different from the other materials (P=0.012). Under the same RH conditions, only MAHL obtained at 70% RH and at 35 or 45 °C are different (P=0.001) from all the other nanocomposites. The elongation at break achieved in this study is almost three times higher than that of other all-biopolymer nanocomposites reported so far [26].
Table 6.
Stress at break of membranes made of pure CTA or comprising either raw or acetylated lignins.
| Synthesis conditions | Stress at break (MPa) of membranes: | |||||||||
|---|---|---|---|---|---|---|---|---|---|---|
| With raw lignins | With acetylated lignins | |||||||||
| T (°C) | HR (%) | CTA | MKL | MOL | MHL | MAKL | MAOL | MAHL | ||
| 35 | 10 | 50.89 | 27.3 | 39.60 | 85.43 | 51.9 | 29.87 | 26.96 | ||
| 35 | 70 | 46.4 | 41.19 | 56.70 | 128 | 81.565 | 50.12 | 58.28 | ||
| 45 | 30 | 40.5 | 39.55 | 45.69 | 45.69 | 58.15 | 49.67 | 31.01 | ||
| 45 | 70 | 45.7 | 42.3 | 30.30 | 78.63 | 55.8 | 39.79 | 82.13 | ||
| 55 | 10 | 16.35 | 14.75 | 28.70 | 52.81 | 43.07 | 29.94 | 39.53 | ||
Table 7.
Elongation at break of membranes made of pure CTA or comprising either raw or acetylated lignins.
| Synthesis conditions | Elongation at break (%) of membranes: | |||||||||
|---|---|---|---|---|---|---|---|---|---|---|
| With raw lignins | With acetylated lignins | |||||||||
| T (°C) | HR (%) | CTA | MKL | MOL | MHL | MAKL | MAOL | MAHL | ||
| 35 | 10 | 7.81 | 4.865 | 7.50 | 6.03 | 7.34 | 5.55 | 5.41 | ||
| 35 | 70 | 9.20 | 6.64 | 9.26 | 8.91 | 6.83 | 12.12 | 4.77 | ||
| 45 | 30 | 7.07 | 6.66 | 10.36 | 8.33 | 4.68 | 9.44 | 4.94 | ||
| 45 | 70 | 8.715 | 6.575 | 5.76 | 8.09 | 6.85 | 5.36 | 5.60 | ||
| 55 | 10 | 7.05 | 3.745 | 6.05 | 3.74 | 6.045 | 7.00 | 4.90 | ||
AFM
Before the AFM analysis, the samples were examined in an optical microscope attached to the AFM and some results are shown in figure 10. Topographic AFM images of all the synthesized composites are shown in figure 11, and table 8 lists the values of roughness (Rrms), which is one of the most important surface properties controlling the flow properties and local mass transfer [24].
Figure 10.
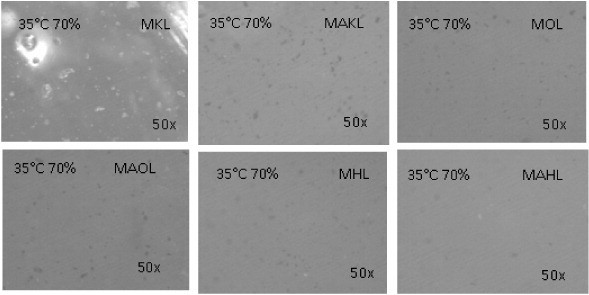
Optical images (50× magnification) of different membranes before their investigation by AFM.
Figure 11.
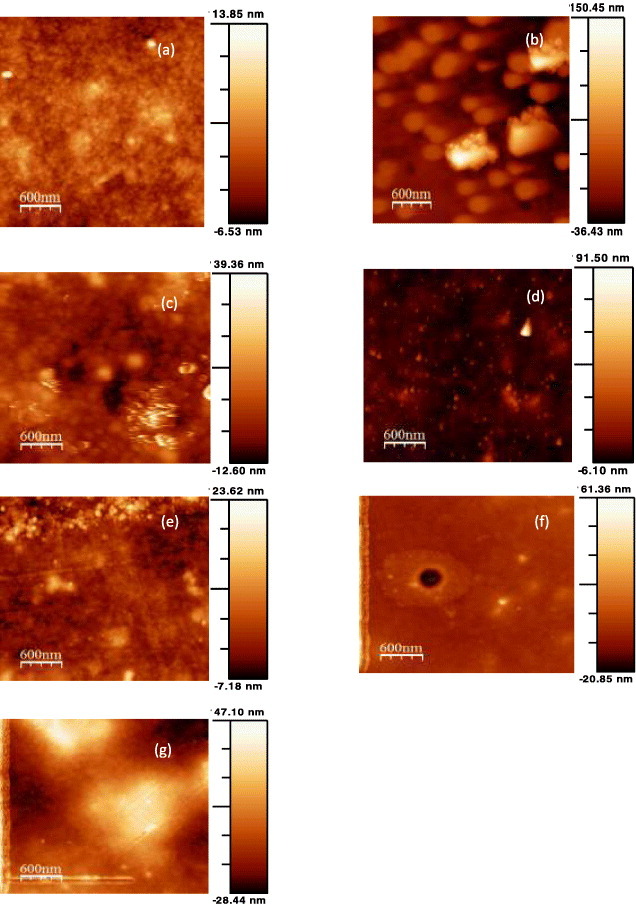
Selected AFM images (3×3 μm) of nanocomposite films based on CTA and 1 wt% raw or acetylated lignin. Comparison of (a) CTA (b) MKL, (c) MAKL, (d) MOL, (e) MAOL, (f) MHL and (g) MAHL films.
Table 8.
Rugosity (Rmns) calculated using WSM software from AFM data.
| Sample | Rrms | Uncertainty |
|---|---|---|
| MKL | 26.40 | 0.22 |
| MAKL | 6.10 | 0.43 |
| MOL | 3.36 | 0.50 |
| MAOL | 3.23 | 0.55 |
| MHL | 6.37 | 1.62 |
| MAHL | 13.88 | 1.75 |
| CTA | 1.99 | 0.43 |
A smooth surface is obtained for CTA, with no pores and the smallest roughness. In contrast, lignin nanoparticles protrude from the surface of the MKL sample, resulting in a high roughness of 26.40 ± 0.22 nm. The roughness decreases after acetylation (see figure 11(c) and table 8). Substituting the hydroxyl groups in lignin thus clearly improved its incorporation into the polymer matrix; however, the particles are more easily seen than in the other acetylated lignins. Acetylation also decreased the roughness of the films made from OL, but not those made of HL. In the latter case, the high acetylation degree might have increased the size of the AHL particles.
Conclusions
This paper is the first part of a study devoted to a new type of all-biopolymer composite membranes. The membranes were prepared by vapor-induced phase separation using nanometric lignin particles as filler and CTA as matrix. We studied three types of lignin: organosolv, hydrolytic and kraft (OL, HL and KL, respectively).
UV/Vis, NMR, FTIR and GPC results suggest that acetylation was far more effective for HL and OL than for KL. Acetylation clearly increased the average molecular weight, but the mean size of the modified lignin particles remained between a few and approximately 100 nm.
Among the three raw lignins studied, OL resulted in the best composites, according to SEM observations. Acetylation substantially improved the homogeneity of the resultant membranes, regardless of the type of precursor lignin. The microscopic quality of the composites was highest when acetylated OL and HL were used as fillers.
At the time of lignin incorporation, the process is controlled by the hydrophilic character of the system: CTA–lignin–CH2Cl2–water. Acetylation leads to an increase in the molecular weight, higher particle dispersion in the polymer and replacement of hydroxyl groups by a nonpolar structure. Acetylation thus affects the membrane morphology and mechanical resistance.
Acetylation was particularly important for the dispersion of kraft lignin particles—because of its hydrophilic character, KL did not mix intimately with the polymer during casting unless it was acetylated. SEM results showed poor dispersion and significant particle agglomeration at the membrane surface when lignin was not acetylated. This was confirmed by the high roughness measured. The increase in humidity had a positive effect on the dispersion of lignin, owing to its high affinity for water, thus leading to a more homogeneous structure. However, from the mechanical viewpoint, all the membranes obtained were similar, whether KL or AKL was used. For organosolv lignin, the affinity for CH2Cl2 was initially good enough for casting homogeneous membranes. The roughness and morphology did not change significantly after the chemical modification of lignin. The acetylation of organosolv lignin improved the composite mechanical properties only at the highest RH (70%) and at 45 °C. The highest acetylation was reached for hydrolytic lignin, with significant changes in lignin particle size, molecular weight and particle dispersion during membrane formation. The mechanical properties were improved when hydrolytic lignin alone was used in the nanocomposite.
Our results suggest that the low molecular weight of the lignin is crucial for membrane performance, regardless of the RH or temperature during casting, and that a higher temperature and relative humidity improve the material homogeneity. These findings were confirmed by measuring the Young's moduli of each membrane. With only a few exceptions, the mechanical properties were considerably improved through the incorporation of 1 wt% lignin. The highest Young's moduli were obtained with hydrolytic lignin, which had the smallest particles among the studied lignins.
The studied membranes can be applied in continuous water purification processes, where lignin incorporation will improve the resistance of the material to bacteria-induced fouling.
Acknowledgment
The French authors from IJL laboratory gratefully acknowledge the financial support of CPER 2007–2013 ‘Structuration du Pôle de Compétitivité Fibres Grand'Est’ (Competitiveness Fibre Cluster), through local (Conseil Général des Vosges), regional (Région Lorraine), national (DRRT and FNADT) and European (FEDER) funds. L ANM acknowledges her PhD grant from CONACYT. G GS was funded by CONACYT (SEP CONACYT-CB-2005-C01-46431). The authors are grateful to the Laboratorio Nacional de Nanotecnología for AFM, SEM and FE-SEM characterizations, and to W Antunez, K Campos, O Solis and M Mendoza for technical support in sample characterization.
References
- Cai X, Riedl B, Zhang S Y and Wan H. 2008. Composite A 39 727 10.1016/j.compositesa.2008.02.004 [DOI] [Google Scholar]
- Azizi Samir M A S, Alloin F. and Dufresne A. Biomacromolecules. 2005;6:612. doi: 10.1021/bm0493685. [DOI] [PubMed] [Google Scholar]
- De Souza, Lima M M. and Borsali R. Macromol. Rapid Commun. 2004;25:771. doi: 10.1002/(ISSN)1521-3927. [DOI] [Google Scholar]
- Paul D R. and Robeson L M. Polymer. 2008;49:3187. doi: 10.1016/j.polymer.2008.04.017. [DOI] [Google Scholar]
- Alexandre M. and Dubois P. Mater. Sci. Eng. 2000;28:1. doi: 10.1016/S0927-796X(00)00012-7. [DOI] [Google Scholar]
- Arthanareeswaran G, Thanikaivelan P, Srinivasn K, Mohan D. and Rajendran M. Eur. Polym. J. 2004;40:2153. doi: 10.1016/j.eurpolymj.2004.04.024. [DOI] [Google Scholar]
- Anson M, Marchese J, Garis E, Ochoa N. and Pagliero C. J. Membr. Sci. 2004;243:19. doi: 10.1016/j.memsci.2004.05.008. [DOI] [Google Scholar]
- Te Hennepe H J C. 1988. Zeolite-filled polymeric membranes: a new concept in separation science, Thesis University of Twente (Holland) p 108 [Google Scholar]
- Süer M G, Baç N. and Yilmaz L. J. Membr. Sci. 1994;9:177. [Google Scholar]
- Vu D Q, Koros W J. and Miller S J. J. Membr. Sci. 2003;211:311. doi: 10.1016/S0376-7388(02)00429-5. [DOI] [Google Scholar]
- Ballinas Casarrubias L, Terrazas Bandala L P, Ibarra Gómez R, Mendoza Daurte M E, Manjarrez Nevárez L A. and González Sánchez G. Polym. Adv. Technol. 2006;17:991. doi: 10.1002/(ISSN)1099-1581. [DOI] [Google Scholar]
- Moore T T. and Koros W J. J. Mol. Struct. 2005;739:87. doi: 10.1016/j.molstruc.2004.05.043. [DOI] [Google Scholar]
- Freedonia Group Inc. 2010. Membrane Separation Technologies (Cleveland, OH: Freedonia Group Inc; ) p 328 [Google Scholar]
- Shannon M A, Bohn P W, Elimelech M, Georgiadis J G, Mariñas B J. and Mayes A M. Nature. 2008;452:301. doi: 10.1038/nature06599. [DOI] [PubMed] [Google Scholar]
- Sathees Kumar M N, Mohanty A K, Erickson L. and Misra M. J. Biobased Mater. Bioenergy. 2009;3:1. doi: 10.1166/jbmb.2009.1001. [DOI] [Google Scholar]
- Lin S Y. and Dence C W. Berlin: Springer; 1992. Methods in Lignin Chemistry; p. p 217. [Google Scholar]
- Paiva J M F. and Frollini E. Macromol. Mater. Eng. 2006;291:405. doi: 10.1002/(ISSN)1439-2054. [DOI] [Google Scholar]
- Thielemans W. and Wool R P. Biomacromolecules. 2005;6:1895. doi: 10.1021/bm0500345. [DOI] [PubMed] [Google Scholar]
- Novikova L N, Medvedeva S A, Volchatova I V. and Bogatyreva S A. Appl. Biochem. Microbiol. 2002;38:181. doi: 10.1023/A:1014322919377. [DOI] [Google Scholar]
- Su Y S, Kuo C Y, Wang D M, Lai J Y, Deratani A, Pochat C. and Bouyer D. J. Membr. Sci. 2009;338:18. doi: 10.1016/j.memsci.2009.03.050. [DOI] [Google Scholar]
- Srinivasarao M, Collings D, Philips A. and Patel S. Science. 2001;292:79. doi: 10.1126/science.1057887. [DOI] [PubMed] [Google Scholar]
- Caquineau H, Menut P, Deratani A. and Dupuy C. Polym. Eng. Sci. 2003;43:798. doi: 10.1002/(ISSN)1548-2634. [DOI] [Google Scholar]
- Lee H J, Jung B, Kang Y S. and Lee H. J. Membr. Sci. 2004;245:103. doi: 10.1016/j.memsci.2004.08.006. [DOI] [Google Scholar]
- Rials T G. and Glasser W G. J. Appl. Polym. Sci. 1989;37:2399. doi: 10.1002/app.1989.070370827. [DOI] [Google Scholar]
- Ghosh I, Jain R K. and Glasser W G. Lignin: Historical, Biological, and Materials Perspectives. In: Glasser W G, editor. Washington, DC: ACS Publication; 2000. p. p 331. [Google Scholar]
- Abe K, Nakatsubo F. and Yano H. Compos. Sci. Technol. 2009;69:2434. doi: 10.1016/j.compscitech.2009.06.015. [DOI] [Google Scholar]
- Liu C X. and Bai RB. J. Membr. Sci. 2005;267:68. doi: 10.1016/j.memsci.2005.06.001. [DOI] [Google Scholar]
- Argyropoulos D S. and Menachem S B. Adv. Biochem. Eng. Biotechnol. 1997;57:127. [Google Scholar]
- Goldschmid O. Anal. Chem. 1954;26:1421. doi: 10.1021/ac60093a009. [DOI] [Google Scholar]
- Azadfallah M, Mirshokraei S A. and Latibari A J. Molecules. 2008;13:3129. doi: 10.3390/molecules13123129. [DOI] [PMC free article] [PubMed] [Google Scholar]
- Froas P M, Ragauskas A J. and Jiang J E. Holzforschung. 1998;52:385. doi: 10.1515/hfsg.1998.52.4.385. [DOI] [Google Scholar]
- Balakshin M Y, Capanema E A, Chen C L. and Gracz H S. J. Agric. Food Chem. 2003;51:6116. doi: 10.1021/jf034372d. [DOI] [PubMed] [Google Scholar]
- Li S. and Lundquist K. J. Wood Chem. Technol. 1997;17:391. doi: 10.1080/02773819708003140. [DOI] [Google Scholar]
- Connors W J, Sarkanen S. and McCarthy J L. Holzforschung. 1980;34:80. doi: 10.1515/hfsg.1980.34.3.80. [DOI] [Google Scholar]
- Horcas I, Fernandez R, Gómez Rodriguez J M, Colchero J, Gomez Herrero J. and Baro A M. Rev. Sci. Instrum. 2007;78:013705. doi: 10.1063/1.2432410. [DOI] [PubMed] [Google Scholar]
- Nadji H, Diouf P N, Benaboura A, Bedard Y, Riedl B. and Stevanovic T. Bioresour. Technol. 2009;100:3585. doi: 10.1016/j.biortech.2009.01.074. [DOI] [PubMed] [Google Scholar]
- Gosselink R J A, Abächerli A, Semke H, Malherbe R, Käuper P, Nadif A. and Van Dam J E G. Ind. Crops Prod. 2004;19:271. doi: 10.1016/j.indcrop.2003.10.008. [DOI] [Google Scholar]
- Dorrestijn E, Laarhoven L J J, Arends I W C E. and Mulder P. J. Anal. Appl. Pyrolysis. 2000;54:153. doi: 10.1016/S0165-2370(99)00082-0. [DOI] [Google Scholar]
- Gonçalves A R. and Benar P. Bioresour. Technol. 2001;79:103. doi: 10.1016/S0960-8524(01)00056-6. [DOI] [PubMed] [Google Scholar]
- Janshekar H, Brown C. and Fiechter A. Anal. Chim. Acta. 1981;130:81. doi: 10.1016/S0003-2670(01)84153-2. [DOI] [Google Scholar]
- Steinitz Y L. Eur. J. Appl. Microbiol. Biotechnol. 1981;13:216. doi: 10.1007/BF00500101. [DOI] [Google Scholar]
- Gadda L. 1981. Delignification of Wood Fibre Cell Wall during Alkaline Pulping Processes (Institute of Wood Chemistry and Pulp and Paper Technology, Abo Academic, Finland) [Google Scholar]
- Glasser W G. and Jain R K. Holzforschung. 1993;47:225. doi: 10.1515/hfsg.1993.47.3.225. [DOI] [Google Scholar]
- Nada A A M, Yousef M A, Shaffeib K A. and Salahb A M. Polym. Degrad. Stab. 1998;62:157. doi: 10.1016/S0141-3910(97)00273-5. [DOI] [Google Scholar]
- González Sánchez C. and Exposito Alvarez L A. Macromol. Mater. Eng. 1999;272:65. [Google Scholar]
- Rohella R S, Sahoo N, Paula S C, Choudhury S. and Chakravortty V. Thermochim. Acta. 1996;287:131. doi: 10.1016/0040-6031(96)02983-8. [DOI] [Google Scholar]
- Tejado A, Peña C, Labidi J, Echeverria J M. and Mondragon I. Bioresour. Technol. 2007;98:1655. doi: 10.1016/j.biortech.2006.05.042. [DOI] [PubMed] [Google Scholar]
- Suhas, Carrott P J M. and Ribeiro Carrott M M L. Bioresour. Technol. 2007;98:2301. doi: 10.1016/j.biortech.2006.08.008. [DOI] [PubMed] [Google Scholar]
- Bykov I. 2008. Characterization of Naural and Technical Lignin Using FTIR Spectroscopy Master thesis Scandinavia Lulea University of Technology [Google Scholar]
- Cai W. and Gupta R B. J. Appl. Polym. Sci. 2002;83:169. doi: 10.1002/(ISSN)1097-4628. [DOI] [Google Scholar]
- Kubo S. and Kadla J F. Biomacromolecules. 2003;4:561. doi: 10.1021/bm025727p. [DOI] [PubMed] [Google Scholar]
- Hu T O. Dordrecht: Kluwer Academic/Plenum; 2002. Chemical Modification, Properties and Usage of Lignin; p. p 96. [Google Scholar]
- Duval J M, Kemperman A J B, Folkers B, Mulder M H V, Desgrandchamps G. and Smolders C A. J. Appl. Polym. Sci. 1994;54:409. doi: 10.1002/app.1994.070540401. [DOI] [Google Scholar]
- Vint J, Halary J L, Noel C. and Monnerie L. Eur. Polym. J. 1975;11:71. doi: 10.1016/0014-3057(75)90177-9. [DOI] [Google Scholar]
- Bragança F C. and Rosa D S. Polym. Adv. Technol. 2003;14:669. doi: 10.1002/(ISSN)1099-1581. [DOI] [Google Scholar]
- Ikeda S R. and Korn S J. J. Physiol. 1995;486:267. doi: 10.1113/jphysiol.1995.sp020809. [DOI] [PMC free article] [PubMed] [Google Scholar]
- Rösch J. and Mülhaupt R. Polym. Bull. 1994;32:361. doi: 10.1007/BF00308549. [DOI] [Google Scholar]
- Sun H X, Liu S N, Ge B S, Xing L. and Chen H L. J. Membr. Sci. 2007;295:2. doi: 10.1016/j.memsci.2007.02.019. [DOI] [Google Scholar]
- Fornes T D. and Paul D R. Polymer. 2003;44:4993. doi: 10.1016/S0032-3861(03)00471-3. [DOI] [Google Scholar]
- Cai X, Riedl B, Zhang S Y. and Wan H. Wood Fiber Sci. 2007;39:307. [Google Scholar]