Abstract
We evaluated the combination of leaching techniques and melt blending of polymers and particles for the preparation of highly interconnected three-dimensional polymeric porous scaffolds for in vitro studies of human hepatocarcinoma processes. More specifically, sodium chloride and poly(ethylene glycol) (PEG) were used as water-soluble porogens to form porous and solvent-free poly(L,D-lactide) (PLA)-based scaffolds. Several characterization techniques, including porosimetry, image analysis and thermogravimetry, were combined to improve the reliability of measurements and mapping of the size, distribution and microarchitecture of pores. We also investigated the effect of processing, in PLA-based blends, on the simultaneous bulk/surface modifications and pore architectures in the scaffolds, and assessed the effects on human hepatocarcinoma viability and cell adhesion. The influence of PEG molecular weight on the scaffold morphology and cell viability and adhesion were also investigated. Morphological studies indicated that it was possible to obtain scaffolds with well-interconnected pores of assorted sizes. The analysis confirmed that SK-Hep1 cells adhered well to the polymeric support and emitted surface protrusions necessary to grow and differentiate three-dimensional systems. PEGs with higher molecular weight showed the best results in terms of cell adhesion and viability.
Keywords: biomimetic scaffolds, 3D structures, poly(lactide), poly(ethylene glycol), leaching, hepatocarcinoma
1. Introduction
Three-dimensional (3D) scaffolds are more suitable than traditional two-dimensional (2D) substrates for realistic and effective investigations of pathological and physiological processes, such as tumors, inflammatory processes and fibrosis ([1] and references herein). Cancer cells cultured in three dimensions have several features that differentiate them from monolayer cultures. For instance, before effective vascularization, the tumor growth appears to be closely reproduced in 3D culture systems, and the proliferation of tumor cells is typically slower and hence more indicative of physiological growth than that in monolayer cultures. To bridge the gap between 2D studies and in vivo animal models, the 3D culture of cancer cells in vitro has been presented in several recent studies [2–7].
Good candidate materials to prepare porous scaffolds for cell culture and proliferation are supposed to (i) allow cell growth and adhesion; (ii) produce degradation products that are not toxic or inflammatory; (iii) have adequate pore dimensions and distribution, to stimulate cell viability and nourishment/metabolites exchange; (iv) exhibit tunable biodegradation, to allow adequate cellular growth both in vitro and in vivo; (v) have surface chemical and physical properties that promote cell adhesion and proliferation and (vi) possess mechanical properties mimicking those of the real biological tissue to be replaced [8–22]. Among the different materials, synthetic polymers satisfy all the above criteria and they have been widely used to prepare substrates for cell proliferation both in vitro and in vivo [23–27].
Although the pore architecture plays a vital role in scaffold functionality, the scientific literature is unclear on the optimal size and distribution of pores. Excessively small pores inhibit cell migration and may obstruct the diffusion of nourishment and metabolites owing to the formation of a compact biofilm [28–30]. On the other hand, overly large pores, may severely inhibit cell adhesion owing to a reduced interfacial area. Therefore, an assortment of small and large pores might be adequate for the optimization of cell growth and proliferation [31–33].
The morphological evaluation of a polymeric 3D structure is a difficult task, and there is no established characterization method of pore dimensions and distribution, of the available interfacial area and of the interconnectivity. Nonetheless, useful information can be obtained by image analysis coupled with porosimetry [33–37].
Owing to their biocompatibility and modular kinetics of degradation, polylactides (PLAs) are being studied for the production of 3D structures in tissue engineering [28]. Blends of PLAs with polyethylene glycol (PEG) were extensively used to improve the biocompatibility, minimize the adsorption of proteins via steric repulsion, tune the degradation rate, improve the hydrophilicity, and enhance the flexibility, resilience and melt processability of PLAs ([38, 39] and references therein). Ever since the recognition of the antithrombogenic action of PEG, the design of most PEG-derivatized surfaces has sought to eliminate the adhesion of cells and proteins using a high surface concentration of PEG. On the other hand, lower-density PEG interactions allow protein adsorption and cell adhesion on biomaterials. Thus, the biological and regulatory behaviors of PEG-bearing surfaces are not clearly understood, particularly at low and intermediate concentrations of PEG on the surface, where conformational changes in adsorbed proteins may sensitively regulate cell adhesion processes [40, 41].
One of the most common techniques to prepare porous scaffolds is the particulate leaching method, which involves the selective leaching of a mineral or organic porogen [42–44]. Porogen is a template material that can be removed to generate pores. This method allows the control of the porosity and pore size by changing the amount and/or size of leachable particles even if it is more difficult to achieve good interconnectivity of pores. In the past, to overcome this deficiency, high porosity levels and interconnectivity were achieved by combining leaching with gas foaming [45], solvent casting [46, 47], freeze drying [48, 49] or immersion precipitation [50, 51]. More recently, melt blending of two immiscible polymers has emerged as a new method of fabricating porous scaffolds for tissue engineering, particularly by creating co-continuous blend morphologies [52, 53]. From a manufacturing view point, melt processing techniques are an economic way to prepare porous scaffolds even with complex geometries. However, the complete extraction of one of the polymer phases, using selective solvents, is possible only in the concentration range close to the phase inversion point, with a maximum porosity of 40–60% [54]. In this work, we combined polymer and particulate leaching techniques to obtain a 3D porous scaffold containing highly interconnected small and large pores. In particular, we used a partially miscible polymer system, PLA/PEG, melt-blended with NaCl, in which the salt and PEG were water-leachable porogens. Moreover, we correlated the pore architecture with the preparation conditions by changing the molecular weight of the PEG component.
Image analysis based on scanning electron microscopy detecting backscattered secondary electrons (SEM-BSEs) [55, 56] was coupled with other methods to characterize the pores in the scaffolds. The morphological results were correlated with in vitro adhesion, proliferation and viability tests critical for the further migration/differentiation in 3D structures on human SK-Hep1 hepatocarcinoma cells [57].
2. Materials and methods
2.1. Fabrication of porous 3D structures
PLA/PEG blends were prepared with or without NaCl crystals, using a batch mixer (Brabender PLE-330 T = 190 °C, t = 10 min, 64 rpm) and the following reagents.
PLA: Natureworks 2002D, density d = 1.24 g cm−3, melt flow index MFI210°C/2.16kg = 6 g per 10 min;
PEG: PEG1 (molecular weight Mw = 380–420 Da), PEG2 (Mw = 2000 Da), PEG3 (Mw = 4600 Da, Sigma Aldrich)
NaCl: ACS Reagent, ≽ 99.0%, d = 2.17 g cm−3, Sigma Aldrich, sieved to a size in the range of 500–1000 μm.
The composition was 80/20 wt% for PLA/PEGs blends and 20/5/75 for PLA/PEGs/NaCl blends. The blends were leached in boiling demineralized water for 3 h to obtain porous 3D structures.
2.2. Morphological characterization
SEM (SEM-FEI QUANTA 200F) was used to image cross sections of the scaffolds broken under liquid nitrogen. The samples were mounted on an aluminum stub using an adhesive carbon tab and sputter coated with gold (Sputtering Scancoat Six, Edwards) for 40 s under argon atmosphere before imaging. SEM images were exported as 24-bit image files using the tagged image file format (tiff) for further analysis.
2.3. Gravimetric and thermogravimetric measurements
Gravimetric measurements were performed using a 5-digit Sartorius balance on ten specimens of each type of binary and ternary blends, which were dried overnight in a vacuum oven at 55 °C to keep the moisture content constant. Thermogravimetric tests were carried out under nitrogen flow, using a Hi-Res TGA TA 2950 system.
2.4. XPS analysis of surface composition
To confirm the presence of PEG on the surface of the pores after leaching, the surface composition of the samples was investigated by X-ray photoelectron spectroscopy (XPS). The analyses were performed using an ESCALAB 220iXL spectrometer and non-monochromatized Al-Kα radiation (1486.6 eV). The working pressure was <5·10–8 Pa. The spectrometer was calibrated by assuming the binding energy (BE) of the Au 4f7/2 line at 83.9 eV with respect to the Fermi level. The standard deviation for the BE values was 0.15 eV. The reported BEs were corrected for the charging effects, assigning a value of 284.8 eV to the C1s line of adventitious carbon. Survey scans were obtained in the 0–1200 eV range, and high-resolution scans were recorded for the C1s region. The analysis involved Shirley-type background subtraction, nonlinear least-squares curve fitting, adopting Gaussian–Lorentzian peak shapes, and peak integration.
2.5. Determination of porosity and architecture of pores
One of the focuses of the present work is the application of the principles of scaffold characterization outlined in the ASTM F 2450-09 standard. Accordingly, the average size, pore distribution and surface area were evaluated by mercury porosimetry (Pascal Porosimeter 140 and 240) and by an image-based method assisted by MATLAB software.
2.5.1. Mercury porosimetry: determination of average diameter, distribution and specific surface area of pores.
To measure the pore sizes, we used the mercury penetration technique outlined in the ASTM International D4404 and D2873 guidelines, which is based on the behavior of `nonwetting’ liquids in a capillary. Ten samples for each type of scaffold were cut at different distances from the outer surface, after breaking the scaffolds in liquid nitrogen to have a random distribution of the surface types. Assuming cylindrical pores, the relationship between the pore size and applied pressure is expressed using the Washburn equation [58]:
where P is applied pressure, r is pore radius, χ is mercury surface tension and θ is contact angle. Considering a mercury surface tension of 480 mN m−1 (average value between 25 and 50 °C) and an average value of mercury contact angle of 141.3°, and assuming that all pores are cylindrical, equation (1) yields:
2.5.2. MATLAB image processing method.
The porosity was evaluated by processing the images obtained by SEM-BSE with MATLAB software (Mathworks Inc). Images were cropped to the scaffold area and then segmented, based on a single grayscale threshold. The porosity was calculated from the ratio of pixels assigned to the porous phase to the total number of image pixels (see scheme 1). This process was repeated by stepping the grayscale threshold over the full range of the image grayscale, to study the effect of threshold value on porosity calculations.
Scheme 1.

Schematic of image processing for a ternary blend PLA/PEG3/NaCl: (a) original SEM image, (b) local gradient of intensity, (c) image obtained by overlapping the gradient and intensity information and (d) binary image.
2.6. Biological tests
2.6.1. Cell culture.
Human SK-Hep1 hepatocarcinoma cells were grown in Dulbecco's modified Eagle's medium (DMEM) supplemented with 10% fetal calf serum (FCS; Euroclone, Celbio), 1% antibiotic and 1% glutamine (Euroclone, Celbio).
2.6.2. SK-Hep1 cell viability.
SK-Hep1 cells were enzymatically detached from the culture plate where they were grown with/without scaffolds after 48/72 h, using a solution of Trypsin-EDTA 1X (Sigma), centrifuged at 800g for 5 min and added to phosphate-buffered saline (PBS) at a concentration of 5 × 10⁵ cells ml−1. A solution to test cell viability was prepared by mixing 0.5 ml of 0.4% trypan blue with 0.3 ml of PBS and 0.2 ml of cell solution. Samples were incubated for 10 min at room temperature and counted in a Burker's chamber. Trypan blue—a dye that discriminates between viable and dead cells—was absorbed only from dead cells.
2.6.3. Apoptotic assay by acridine orange-ethidium bromide staining.
SK-Hep1 cells were plated on scaffolds pretreated with type I collagen (Sigma, 50 μg ml−1) in 0.02 N acetic acid, neutralized to physiologic pH, and grown in DMEM. To evaluate the presence of apoptotic cells and, therefore, the possible effects of cytotoxicity of the scaffolds, the cells were stained with a 100 μg ml−1 solution of acridine orange-ethidium bromide (EtBr) in PBS for 10 s. The cells were observed using a confocal microscope (Olympus 1X70) equipped with two Melles Griot lasers.
2.6.4. SK-Hep1 cell extraction.
Sk-Hep1 cells were seeded at high density on a six-well plate in the presence of the scaffolds as previously described, then they were grown for 72 h in complete medium. Subsequently, the cells were enzymatically detached from the culture plate using a solution of Trypsin-EDTA 1X (Sigma) and centrifuged at 800g for 5 min; the pelletted cells were added to 70 μl of PBS containing 1% Triton X-100, then incubated for 10 min at room temperature; the suspensions were centrifuged at 10 600g for 10 min to extract cell proteins. The pellet containing the cellular nonprotein portion was removed, and the amount of extracted proteins contained in the supernatant was evaluated using the Bradford microassay method (Bio-Rad, Segrate, Milan, Italy) with bovine serum albumin (Sigma-Aldrich) as a standard.
2.6.5. Caspase 3 enzymatic assay on synthetic fluorescent substrate.
SK-Hep1 cells were grown for 72 h in the presence of scaffolds having PEG conjugates of different molecular weights; the cells were extracted as described above, and 20 μg of each extract was used to detect the presence of caspase 3 in different samples. We used SK-Hep1 cells treated with doxorubicin (an apoptosis inducer), 10 μM for 4 h, as a positive control, and SK-Hep1 cells grown in the absence of scaffolds as a negative control.
Caspase 3 activity was evaluated using the Ac.Asp-Glu-Val-Asp-MCA (PeptaNova, Peptide Institute, Inc) peptide, a specific substrate for active caspase 3, which has its cutting site conjugated to a fluorophore that emits fluorescence when cut by the enzyme. These experiments were performed in a 96-well plate with 75 μl (8 μM) of substrate. Enzymatic activity was evaluated by spectrofluorimetry. The measurements were performed using a Spectra Max Gemini EM-500 system (Molecular Devices) and processed using Soft Max Pro 5.2 software.
2.6.6. Cell adhesion within scaffolds.
Some scaffolds prepared with PEGs of different molecular weights were pretreated with type I collagen (Sigma, 50 μg m−1) in 0.02 N acetic acid for 2 h at 37 °C, neutralized by adding complete medium, and then used in cell adhesion experiments.
SK-Hep1 cells were seeded on each scaffold and grown in complete medium for 48 h. To evaluate the cell adhesion, scaffolds were fixed in 4% formaldehyde and then stained with phalloidin-FITC (1:500), a specific marker for actin cytoskeleton structures (from Amanita phalloides (Sigma) for 15 min). The nuclei were stained with ethidium bromide (EtBr, a DNA-intercalating molecule) (1:1000; Sigma) for 5 min. Observations were carried out by confocal microscopy.
2.6.7. Morphological analysis.
SK-Hep1 cells were cultured as described in section 2.6.1 to assess their morphology when adhering to scaffolds. They were fixed in 4% formaldehyde, labeled with the primary antibody anti-β1-integrin (a rat monoclonal C27 antibody 1:300) for 24 h and eventually revealed by a secondary antibody (Anti-RAT-FITC, 1:320, Sigma) [59]. Cells were observed by confocal microscopy at 60 × magnification.
3. Results and discussion
3.1. Scaffold preparation and characterization
Figure 1 shows a selection of SEM images of the studied systems. The morphology of the PLA (figure 1(a)) is consistent with that of a brittle fractured material. When PEG1 is added to PLA (figure 1(b)), the morphology becomes typical of binary immiscible polymer blends, with two distinct phases and large domains of PEG dispersed in the PLA matrix.
Figure 1.
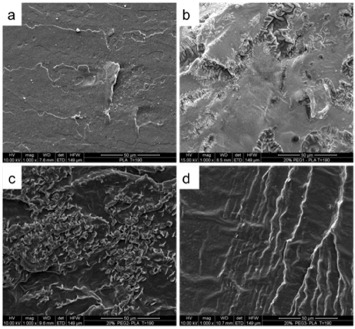
SEM images of (a) PLA and of the 80/20 blends of (b) PLA/PEG1, (c) PLA/PEG2 and (d) PLA/PEG3.
Note, however, that the adhesion between the two phases is good as no voids at the interface and no PEG pullout could be detected, at least at this magnification. The same morphology is observed when PEG2 is used (figure 1(c)), whereas when PEG3 is added (figure 1(d)), the system is monophasic. This unusual behavior was already observed and studied by other authors [32, 33]. PLA and PEG are miscible in particular ranges of concentration and temperature. Out of this miscibility range, the aggregation and phase separation follow a kinetic that depends on the thermal history and molecular weight of PEG. In particular, lower molecular weight and higher temperatures promote reaggregation [60, 61]. In our case, the thermal history was the same for all the samples, whereas the PEG molecular weight varied significantly. As shown by SEM micrographs, PEGs with the lowest (PEG1) and intermediate (PEG2) molecular weights have a sufficient mobility to migrate and reaggregate, thus forming large domains of a separated phase. In contrast, the PEG with the highest molecular weight does not have enough time to migrate and reaggregate. In this case, the two phases remain almost indistinguishable at our observation scale. While this issue is critical for the preparation of scaffolds with controlled porosity, its investigation requires a systematic study of the effect of time and temperature on the phase behavior of these specific blends, which is beyond the scope of this paper.
The morphology of PLA/PEG/NaCl systems is markedly multiphasic, with crystals variously dispersed within the PLA matrix. Figure 2 shows the SEM images of the cross sections of cryogenically broken PLA/PEG samples (i.e. scaffold core), with and without salt, after leaching in boiling demineralized water for 3 h.
Figure 2.
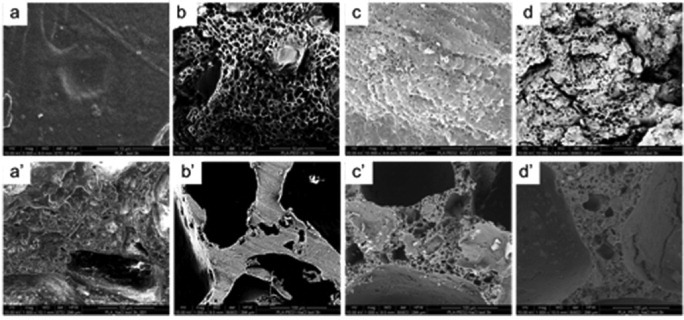
SEM images of leached materials: (a) PLA, (b) PLA/PEG1, (c) PLA/PEG2, (d) PLA/PEG3, (a') PLA/NaCl (25/75), (b') PLA/PEG1/NaCl (20/5/75), (c') PLA/PEG2/NaCl (20/5/75) and (d') PLA/PEG3/NaCl (20/5/75). Scale bars are 10 μm for top row and 100 μm for the bottom row.
The morphology of leached PLA (figure 2(a)) is similar to that of untreated PLA (see figure 1(a)). In contrast, leached PLA/PEGs blends (figures 2(b)–(d)) show a porous morphology, with pores regularly distributed over the surface and with apparently similar submicron dimensions. Note that even the PLA/PEG3 blend shows pores of dimensions comparable to those observed in the other blends. This observation agrees with the explanation proposed above for describing the morphology of the unleached blend. According to [60 and 61], 3 h at 100 °C (i.e. long time and high temperature) likely caused the migration and reaggregation of the PEG phase into droplets dispersed in the PLA matrix even when the highest-molecular-weight PEG was used. This phase separation is eventually responsible for the pore formation, since PEG is soluble in water. In other words, the conditions adopted for leaching the blends caused a complete phase separation between PLA and PEG, and the final pore size was only dependent on the initial PEG content. This observation corroborates the interpretation of the morphology of PLA/PEG3 blends given above.
When NaCl is added (figures 2(a')–(d')), the morphology becomes distinctly different. In leached PLA/NaCl blends, it is easy to identify unleached salt particles dispersed in the PLA matrix, whereas no pores are observed. In contrast, pores of various sizes are clearly visible in the PEG-containing systems. This different morphology, in the presence of PEG, can be attributed to the dissolution of superficial PEG in water during leaching; this allows water penetration deeper inside the core of the structure, assisting the solubilization of the incorporated salt. This is not possible when only PLA is used: as this polymer is insoluble in water, only the superficial salt can be leached, and therefore NaCl grains can still be found in the core of the leached material (see figure 2(a')).
These results are confirmed by weight loss measurements after leaching: the binary blend, although it contains 75 wt% of the leachable phase, shows only 50% weight loss, i.e. some salt remains unsolubilized. In contrast, the ternary PLA/PEG/NaCl blend exhibits a weight loss of about 78%, very close to the theoretical value of 80 wt%. This result confirms that PEGs and NaCl cooperate during leaching by driving water to the scaffold core.
To elaborate on this issue, thermogravimetric analysis was performed on both binary and ternary blends, before and after leaching. The weight percentages of residues at 600 °C are listed in table 1, and figure S1 (see supporting information, online supplementry data available from stacks.iop.org/STAM/13/045003/mmedia) shows weight loss and derivative weight loss as a function of temperature for a PLA/PEG3/NaCl blend before and after leaching. All the unleached blends contain about 75 wt% NaCl-related residues, demonstrating that a good dispersion of the salt was achieved during processing. After leaching, the residues of the ternary blends are all ∼1%, confirming that almost all the salt was effectively removed during the treatment.
Table 1.
Residues at 600 °C of binary and ternary blends before and after leaching for 3 h.
| Sample | Residues (%) | |
|---|---|---|
| Before | PLA/NaCl | 75.3±0.3 |
| After | (25:75) | 26±5 |
| Before | PLA/PEG1/NaCl | 75.0±0.5 |
| After | (20:5:75) | 1.0±0.2 |
| Before | PLA/PEG2/NaCl | 74.9±0.3 |
| After | (20:5:75) | 1.4±0.2 |
| Before | PLA/PEG3/NaCl | 75.2±0.2 |
| After | (20:5:75) | 1.1±0.1 |
Considering that the PLA/PEG systems had residues of about 0.2–0.3% (data not discussed here for brevity), it can be concluded that only about 0.6–0.7% of salt remains in the scaffold. The situation is different for the binary blend. In this case, the residue after leaching is about 25% and the scattering of data is the highest. Both features confirm the previous observations, namely that in PLA/NaCl blends, only the surface salt can be leached. As the pores are formed only by the progressive and sequential solubilization of NaCl, depending on the structure and depth of the percolated network formed by NaCl crystals, a larger or smaller amount of salt is leached. This explanation can also account for the large amount of residue and high data scattering for this blend. Note that all these data agree well with the weight loss measurements reported above.
The three different PEG-containing systems show different pore morphologies, suggesting that, by changing the molecular weight of PEG, it is possible to control the pore size and distribution in the final leached structure. The variety of pore sizes can be explained as follows: once solubilized, PEG yields small pores whereas the large ones are derived from the large NaCl crystals present in the structure (see, for instance, figure 2(b')). To describe the architecture of the porous structures, it is necessary to evaluate both the size and interconnection of the pores. As mentioned in the introduction, both properties are essential for a material appropriate for growing cells. However, their measurement is difficult and requires different methodologies.
Table 2 summarizes results obtained by mercury porosimetry for the leached PLA/NaCl and ternary blends. The PLA/NaCl blend has the lowest total porosity, in agreement with the SEM analysis. In this case, the salt is hardly leached and only a few superficial pores can be formed. The blend containing PEG1 broke during testing, and thus, the results are not shown. Note that, considering the total salt leaching, the maximum theoretical porosity is about 63.2 vol.% (calculated taking densities as 1.24 g cm−3 for PLA and 2.17 g cm−3 for NaCl, see Materials and methods section), whereas the measured values are slightly lower. The average pore diameter is very low for PLA/NaCl, confirming that only small superficial NaCl inclusions were leached. The pore diameter is, in contrast, higher for PEG2- and PEG3-containing blends.
Table 2.
Porosimetry results for NaCl-containing scaffolds.
| Scaffold | Porosity (%) | Cumulative volume (mm3 g−1) | Average pore diameter (μm) |
|---|---|---|---|
| PLA/NaCl (25:75) | 48±9 | 487±115 | 5.0±1.5 |
| PLA/PEG2/NaCl (20:5:75) | 50±6 | 701±80 | 94±10 |
| PLA/PEG3/NaCl (20:5:75) | 53±5 | 1401±100 | 10±1 |
Mercury porosimetry can estimate the average pore size and total porosity, and its limitations are intrinsic to the measurement procedure, as described below. The sample is placed in the dilatometer, which was calibrated with a known volume of mercury, and the sample volume is calculated by immersion in mercury. From the weight, it is then possible to calculate the apparent density and total porosity. By applying increasing pressure, it is possible to determine the fraction of pores with a certain diameter using equation (2), whereas the total cumulative volume of pores is calculated from the total volume of mercury penetrated into the sample. Whereas the measurement of the total porosity is reasonably reliable (it can be slightly underestimated owing to superficial pores or cavities present on the sample), the pore diameter and total cumulative volume of pores can be affected by significant errors. A correct pore size measurement would imply that larger pores are connected only with smaller ones from the outside to the inside of the specimen, so that mercury gradually penetrates into the structure (see scheme 2(a)).
Scheme 2.
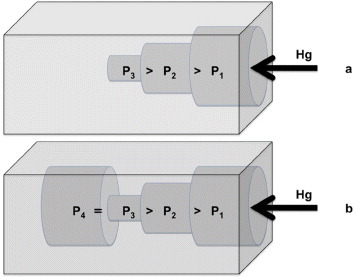
Penetration of mercury into pores during the porosimetry test: (a) correct and (b) incorrect pore size measurement that underestimates the pore size. During depressurization, mercury remains entrapped in the pore P4, generating hysteresis.
In reality, large and small pores are randomly distributed in the specimen. For instance, inner large pores connected with outer small pores will be detected only at high pressures, i.e. they will be counted as small pores when they are not (scheme 2(b)). This can be checked by depressurizing the sample and observing the recovery of the mercury volume. In our case, all the samples exhibited a pronounced hysteresis, thus suggesting that the average diameter of pores was underestimated. Additional error originates from the assumption of cylindrical pores in the Washburn equation. Note that the measurement of the smallest pores requires high applied pressures, which can break the sample as in the case of for the PLA/PEG1/NaCl blend.
While other samples did withstand the test, they underwent hydrostatic deformation that affected the final measured values. All these issues explain the differences with the direct and objective measurements of total porosity by weight loss and TGA. It can be concluded that porosimetry is only a quick and very approximate method of evaluating porosity.
To obtain quantitative information about the pore sizes and their distribution, the above-described measurements were complemented with SEM image analysis. SEM images provide direct and reliable data, but only for a limited area of a specific cross section.
Figure 3 shows the pore size distribution of leached PLA/PEG (b–d), PLA/PEG/NaCl (b'–d'), PLA and PLA/NaCl blends. Leached PLA (figure 3(a)) does not show any pores as it is not soluble in water, i.e. not leachable. In PLA/NaCl (figure 3(a')), about 80% of pores have a diameter in the range of 0–50 μm, and the fraction of larger pores is small. Blends containing PEG show a wider variety of pore sizes, and the pores are larger on average. In the PLA/PEG1 blend (figure 3(b)), about 80% of the pores are larger than 1 μm and about 15% are smaller than 200 μm, whereas in PEG2- and PEG3-containing blends (figures 3(c) and (d)), the fraction of smaller pores is higher: about 20% below 200 μm in PLA/PEG2 and about 35% below 200 μm in PLA/PEG3. This analysis suggests that the pore size decreases with increasing molecular weight of PEG.
Figure 3.
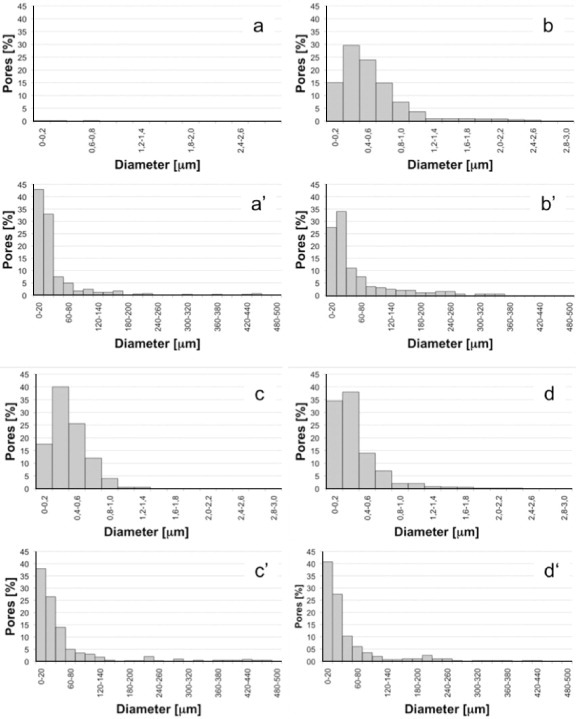
Distribution of pores of leached blends obtained by SEM image analysis: (a) PLA, (a') PLA/NaCl, (b) PLA/PEG1, (b') PLA/PEG1/NaCl, (c) PLA/PEG2, (c') PLA/PEG2/NaCl, (d) PLA/PEG3 and (d') PLA/PEG3/NaCl.
This result can be explained considering that, in the binary blends, pores are generated exclusively by direct solubilization of PEG. As a partial conclusion after this set of tests, the pore formation may include the following steps: (i) reaggregation of PEG into larger domains; (ii) their migration to the sample surface and (iii) solubilization. A higher mobility of PEG (i.e. lower molecular weight) results in larger domains and, consequently, smaller pores. An alternative explanation of these data is that the mixing torque increases with molecular weight of PEG. This increase is directly correlated with the increase in the melt viscosity that promotes the breakage of PEG droplets in the PLA matrix. Therefore, the higher the molecular weight, the higher the melt viscosity, the smaller the PEG particles and, consequently, the smaller the final pore size. Figure 4 shows the mixing torque of the binary blends as a function of mixing time. The mixing torque increases with increasing PEG molecular weight (PEG1 <PEG2 <PEG3), in agreement with the above discussions and with the analysis of figures 3(b)–(d).
Figure 4.
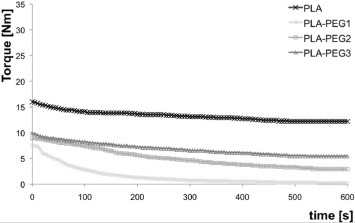
Mixing torque as a function of time for 80/20 wt% PLA/PEG blends.
Similar considerations hold for the ternary blends. In this case, large pores with sizes of hundreds of microns coexist with smaller pores. The larger pores were likely produced by the NaCl inclusions, whereas the smaller ones by PEG (as in the binary blends) and/or by NaCl crystals broken during processing. According to the mechanism proposed for the ternary blends, these crystals break extensively with increasing mixing torque.
Figure 5 shows the mixing torque of PLA/NaCl and ternary blends as a function of mixing time. The highest torque is observed for the PLA/NaCl system. The torques of the PEG-containing blends follow the tendency reported for the binary blends: PEG1 <PEG2 <PEG3. Again, there is a clear correlation between the mixing torque, the particle size and, after leaching, the pore size.
Figure 5.
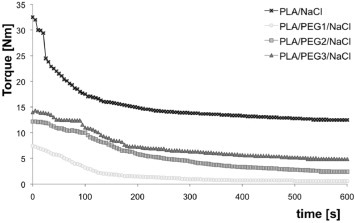
Mixing torque as a function of time for 20/5/75 wt% PLA/PEG/NaCl blends.
The smallest pores are found in the PLA/NaCl blends (the fraction of pores in the range 0–60 μm is about 83%) followed by PEG3-containing blends (79%), PEG2 (77%) and PEG1 (73%). The presence of large pores and small pores in the same structure favors the use of these materials as scaffolds for tissue engineering.
3.2. Biocompatibility of SK-Hep1 cell with PLA/PEGs composite scaffolds
To evaluate the cytocompatibility of PLA/PEG scaffolds, we first tested, in the apoptotic/necrotic sense, the morphology and viability of the cells grown in the presence of the scaffolds.
As shown in figure 6(A), SK-Hep1 cells cultured on scaffolds containing PEG2 (figures 6(A) b, b') and PEG3 (figures 6(A) c, c') are the same as in the control (figures 6B a, a') in which cells were cultured directly on a culture plate. In contrast, SK-Hep1 cells cultured together with the apoptosis inducer doxorubicin showed (figures 6(A) a, a' and (B) b, b') the classical morphological changes associated with apoptotic cells. The same assay was also carried out on PLA- and PLA/PEG1-based scaffolds. From figures 6(B) c, c' and d, d', it is evident that those scaffolds do not induce cytotoxicity. At the same time, it was not possible to observe cells within PLA scaffolds or on scaffold surfaces without PEG. As confirmed from the scientific literature, hydrophobic PLA does not permit cell adhesion and growth [62].
Figure 6.
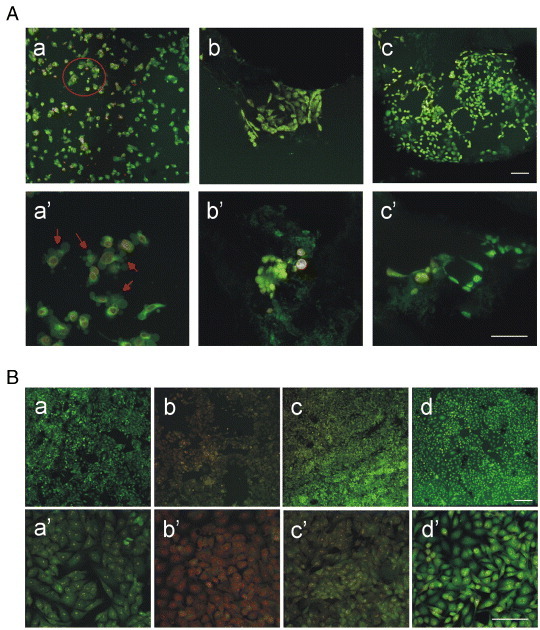
Viability by acridine orange/EtBr staining and morphology of SK-Hep1 cells on PLA/PEG scaffolds. (A) SK-Hep1 cells were cultured in the presence of 10 μM doxorubicin on plastic (A a–a') and on scaffolds conjugated with PEG2 (A b–b') and PEG3 (A c–c'). The magnification is 10 × in panels a–c and 40 × in panels a'–c'. Part of panel A a is magnified in A a', with arrows showing apoptotic bodies. Scale bars correspond to 30 μm. (B) SK-Hep1 cells were cultured in flasks in the presence of scaffolds without PEG (B c-c') or with PEG1 (B d–d'); SK-Hep1 cells cultured directly in the well (B a–a') were used as the negative control, and SK-Hep1 cells treated with 10 μM doxorubicin (B b–b') as the positive control. Magnification is 10 × in a–d and 40 × in a'–d'; scale bars are 30 μm.
Scaffolds with PEG1 exhibit good morphology and adhesion to the polymeric substrate, and only in a few cases cells colonized the inner part of the scaffold (figure 7). On the basis of these results, PEG1-based scaffold did not qualify for the subsequent adhesion tests that were performed only on PLA PEG2 and PLA PEG3 based scaffolds.
Figure 7.

SK-Hep1 cells cultured for six days on scaffolds based on PEG1 (a), PEG2 (b) and PEG3 (c). Cells were labeled using phalloidin-FITC (green) and EtBr (red); magnification 40 × , scale bars 30 μm.
PEG1 is a plasticizer with the lowest molecular weight (380–420 Da). Because of this feature, it is more soluble in water and its migration to the structure surface is therefore faster. Consequently, little superficial PEG1 remains inside the PEG1-based scaffolds after leaching in boiling water for 3 h. To test this hypothesis, XPS measurements were carried out on the ternary blends. Table 3 lists the area ratios of the deconvoluted C1s peaks attributed to PEG (C–O) and PLA ( –O).
–O).
Table 3.
Ratios of  (PEG/PLA) areas from deconvoluted high-resolution C1s XPS spectra for the leached ternary blends.
| Sample |  |
|---|---|
| PLA/PEG1/NaCl | ∼0 |
| PLA/PEG2/NaCl | 0.64 |
| PLA/PEG3/NaCl | 2.02 |
The amount of superficial PEG was negligible in PEG1 and significant in PLA/PEG2 and PLA/PEG3 scaffolds, which confirms the above interpretation.
Concerning cell viability, only about 3% of the cells physiologically died during the culture, independent of the presence of scaffolds (figure 8(B)).
Figure 8.
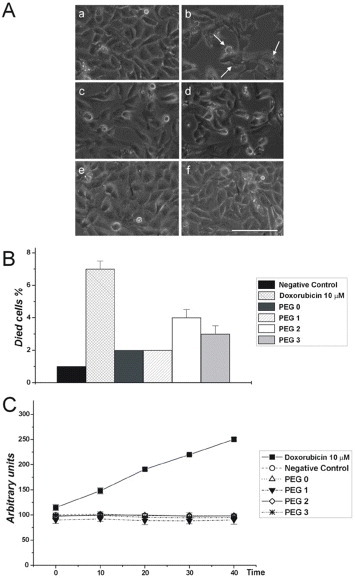
Morphological, quantitative and enzymatic evaluation of SK-Hep1 cell viability. (A) SK-Hep1 cells cultured on plate (negative control) (a), in the presence of 10 μM doxorubicin for 48 h (positive control) (b) or in the presence of scaffold containing (c) no PEG, (d) PEG1, (e) PEG2 or (f) PEG3. The images were analyzed to evaluate the presence of apoptotic nuclei and/or structures. In (b) arrows show apoptotic bodies indicating the action of doxorubicin. Bar = 50 μm. (B) SK-Hep1 cells cultured on plastic (negative control), in the presence of 10 μM doxorubicin (positive control), on scaffold without PEG or containing PEG1, PEG2 or PEG3, were evaluated by trypan blue staining to determine the percentage of dead cells. (C) Spectrofluorimetry analysis of caspase 3 activation under different cell culture conditions. The amount of enzymatically active caspase 3 was evaluated in extracts obtained by untreated cells (negative control), cells cultured in the presence of 10 μM doxorubicin, cells cultured on scaffolds without PEG or with PEG1, PEG2 or PEG3. The fluorochrome extinction value is plotted in arbitrary unit vs time.
To further validate these data, we performed an enzymatic assay using a specific substrate for caspase 3. Caspases are a family of cysteine proteases involved in programmed cell death. In particular, caspases 3, 8 and 9 are apoptotic caspases; they are sensitive to most apoptosis inducers. As shown in figures 8A–C, cell growth in the presence of the analyzed scaffolds did not exhibit caspase activation. In contrast, caspase 3 activation was detected in cells induced by doxorubicin (the positive control). As indicated above (figure 7), owing to the low affinity of the cells to PEG1-based scaffolds, cell adhesion tests were performed only on PEG2- and PEG3-based scaffolds. SK-Hep1 cells were plated on scaffolds, some of which were pretreated with type I collagen, to correlate the degree of cell adhesion with the presence of either PEG or more permissive substrates like type I collagen. As shown in figure 9(A), SK-Hep1 cells well adhered to the scaffolds, and there is no significant difference between the untreated and pretreated substrates. This result suggests that the presence of PEG on the surface is sufficient for adequate cell adhesion to the polymeric matrix, in agreement with previous studies [40, 41].
Figure 9.
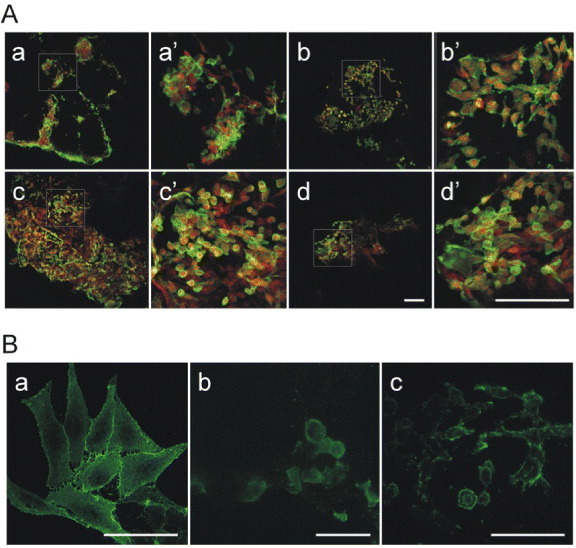
SK-Hep1 cell adhesion on PLA/PEG scaffolds. (A) SK-Hep1 cells cultured on (a) PLA/PEG2 scaffold pretreated with type I collagen solution, (b) on untreated PLA/PEG2 scaffold, (c) on PLA/PEG3 scaffold pretreated with type I collagen solution and (d) on untreated PLA/PEG3 scaffold. The cells were stained with a solution of phalloidin-FITC and EtBr. Panels (A) a'–d' are magnifications of the squared areas in (A) a–d. Bar = 50 μm. (B) SK-Hep1 cell morphology when cultured on plastic (a), on PLA/PEG2 (b) and PLA/PEG3 (c). Cell plasma membrane surfaces were stained with a primary antibody against β1-integrin and secondary FITC-conjugated antibody to reveal the cell adhesion and spreading on different surfaces. Bar = 20 μm.
The morphological analysis (figure 9(B)) performed after 48 h of culture on the scaffolds confirmed that the cells well adhered to the polymeric support. As highlighted in (figures 9(B) b, c), the cells begin to emit cell surface protrusions evidenced by β1-integrin localization and needed to grow and differentiate into a 3D system.
4. Conclusions
We have prepared biomimetic, porous, PLA-based 3D scaffolds by combining melt mixing and leaching techniques to study in vitro human hepatocarcinoma. PEG and NaCl were melt blended with PLA to form leachable porogens. Leaching of binary PLA/NaCl blends leaves significant NaCl residue in the scaffold core. However, when PEG is added, almost all the salt is leached, yielding an interconnected porous structure with a variety of large and small pores. The mechanism of pore formation involves a sequential solubilization of PEG and NaCl that cooperate to bring the water deep into the scaffold core during the leaching. The higher molecular weight of the added PEG results in smaller pores owing to an increased melt viscosity (i.e. higher stresses), which reduces the size of PEG droplets and fractionates NaCl crystals during processing. The scaffolds are not toxic to the human hepatocarcinoma cells for any type of PEG. However, the overall biocompatibility of the scaffolds depends on the presence of residual PEG on the pore surface, as the PEG affects the hydrophilicity of the substrate. In this sense, PEG1 was almost absent on the scaffold surface whereas detectable amounts of PEG2 and PEG3 were found. There is a direct correlation between viability, morphology and adhesion with PEG molecular weight (PEG3 > PEG2 > PEG1): the lower the molecular weight, the higher the mobility and solubility and the lower the amount of residue on the surface. This result indicates that cell adhesion processes can be regulated by depositing low concentrations of different PEGs on the scaffold surface. The scaffolds containing PEG2 and PEG3 showed adhesive capabilities comparable to those obtained when scaffolds are treated with extra cellular matrix components as type I collagen. Our results demonstrate the potential of these scaffolds for the studies on human hepatocarcinoma processes on a realistic 3D substrate.
Acknowledgment
This work was financially supported by the Ministero dell'Istruzione, Università e Ricerca (Italy), PON_01_01287.
References
- Hutmacher D W. Nature Mater. 2010;9:90. doi: 10.1038/nmat2619. [DOI] [PubMed] [Google Scholar]
- Lutolf M P. Nature Mater. 2009;8:451. doi: 10.1038/nmat2458. [DOI] [PubMed] [Google Scholar]
- Moreau J E, Anderson K, Mauney J R, Nguyen T, Kaplan D L. and Rosenblatt M. Cancer Res. 2007;67:10304. doi: 10.1158/0008-5472.CAN-07-2483. [DOI] [PubMed] [Google Scholar]
- Hutmacher D W, Loessner D, Rizzi S, Kaplan D L, Mooney D J. and Clements J A. Trends Biotechnol. 2010;28:125. doi: 10.1016/j.tibtech.2009.12.001. [DOI] [PubMed] [Google Scholar]
- Talukdar S, Mandal M, Hutmacher D W, Russell P J, Soekmadji C. and Kundu S C. Biomaterials. 2011;32:2149. doi: 10.1016/j.biomaterials.2010.11.052. [DOI] [PubMed] [Google Scholar]
- Loessner D, Stok K S, Lutolf M P, Hutmacher D W, Clements J A. and Rizzi S C. Biomaterials. 2010;31:8494. doi: 10.1016/j.biomaterials.2010.07.064. [DOI] [PubMed] [Google Scholar]
- Reichert J C, Quent V M C, Burke L J, Stansfield S H, Clements J A. and Hutmacher D W. Biomaterials. 2010;31:7928. doi: 10.1016/j.biomaterials.2010.06.055. [DOI] [PubMed] [Google Scholar]
- Freed L E, Marquis J C, Nohria A, Emmanual J, Mikos A G. and Langer R. J. Biomed. Mater. 1993;27:11. doi: 10.1002/jbm.820270104. [DOI] [PubMed] [Google Scholar]
- Hou Q, Grijpma D W. and Feijen J. Biomaterials. 2003;24:1937. doi: 10.1016/S0142-9612(02)00562-8. [DOI] [PubMed] [Google Scholar]
- Karageorgiou V. and Kaplan D. Biomaterials. 2005;26:5474. doi: 10.1016/j.biomaterials.2005.02.002. [DOI] [PubMed] [Google Scholar]
- Murphy C M, Haugh M G. and O'Brien F J. Biomaterials. 2010;31:461. doi: 10.1016/j.biomaterials.2009.09.063. [DOI] [PubMed] [Google Scholar]
- Silva G A, Czeisler C, Niece K L, Beniash E, Harrington D A, Kessler J A. and Stupp S I. Science. 2004;303:1352. doi: 10.1126/science.1093783. [DOI] [PubMed] [Google Scholar]
- Pattison M A, Wurster S, Webster T J. and Haberstroh K M. Biomaterials. 2005;26:2491. doi: 10.1016/j.biomaterials.2004.07.011. [DOI] [PubMed] [Google Scholar]
- Freed L E, Vunjak-Novakovic G, Biron R, Eagles D B, Lesnoy D C, Barlow S K. and Langer R. Nature Biotechnol. 1994;12:689. doi: 10.1038/nbt0794-689. [DOI] [PubMed] [Google Scholar]
- Peppas N. and Langer R. Science. 1994;263:1715. doi: 10.1126/science.8134835. [DOI] [PubMed] [Google Scholar]
- Mitragotri S. and Lahann J. Nature Mater. 2009;8:15. doi: 10.1038/nmat2344. [DOI] [PMC free article] [PubMed] [Google Scholar]
- Guimard N K, Gomez N. and Schmidt C E. Prog. Polym. Sci. 2007;32:876. doi: 10.1016/j.progpolymsci.2007.05.012. [DOI] [Google Scholar]
- Xie J, MacEwan M R, Willerth S M, Li X, Moran D W, Sakiyama-Elbert S E. and Xia Y. Adv. Funct. Mater. 2009;19:1. doi: 10.1002/adfm.200801904. [DOI] [PMC free article] [PubMed] [Google Scholar]
- Bettinger C J, Bruggeman J P, Misra A, Borenstein J T. and Langer R. Biomaterials. 2009;30:3050. doi: 10.1016/j.biomaterials.2009.02.018. [DOI] [PMC free article] [PubMed] [Google Scholar]
- Burdick J A. and Vunjak-Novakovic G. Tissue Eng. A. 2009;15:205. doi: 10.1089/ten.tea.2008.0131. [DOI] [PMC free article] [PubMed] [Google Scholar]
- Mastro A M. and Vogler E A. Cancer Res. 2009;69:4097. doi: 10.1158/0008-5472.CAN-08-4437. [DOI] [PubMed] [Google Scholar]
- Martin I, Smith T. and Wendt D. Trends Biotechnol. 2009;27:495. doi: 10.1016/j.tibtech.2009.06.002. [DOI] [PubMed] [Google Scholar]
- Hollister S J. Nature Mater. 2005;4:518. doi: 10.1038/nmat1421. [DOI] [PubMed] [Google Scholar]
- Lutolf M P. and Hebbell J A. Nature Biotechnol. 2005;23:47. doi: 10.1038/nbt1055. [DOI] [PubMed] [Google Scholar]
- Stevens M M. and George J H. Science. 2005;310:1135. doi: 10.1126/science.1106587. [DOI] [PubMed] [Google Scholar]
- Hutmacher D W. Biomaterials. 2000;21:2529. doi: 10.1016/S0142-9612(00)00121-6. [DOI] [PubMed] [Google Scholar]
- Yannas I V. Adv. Biochem. Eng. Biothecnol. 2005;41:141. [Google Scholar]
- Shoichet M S. Macromolecules. 2010;4:581. doi: 10.1021/ma901530r. [DOI] [Google Scholar]
- O'Brien F J, Harley B A, Yannas I V. and Gibson L J. Biomaterials. 2005;26:433. doi: 10.1016/j.biomaterials.2004.02.052. [DOI] [PubMed] [Google Scholar]
- Harley B A C, Kim H-D, Zaman M H, Yannas I V, Lauffenburger D A. and Gibson L J. Biophys. J. 2008;95:4013. doi: 10.1529/biophysj.107.122598. [DOI] [PMC free article] [PubMed] [Google Scholar]
- Karageorgiou V. and Kaplan D. Biomaterials. 2005;26:5474. doi: 10.1016/j.biomaterials.2005.02.002. [DOI] [PubMed] [Google Scholar]
- Murphy C A, Haugh M G. and O'Brien F J. Biomaterials. 2010;31:461. doi: 10.1016/j.biomaterials.2009.09.063. [DOI] [PubMed] [Google Scholar]
- Peroglio M, Gremillard L, Gauthier C, Chazeau L, Verrier S, Alibi M. and Chevalier J. Acta Biomater. 2010;6:4369. doi: 10.1016/j.actbio.2010.05.022. [DOI] [PubMed] [Google Scholar]
- Mather M L, Morgan S P, White L J, Tai H, Kockenberger W, Howdle S M, Shakesheff K M. and Crowe J A. Biomed. Mater. 2008;3:1. doi: 10.1088/1748-6041/3/1/015011. [DOI] [PubMed] [Google Scholar]
- Melissa L, Mather M L, Crowe J A, Morgan S P, White L J, Kalashnikov A N, Ivchenko V G, Howdle S M. and Shakesheff K M. J. Mater. Sci. Mater. Med. 2008;19:3071. doi: 10.1007/s10856-008-3445-y. [DOI] [PubMed] [Google Scholar]
- Yang Z, Peng X F, Lee D J. and Chen M Y. Environ. Sci. Technol. 2009;43:3248. doi: 10.1021/es900097e. [DOI] [PubMed] [Google Scholar]
- Torres-Sanchez C. and Corney J R. Smart Mater. Struct. 2009;18:1. doi: 10.1088/0964-1726/18/10/104001. [DOI] [Google Scholar]
- Jeon S I, Lee J H, Andrade J D. and de Gennes P G. J. Colloid Interface Sci. 1991;142:149. doi: 10.1016/0021-9797(91)90043-8. [DOI] [Google Scholar]
- Rasal R M, Janorkar A V. and Douglas E H. Prog. Polym. Sci. 2010;35:338. doi: 10.1016/j.progpolymsci.2009.12.003. [DOI] [Google Scholar]
- Tziampazis E, Kohn J. and Moghe P V. Biomaterials. 2000;21:511. doi: 10.1016/S0142-9612(99)00212-4. [DOI] [PubMed] [Google Scholar]
- Chen H, Yuan L, Song W, Wu Z. and Li D. Prog. Polym. Sci. 2008;33:1059. doi: 10.1016/j.progpolymsci.2008.07.006. [DOI] [Google Scholar]
- Thomson R C, Yaszemski M J, Powers J M. and Mikos A G. J. Biomater. Sci. Polym. Ed. 1995;7:23. doi: 10.1163/156856295X00805. [DOI] [PubMed] [Google Scholar]
- Hou Q, Grijpma D W. and Feijen J. Biomaterials. 2003;24:1937. doi: 10.1016/S0142-9612(02)00562-8. [DOI] [PubMed] [Google Scholar]
- Mikos A G, Thorsen A J, Czerwonka L A, Bao Y, Langer R, Winslow D N. and Vacanti J P. Polymer. 1994;35:1068. doi: 10.1016/0032-3861(94)90953-9. [DOI] [Google Scholar]
- Nam Y S, Yoon J J. and Park T G. J. Biomed. Mater. Res. 2000;53:1. doi: 10.1002/(sici)1097-4636(2000)53:1<1::aid-jbm1>3.0.co;2-r. [DOI] [PubMed] [Google Scholar]
- Lam K H, Nieuwenhuis P, Molenaar I, Esselbrugge H, Feijen J, Dijkstra P J. and Schakenraad J M. J. Mater. Sci. Mater. Med. 1994;5:181. doi: 10.1007/BF00121086. [DOI] [Google Scholar]
- Mikos A G, Sarakinos G, Leite S M, Vacanti J P. and Langer R. Biomaterials. 1993;14:323. doi: 10.1016/0142-9612(93)90049-8. [DOI] [PubMed] [Google Scholar]
- De Groot J H, Nijenhuis A J, Bruin P, Pennings A J, Veth R P H, Klompmaker J. and Jansen H W B. Colloid Polym. Sci. 1990;268:1073. doi: 10.1007/BF01410672. [DOI] [Google Scholar]
- Spaans C J, de Groot J H, Belgraver V W. and Pennings A J. J. Mater. Sci.: Mater Med. 1998;9:675. doi: 10.1023/A:1008922128455. [DOI] [PubMed] [Google Scholar]
- Pego A P, Poot A A, Grijpma D W. and Feijen J. J. Biomater. Sci.: Polym. Ed. 2001;12:35. doi: 10.1163/156856201744434. [DOI] [PubMed] [Google Scholar]
- Holy C E, Shoichet M S. and Davies J E. No. 99/25391 PCT WO Patent. 1999
- Virgilio N, Sarazin P. and Favis B D. Biomaterials. 2010;31:5719. doi: 10.1016/j.biomaterials.2010.03.071. [DOI] [PubMed] [Google Scholar]
- Reignier J. and Hunneault M A. Polymer. 2006;47:4703. doi: 10.1016/j.polymer.2006.04.029. [DOI] [Google Scholar]
- Chaput S, Carrot C, Castro M. and Prochazka F. Rheol. Acta. 2004;43:417. doi: 10.1007/s00397-004-0369-4. [DOI] [Google Scholar]
- Gauthier O, Bouler J-M, Aguado E, Pilet P. and Daculsi G. Biomaterials. 1998;19:133. doi: 10.1016/S0142-9612(97)00180-4. [DOI] [PubMed] [Google Scholar]
- Kaczmarek D. Vacuum. 2001;62:303. doi: 10.1016/S0042-207X(00)00426-7. [DOI] [Google Scholar]
- Harley B A, Kim H D, Zaman M H, Yannas I V, Lauffenburger D A. and Gibson L J. Biophys. J. 2008;95:4013. doi: 10.1529/biophysj.107.122598. [DOI] [PMC free article] [PubMed] [Google Scholar]
- Washburn E W. Proc. Natl Acad. Sci. USA. 1921;7:115. doi: 10.1073/pnas.7.4.115. [DOI] [PMC free article] [PubMed] [Google Scholar]
- Monsky W L, Lin C-Y, Aoyama A, Kelly T, Akiyama S K, Mueller S C. and Chen W-T. Cancer Res. 1994;54:5702. [PubMed] [Google Scholar]
- Hu Y, Rogunova M, Topolkaraev V, Hiltner A. and Baer E. Polymer. 2003;44:5701. doi: 10.1016/S0032-3861(03)00614-1. [DOI] [Google Scholar]
- Hu Y, Hu Y S, Topolkaraev V, Hiltner A. and Baer E. Polymer. 2003;44:5711. doi: 10.1016/S0032-3861(03)00615-3. [DOI] [Google Scholar]
- Steuer H, Fadale R, Muller E, Muller H-W, Planck H. and Schlosshauer B. Neurosci. Lett. 1999;277:165. doi: 10.1016/S0304-3940(99)00886-1. [DOI] [PubMed] [Google Scholar]


