Abstract
Water-soluble carbon dots (C-dots) were prepared through microwave-assisted pyrolysis of an aqueous solution of dextrin in the presence of sulfuric acid. The C-dots produced showed multicolor luminescence in the entire visible range, without adding any surface-passivating agent. X-ray diffraction and Fourier transform infrared spectroscopy studies revealed the graphitic nature of the carbon and the presence of hydrophilic groups on the surface, respectively. The formation of uniformly distributed C-dots and their luminescent properties were, respectively, revealed from transmission electron microscopy and confocal laser scanning microscopy. The biocompatible nature of C-dots was confirmed by a cytotoxicity assay on MDA-MB-468 cells and their cellular uptake was assessed through a localization study.
Keywords: C-dots, multicolor luminescence, biocompatibility, microwave irradiation
1. Introduction
The development and characterization of multicolor luminescence (MCL) nanoparticles for optical imaging applications are important topics in material science. In general, quantum dots and molecular probes have superior luminescence performance, which is attractive for in vitro and in vivo optical imaging in biological applications [1]. However, the use of such fluorescent moieties in biological applications is limited by their instability and poor biocompatibility. Quantum dots contain cadmium or other heavy metals that are harmful to the human body and the environment [2], whereas molecular probes are prone to photodegradation [3]. Therefore, carbon dots (i.e. C-dots) are favored as fluorescent probes for biological applications, owing to their stability and low toxicity.
Luminescent C-dots have been synthesized by various techniques, among which microwave-assisted methods appear most convenient, simple and industrially scalable [1]. Zhu et al [4] produced C-dots by a microwave method, which showed bright luminescence when their surfaces were passivated with diamine-terminated oligomeric poly(ethylene glycol) (PEG 200). Chandra et al [5] prepared C-dots by a similar method, but their luminescence intensity was too weak for biological applications. They were able to enhance the luminescence intensity of the C-dots by conjugating their surfaces with fluorescent probes. Liu et al [6] used carbon soot to synthesize C-dots that exhibited MCL under 312 nm excitation. They separated the C-dots by gel electrophoresis; hence, the yield was low. Besides, these C-dots exhibited MCL only under 312 nm excitation and lacked luminescence selectivity at different excitation wavelengths.
Achieving selective luminescence is vital for any imaging application. Sun et al [7] modified the surface of nonluminescent C-dots with PEG1500N, and the resultant particles exhibited MCL. A similar study was performed by Hu et al [8] in 2005. Pan et al [9] synthesized C-dots with two characteristic diameters. The smaller ones showed green luminescence. The bigger C-dots were nonluminescent, but emitted blue light after surface tethering with PEG2000N. Unfortunately, in all of the above approaches MCL could be achieved only through surface passivation of the C-dots. Yang et al [10] synthesized C-dots from biocompatible chitosan [11] and attributed their high quantum yield of green luminescence to the surface passivity, wherein the amine groups from chitosan acted as a surface tethering agent. Wang et al [12] prepared MCL C-dots from carbohydrates, under microwave irradiation, in the presence of metal ions. More recent investigations have shown that the toxic quantum dots (CdS/CdSe, etc.) can be passivated using various polymers or through ZnSe or Mn coating, thereby extending their usage to bioimaging [13]. For example, Pandey and co-workers reported the use of quantum dots [14, 15] and surface-functionalized magnetite nanoparticles in various medical imaging applications [16].
In this study we report the preparation of MCL C-dots through microwave-assisted pyrolysis of an aqueous solution of dextrin that contained sulfuric acid. This technique yields water-soluble C-dots that emit light in the entire visible range, without using any surface-passivating agents. The prepared C-dots have been characterized by x-ray diffraction (XRD), Fourier transform infrared (FTIR) spectroscopy, transmission electron microscopy (TEM), fluorescence absorption spectroscopy and confocal laser scanning microscopy (CLSM).
2. Materials and methods
All chemicals were used without further purifications, namely dextrin (white, SRL Pvt. Ltd, Practical Grade), H2SO4 (Merck, ≽ 99%), dimethyl sulfoxide (DMSO, Sigma Aldrich, ≽ 99.9%) and 3-(4,5-dimethylthiazol-2-yl)-2,5-diphenyltetrazolium bromide (MTT, Sigma Aldrich, 98%). Dulbecco's modified Eagle's medium (DMEM)–high glucose, L-glutamine, penicillin, streptomycin and phosphate-buffered saline (PBS) were purchased from Gibco Invitrogen India.
2.1. Synthesis of C-dots
In a typical synthesis, 0.5 g of dextrin was dissolved in 25 ml of water and then 2 ml of concentrated H2SO4 was added in it under vigorous stirring. The solution mixture was then subjected to microwave irradiation for 2.5 min at 800 W to obtain an insoluble black precipitate and a light-brown supernatant. The supernatant liquid and the carbogenic precipitate were then separated by centrifugation, and the C-dots were collected from the supernatant by dialysis for 24 h. The collected C-dots were concentrated through evaporation of the solvent.
2.2. Characterization
Luminescence images of resultant samples were obtained using a confocal laser scanning microscope (Olympus FV1000, Japan) equipped with argon and He–Ne lasers. The interlayer spacing of C-dots was measured by powder XRD using a Philips PW 1710 diffractometer (CuKα radiation, 30 mA, 40 kV, 2θ = 20–70°, scan rate 1.1° min–1, sampling interval 0.02°). Functional groups were analyzed by FTIR spectroscopy using a Perkin–Elmer Spectrum RXI instrument. Morphology and particle size were measured by TEM (JEOL JEM-2100).
Cytotoxicity of C-dots was determined by conventional MTT assay. MDA-MB-468 cells were seeded in 96-well flat-bottom culture plates at a density of 3000 cells per well in 0.1 ml of DMEM complete medium. The cells were allowed to adhere for growth and incubated for 24 h at 37 °C in a CO2 incubator. After incubation, the medium was aspirated and cells were treated with different concentrations of C-dots in 0.1 ml of fresh medium. Control wells were treated with equivalent volumes of medium containing no C-dots. After 72 h of incubation, the medium (containing the C-dots) was removed and replaced with 0.1 ml of MTT (1 mg ml–1) solution in PBS for 4 h. Then, the unreduced MTT solution was discarded, and DMSO (0.1 ml) was added into each well of the reduced MTT solution to dissolve the purple formazan precipitate by active mitochondria of viable cells. Plates were shaken and the concentration of the formazan dye was measured spectrophotometrically using a benchmark microplate reader. The assay was performed in triplicate. The cytotoxic effect in each of the treatments was expressed as percentage of cell viability relative to the untreated control cells (% control) and is defined as follows:
where OD stands for optical density of the respective solution measured at 550 nm.
Cellular uptake of C-dots was studied by seeding MDA-MB-468 cells at a density of 5 × 10⁴ on a sterile glass cover slip. The cells were then treated with 100 μg per coverslip of C-dots suspended in DMEM incomplete medium for different durations (1, 3, 6 and 12 h). After incubation, cover slips were washed thrice with PBS and the cells were fixed using 3.7% paraformaldehyde for 20 min; they were then examined by CLSM.
3. Results and discussion
Dextrin is a reduced, water-soluble sugar. Mixing the dextrin solution with sulfuric acid under microwave irradiation resulted in a light-brown solution containing some black insoluble precipitate. This precipitate was separated by centrifugation and used for calculating the product yield, whereas the supernatant solution was purified by dialysis and concentrated by vacuum evaporation. The colorless solution obtained after dialysis (yield 38%) exhibited MCL.
Figure 1 shows the photoluminescence spectra of the C-dots with emission peaks at 410 (violet), 442 (blue), 486 (cyan), 556 (green), 580 (yellow) and 688 (deep red) nm. These emission peaks were observed at the corresponding excitation wavelengths of 360 (ultraviolet), 380 (ultraviolet), 440 (blue), 525 (green), 550 (green) and 610 (orange) nm. The observed luminescence depended on the excitation wavelengths (see also figure 2) and the quantum yield of the C-dots varied between 5% and 9% (table 1). The emission peaks observed for the C-dots matched those reported by Liu et al [6]; they, however, had observed this type of luminescence only for a single excitation wavelength (312 nm).
Figure 1.
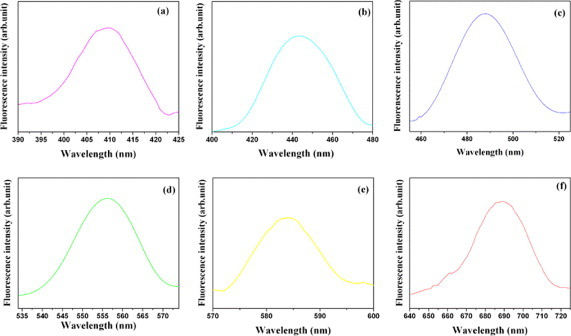
Emission spectra of C-dots excited at (a) 360, (b) 380, (c) 440, (d) 525, (e) 550 and (f) 610 nm.
Figure 2.
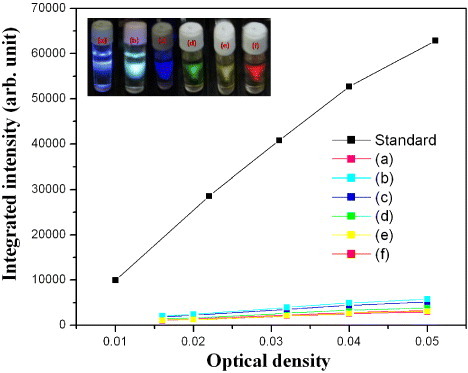
Integrated intensity of luminescence excited at (a) 360, (b) 380, (c) 440, (d) 525, (e) 550 and (f) 610 nm versus optical density at that wavelength. The optical density was changed by varying the C-dot concentration. The inset shows luminescence images for samples (a)–(f). Rhodamine 6G was used as the standard.
Table 1.
Quantum yield of Rhodamine 6G (Rh6G) and C-dots at different emission wavelengths (λem). Grad∗ represents the slope of the plot of optical density versus integrated intensity.
| Sample, λem (nm) | Grad∗ | Quantum yield |
|---|---|---|
| Rh6G, 555 | 1291331 | 0.950 |
| C-dots, 410 | 80694 | 0.062 |
| C-dots, 442 | 94239 | 0.072 |
| C-dots, 486 | 109302 | 0.084 |
| C-dots, 556 | 98834 | 0.076 |
| C-dots, 580 | 65493 | 0.051 |
| C-dots, 688 | 61796 | 0.048 |
Selective luminescence is a crucial requirement for MCL C-dots. Ray et al [17] produced C-dots emitting bright blue-green and yellow light under UV and blue excitation, respectively. Xiu et al [18] synthesized strongly luminescent C-dots by thermal decomposition of a Mg-substituted aluminophosphate molecular sieve with a chabazite structure; their emission wavelength depended on the carbon content of the composite phosphate material. Those C-dots were relatively toxic and expensive. The MCL C-dots prepared in this study had higher quantum yield and showed luminescence selectivity. The quantum yield (ϕ) of the MCL C-dots was calculated from the following expression when Rhodamine 6G (ϕ = 0.95) was used as the standard:
Here, I, A and n are integrated intensity, optical density and refractive index, respectively, and the subscript R refers to the reference material. For more accurate calculations, we used the following equation [19], where Grad represents the slope of the plot of optical density versus integrated intensity:
The effects of pH and the duration of microwave irradiation, t, on the fluorescence intensity have also been studied. Figure 3 shows that the fluorescence maxima occurred at pH 6 and t = 2.5 min.
Figure 3.
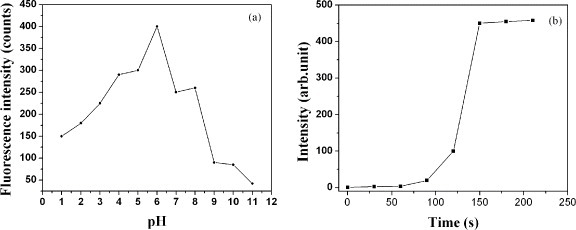
Fluorescence intensity versus (a) pH and (b) duration of microwave irradiation.
The XRD pattern of C-dots (figure 4(a)) shows a single peak with a position corresponding to an interlayer spacing of ∼3.77 Å, which is larger than the distance between the (002) planes in bulk graphite (3.34 Å). Thus, C-dots may have a turbostratic carbon structure. Pan et al [9] reported that C-dots have a predominantly graphitic structure with an interlayer spacing of ∼ 4.12 Å [9].
Figure 4.
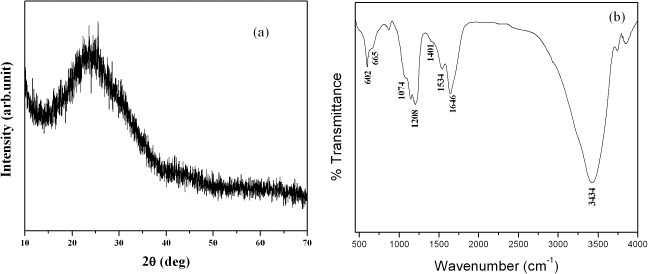
(a) XRD pattern and (b) FTIR transmittance spectrum of C-dots.
Figure 4(b) shows the FTIR transmittance spectrum of the C-dots. The peaks located at 3434, 1646, 1534 and 1208 cm−1 correspond to the respective functional groups – OH, COOH,  and C–O–C that are present in the C-dots. In addition, the peaks observed at 1401, 1074 and 665 cm−1 can be, respectively, assigned to the methylene symmetric bending vibrations and the symmetrical stretching vibrations of the SO3− and C–S groups present in the C-dots. The presence of these functional groups in the C-dots is responsible for their good dispersion in water, ethanol, acetone and DMSO.
Figure 5 shows TEM images of the C-dots, which have spherical shapes, diameters of 3–7 nm and a lattice spacing of 0.25 nm, which is close to the (100) lattice spacing of graphite. Serendipitously, we observed that the insoluble precipitate (carbogenic material) changed its structure with ageing time after centrifugal separation (figure 6). After centrifugation, it was dispersed in water and sonicated for 10 min. Various shapes such as star, flower, flower garland, cluster of flower garlands and leaf have been observed after ageing for 16, 24, 48, 62 and 120 h (figure 6), respectively. The final leaf-shaped carbon particles were stable for at least 5 months. A detailed study of the growth mechanism, stability and luminescence of differently shaped carbon particles is currently in progress.
Figure 5.
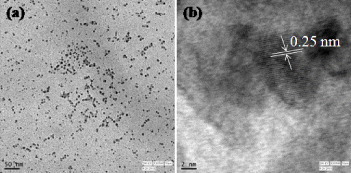
Typical TEM images of C-dots.
Figure 6.
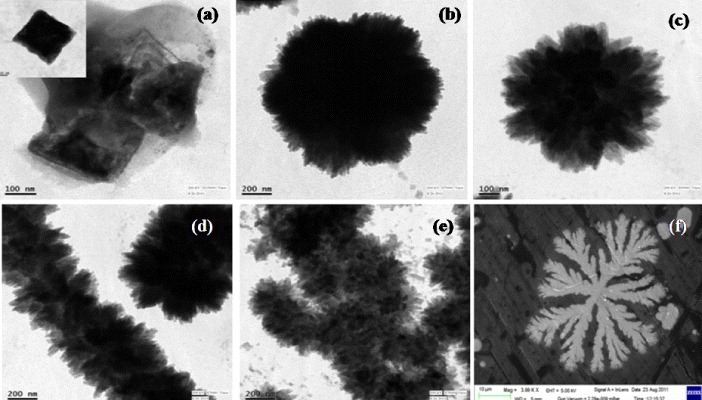
Sample morphology versus ageing time: (a) 0, (b) 16 (c) 24, (d) 48, (e) 62 and (f) 120 h, observed by TEM (a–e) and SEM (f).
Luminescence of the C-dots may originate from the recombination of electron–hole pairs from impurity atoms and oxygen-containing functional groups. A similar mechanism has been proposed for the surface-oxidized silicon nanocrystals [1]. It still remains unclear why a single compound exhibits multicolored luminescence.
We have studied the luminescence of C-dots by optical imaging [7, 17]. In the cytotoxicity assay, the cell viability decreased from 96% to 90% when the C-dot concentration was increased from 0.1 to 1 mg ml−1 (figure 7). This result reveals the biocompatible nature of the prepared C-dots.
Figure 7.
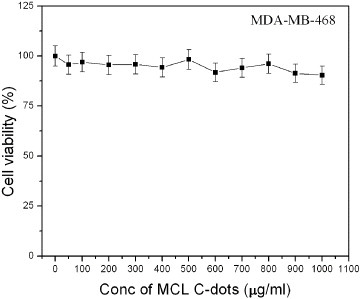
Cell viability assay: effect of C-dots on MDA-MB-468 cells.
Localization of C-dots on MDA-MB-468 cells has also been studied at incubation periods of 1, 3, 6 and 12 h [7]. After incubation for 1 h, the C-dots were observed to adhere to the cell membrane. Weak emission signals from the nucleus and strong ones from the cytoplasm were observed at shorter incubation periods. After longer incubation (12 h), strong fluorescence was observed at the nucleus (figure 8). Owing to their small size, the C-dots entered and became localized at the nucleus within 12 h of incubation, consequently exhibiting a strong fluorescence. Such strong fluorescence from the nucleus was not observed after 6 h of incubation. The fluorescence intensity from cells increased from 1 to 12 h of incubation reflecting the amount of intracellular uptake of C dots.
Figure 8.
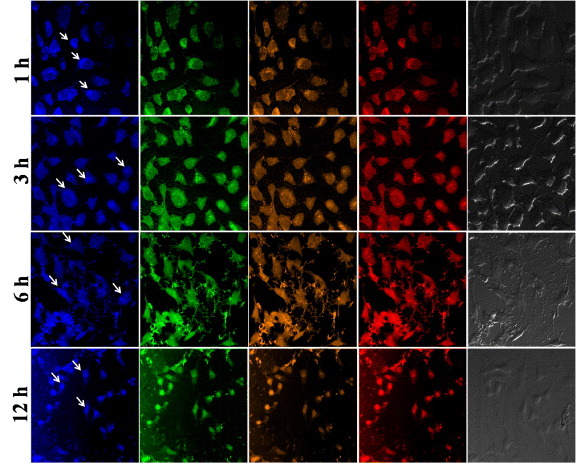
CLSM images of MDA-MB-468 cells treated with C-dots after 1, 3, 6 and 12 h. Excitation and emission wavelengths: first column: λex = 359 nm, λem = 461 nm; second column: λex = 494 nm, λem = 520 nm; fourth column: λex = 570 nm, λem = 590 nm; the third column is a sum of the second and fourth columns. Scale bars: 1, 3, 6 h — 10 μm and 12 h — 20 μm.
4. Conclusions
A simple method has been established to produce MCL C-dots through microwave irradiation of an aqueous solution of dextrin that contained sulfuric acid. Luminescence properties of the C-dots over the entire visible range have been ascertained and their biocompatibility has been confirmed through CLSM on MDA-MB-468 cells and MTT assay. The novelty of the developed method is in producing water-soluble MCL C-dots without using any surface-passivating agent. Owing to their intense and multicolored luminescence, these C-dots are promising materials in bioimaging, optoelectronic devices, medical diagnostics and biosensing. Studies on their biological applications as fluorochromes for detecting drug–cell interactions in drug delivery applications are in progress.
Acknowledgments
The authors would like to acknowledge M.H.R.D., Government of India, for the financial support. The authors are also grateful to Professor B Viswanathan, Indian Institute of Technology, Madras, for his encouragement during his short visit to IIT Kharagpur.
References
- Baker S N. and Baker G A. Angew. Chem. Int. Ed. 2010;49:6726. doi: 10.1002/anie.200906623. [DOI] [PubMed] [Google Scholar]
- Cho S J, Maysinger D, Jain M, Roder B, Hackbarth S. and Winnik F M. Langmuir. 2007;23:1974. doi: 10.1021/la060093j. [DOI] [PubMed] [Google Scholar]
- Wittmershaus B P, Skibicki J J, McLafferty J B, Zhang Y-Z. and Swan S. J. Fluoresc. 2001;11:119. doi: 10.1023/A:1016629518660. [DOI] [Google Scholar]
- Zhu H, Wang X, Li Y, Wang Z, Yang F. and Yang X. Chem. Commun. 2009;34:5118. doi: 10.1039/b907612c. [DOI] [PubMed] [Google Scholar]
- Chandra S, Das P, Bag S, Laha D. and Pramanik P. Nanoscale. 2011;3:1533. doi: 10.1039/c0nr00735h. [DOI] [PubMed] [Google Scholar]
- Liu H, Ye T. and Mao C. Angew. Chem. Int. Ed. 2007;46:6473. doi: 10.1002/anie.200701271. [DOI] [PubMed] [Google Scholar]
- Sun Y P. 2006;128:7756. doi: 10.1021/ja062677d. J. Am. Chem. Soc. [DOI] [PubMed] [Google Scholar]
- Hu S-L, Niu K-Y, Sun J, Yang J, Zhao N-Q. and Du X-W. J. Mater. Chem. 2009;19:484. doi: 10.1039/b812943f. [DOI] [Google Scholar]
- Pan D Y, Zhang J C, Shen W Q, Zhang Z W, Fang Y G. and Wu M H. New J. Chem. 2010;34:591. doi: 10.1039/b9nj00662a. [DOI] [Google Scholar]
- Yang Y, Cui J, Zheng M, Hu C, Tan S, Xiao Y, Yang Q. and Liu Y. Chem. Commun. 2012;48:380. doi: 10.1039/c1cc15678k. [DOI] [PubMed] [Google Scholar]
- Yao Z-A. and Wu H-G. Adv. Mater. Lett. 2010;1:67. doi: 10.5185/amlett.2010.4113. [DOI] [Google Scholar]
- Wang X, Qu K, Xu B, Ren J. and Qu X. J. Mater. Chem. 2011;21:2445. doi: 10.1039/c0jm02963g. [DOI] [Google Scholar]
- Mishra A K, Kobayashi H, Turner A P F. and Tiwari A. Intelligent Nanomaterials. New York Wiley; 2012. [Google Scholar]
- Sharma P K, Dutta R K. and Pandey A C. Adv. Mater. Lett. 2011;2:285. doi: 10.5185/amlett.indias.195. [DOI] [Google Scholar]
- Dutta R K, Sharma P K. and Pandey A C. Adv. Mater. Lett. 2011;2:268. doi: 10.5185/amlett.indias.195. [DOI] [Google Scholar]
- Sharma P K, Dutta R K. and Pandey A C. Adv. Mater. Lett. 2011;2:246. doi: 10.5185/amlett.2011.indias214. [DOI] [Google Scholar]
- Ray S C, Saha A, Jana N R. and Sarkar R. J. Phys. Chem. C. 2009;113:18546. doi: 10.1021/jp905912n. [DOI] [Google Scholar]
- Xiu Y, Gao Q, Li G D, Wang K X. and Chen J S. Inorg. Chem. 2010;49:5859. doi: 10.1021/ic1000039. [DOI] [PubMed] [Google Scholar]
- Ghatak C, Rao V G, Pramanik R, Sarkar S. and Sarkar N. Phys. Chem. Chem. Phys. 2011;13:3711. doi: 10.1039/c0cp01925a. [DOI] [PubMed] [Google Scholar]


