

Abstract
Gelation of tannin–formaldehyde (TF) solutions was systematically investigated by changing pH and concentration of TF resin in water. In this way we constructed the TF phase diagram, from which chemical hydrogels could be described, and also synthesized thermoreversible tannin-based hydrogels. Conditions of non-gelation were also determined. Hydrogels were dried in supercritical CO2, leading to a broad range of TF aerogels. The latter were investigated for volume shrinkage, total porosity, micro-, meso- and macropore volumes, Brunauer–Emmett–Teller (BET) surface area, microscopic texture, mechanical and thermal properties. All these properties are discussed in relation to each other, leading to an accurate and self-consistent description of these bioresource-based highly porous materials. The conditions for obtaining the highest BET surface area or mesopore volume were determined and explained in relation to the preparation conditions. The highest BET surface area, 880 m2 g−1, is remarkably high for organic aerogels derived from a natural resource.
Keywords: 10.01, 10.13, 20.09
Keywords: aerogel, tannin, porosity, surface area, mechanical strength, thermal conductivity
1. Introduction
Aerogels are a special class of low-density materials with large internal and open void space [1, 2]. These materials may be used in both organic and carbonized forms, depending on the application. Aerogels made of an organic polymer framework can be used in a wide variety of applications such as drug delivery [3, 4], thermal insulation [2, 5], adsorption of volatile compounds [6] and acoustic insulation [7]. Applications vary with the textural properties of aerogels [8], which depend on composition and supercritical drying parameters. Generally, aerogels are highly mesoporous materials, most pores having diameters between 2 and 50 nm. Families and applications of mesoporous materials have been recently reviewed [9, 10].
The development of aerogels based on cheap, natural materials has attracted considerable research interest, due to both environmental and health concerns. From this point of view, condensed tannins are particularly relevant. Firstly, condensed tannins and related flavonoid molecules are widely distributed in nature; they can be extracted from leaves and galls of plants, and mainly from wood and bark of various trees because of their high flavonoid content [11, 12]. Secondly, these compounds are non-toxic, biodegradable, available on an industrial scale with consistent quality, and can be purchased at a moderate cost of about  . Finally, condensed tannins are very suitable for preparing gels and aerogels, either pure in the presence of a crosslinker [13–19], or after mixing with other synthetic [14] or natural molecules [20–22].
Tannins are largely used in leather production [23], winemaking [24] and in the chemical industry as natural polyphenolic materials that can replace toxic compounds such as phenol and resorcinol in resins and adhesives [25–27]. Interestingly, diluted resins and adhesives may be used as starting materials for the preparation of aerogels [28, 29]. Polymerization and crosslinking of these adhesives is based on the formation of methylene bridges. In the case of tannins, such linkages are produced by the reaction of flavonoid units with an aldehyde [11, 30, 31].
In this work, tannin-based aerogels were synthesized by sol–gel polycondensation of commercial wattle tannin (T) with formaldehyde (F). The major flavonoid compound in wattle tannin is prorobinetinidin, see figure 1, based on the repetition of robinetinidol as the flavonoid unit. This unit is repeated 2–11 times in wattle tannin, using mostly 4,6 and sometimes 4,8 links, according to the usual atom numbering shown in figure 1 [11]. The most reactive site towards formaldehyde is the C8 site of the A-ring. This reaction position is related to the vicinal hydroxyl substituents [11].
Figure 1.
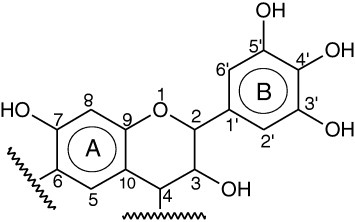
Chemical structure of prorobinetinidin, the main flavonoid compound in wattle tannin.
The sol–gel process is based on the preparation of a colloidal suspension of solid particles in a liquid, the sol, which becomes a gel after growth and clustering of such particles [32]. For this reason, most phenolic gels are based on spherical nodules with average diameter depending strongly on the initial pH, as evidenced clearly by electron microscopy. On top of being the classical route to the preparation of aerogels, this method presents several advantages such as high purity, homogeneity at the molecular level, and ability to control the final material's properties according to the initial parameters of synthesis ([33] and references therein). Sol–gel polymerization leads to a continuous and extensive crosslinking, producing a gel [34, 35] via van der Waals interactions, hydrogen bonding, electrostatic interactions and covalent bonds [36]. After gelation, ageing is required to mechanically reinforce the solid skeleton [1, 34], and then water that remains within the pores must be removed by washing the gel with a suitable solvent.
Drying of the resultant wet gel is the final and most critical step in the production of aerogels. The challenge is to eliminate the liquid solvent from the hydrogel without collapsing the delicate nanostructure, thereby avoiding the subsequent shrinkage and cracking of the dried gel [37]. To avoid this problem, supercritical drying is suggested and is indeed the most frequently used method for producing aerogels with almost no capillary stress and related drying shrinkage [34–39]. This method can be performed in various organic solvents in their supercritical state [1] or in supercritical CO2 [37]. However, the use of organic solvents, such as acetone or methanol, requires higher temperatures and pressures [8, 40]. Carbon dioxide supercritical drying (scCO2) is desirable because CO2 is a non-flammable and chemically inert fluid under the conditions it is employed. Moreover, CO2 has a low critical temperature and pressure (Tc = 31 °C, Pc = 7.4 MPa) [41, 42].
The aim of this study was to investigate the feasibility of organic aerogels under different conditions of synthesis, through the production of the phase diagram of tannin–formaldehyde (TF) solutions in water, prepared at different pH and concentrations. Such parameters are important when the pore texture of the resultant aerogels is considered. Highly concentrated solutions are expected to lead to low-porosity aerogels, whereas highly diluted ones are supposed to lead to high pore volumes but also low mechanical strength. As a consequence, the solid backbone is so weak that significant shrinkage may occur during drying, and part of the porosity may be lost. This phenomenon has been observed in the case of highly diluted TF cryogels [43]. Less diluted gels should thus be preferred, having a lower initial porosity, but whose major part can be maintained because the gels are stiffer, so they may present a much more developed porous structure. Therefore, mechanical strength is a very important parameter directly related to porosity, which can be controlled by initial dilution, pH and amount of crosslinker. There exists an optimum for each of these experimental parameters. To understand such phenolic systems, the construction of a phase diagram is of great interest.
In this study, the amount of crosslinker was kept constant, whereas the pH and the dilution of tannin in water were varied within a broad range. The final textural properties of the resultant aerogels were analysed, and differences have been evidenced depending on pH and dilution.
2. Experimental details
2.1. Preparation of TF hydrogels
The gels were prepared by dissolving commercial wattle tannin powder (T), kindly supplied by SilvaChimica (St Michele Mondovi, Italy), in a 20 wt% aqueous solution of methanol under mechanical stirring. A 37 wt% solution of formaldehyde (F) was then added in a T/F weight ratio of 1.35, on a dry basis [13]. A homogeneous brown solution was obtained, with an initial pH of ∼4.3. From this stock mixture, several solutions were produced with different pH and weight fractions of TF resin, on a dry basis. NaOH and p-toluene sulphonic acid (PTSA), both in solid form, were used to change the pH from 2 to 10 in steps of 2 pH units. Using such solids, the impact of the pH adjustment on dilution was negligible.
The solutions were poured into glass tubes of inner diameter 1.4 cm, which were sealed and placed vertically in an oven at 85 °C for 5 days for gelation and subsequent ageing. No gelation occurred at 85 °C for the samples with a TF resin concentration of 4% at pH 8 and 10, nor for the sample with a TF concentration of 6% at pH 10. Nevertheless, two samples (4%, pH 8 and 6%, pH 10) gelled after being removed from the oven and maintained at room temperature. Such gelation was reversible, with melting occurring once the temperature was increased again up to 85 °C. Additional differential thermal analyses confirmed a melting point just below 85 °C. To the best of our knowledge, these materials are the first thermoreversible gels based on tannin, and are obviously physical gels. All other compositions and pH led to irreversible chemical gelation and infusible, insoluble gels.
The samples were removed from their tubes and cut into cylinders with a diameter of 1.4 cm diameter and a typical thickness of 1 cm, and thoroughly washed with large amounts of dry ethanol. Washing steps were carried out in an orbital shaker at 80 rpm and 40 °C to ensure a better and faster solvent exchange inside the sample. The ethanol was replaced every day, and solvent exchange was assumed to be complete after 3 days. A small piece of each sample not submitted to solvent exchange was cut into thin slices (<1 mm) that were examined visually in transmitted light.
2.2. Supercritical drying of TF hydrogels
The samples’ dimensions were measured with an electronic Vernier calliper before and after drying to determine the volume shrinkage of the gels. Supercritical drying in CO2 was carried out in an Autosamdri–815 automatic critical point dryer apparatus (Tousimis, USA). The samples were placed in a stainless steel sample holder and immersed in the drying chamber partially filled with dry ethanol. The chamber was closed and cooled to −10 °C before being filled with pure liquid CO2. Ethanol was exchanged by liquid CO2 (purge step) for 5 min. The apparatus was then stopped for 1 h to let the excess CO2 diffuse inside the porosity of the gel and replace any ethanol that still remained in the pores. Filling and purging steps were repeated four times, always with breaks of 1 h, to ensure that ethanol was completely replaced by liquid CO2. After the cycles, the temperature inside the chamber was increased to 40 °C and the pressure consequently rose to 10.2–10.4 MPa, i.e. above the critical point of CO2. Then, the chamber was slowly depressurized at a controlled rate using the ‘bleed’ meter valve of the critical point dryer to obtain both low shrinkage and fully reproducible aerogels [39].
The resultant tannin–formaldehyde aerogel samples were termed ATFx–y, where A, T, F, x and y stand for aerogel, tannin, formaldehyde, TF mass ratio (%) on a dry basis and pH value, respectively.
2.3. Characterization of ATF samples
ATF organic aerogels with different characteristics such as bulk density and Brunauer–Emmett–Teller (BET) surface area were observed at different magnifications with an FEI Quanta 600 FEG scanning electron microscope (SEM) after metallization.
The bulk density of all aerogels, ρb (g cm−3), was measured with a Geopyc 1360 Envelope Density Analyser (Micromeritics, USA). The bulk density of each sample was determined from its weight, W (g), and envelope volume, Ve (cm3), as an average of five analytical runs:
The skeletal density, ρs(g cm−3), was obtained with a helium pycnometer, Accupyc II 1340 (Micromeritics, USA), using finely crushed samples to minimize errors related to possible closed porosity. From these results, the total porosity, Φ (dimensionless) and the total pore volume, Vp (cm3 g−1), were calculated as
Nitrogen adsorption–desorption isotherms were obtained at −196 °C using an ASAP 2020 automatic adsorption apparatus (Micromeritics, USA). The samples were degassed for 24 h in vacuum at 105 °C prior to any adsorption experiment. Surface areas, SBET (m2 g−1), and micropore volumes (pore width <2 nm), VDR (cm3 g−1), were determined using BET [44] and Dubinin–Radushkevich [45] calculation methods, respectively. The volumes of mesopores (2 < pore width <50 nm), Vmeso (cm3 g−1), and macropores (pore width >50 nm), VM (cm3 g−1), were calculated as Vmeso = V0.95 – VDR and VM = Vp – V0.95, respectively. V0.95 (cm3 g−1) is the volume of liquid nitrogen corresponding to the amount adsorbed at a relative pressure P/P0 = 0.95 [46]. Pore-size distributions were calculated using the method of Barret, Joyner and Halenda (BJH) [47] applied to the desorption branch of the isotherms, using the software supplied with the ASAP 2020 automatic adsorption apparatus.
2.4. Thermal and mechanical properties
Thermal conductivity measurements and compression tests were carried out at room temperature (21 °C) and relative humidity within the range 50–60%. Only samples presenting very different bulk densities were chosen for such tests.
Thermal conductivity was measured by the transient plane source method (Hot Disk TPS 2500, ThermoConcept, France). This method is based on a transiently heated plane sensor, used both as a heat source and as a dynamic temperature sensor. It consists of an electrically conducting pattern in the shape of a double spiral, which has been etched out of a thin nickel foil and sandwiched between two thin sheets of Kapton®. The plane sensor was fitted between two identical cylindrical pieces of ATF sample, each one with a smooth, flat surface facing the sensor. The thermal conductivity was then calculated with the Hot Disk 6.1 software.
Afterwards, some of these samples were tested in compression, using an Instron 4206 universal testing machine equipped with a 2 kN head. The compression was carried out at a constant load rate of 2.0 mm min−1, and stress and strain were continuously and simultaneously recorded.
3. Results and discussion
3.1. Phase diagram of tannin-based hydrogels
As explained above, almost all precursor solutions led to gels, except for one sample with a TF mass ratio of 4% prepared at pH 10. Analysis of these gels allowed clear differentiation based on their aspect. Such analysis is important, because a true gel prepared by the usual mechanisms of sol–gel chemistry, i.e. by clustering of spherical polymer particles, is expected to lead to a homogeneous structure based on small, rounded nodules. However, polymer precipitation is also possible, although separation between gelation and precipitation is not always easy, and some experimental conditions may lead to an overlapping of these two regimes. Generally, a precipitate is formed when the solid falls to the bottom of the reaction tube, leaving a significant volume of clear solution at the top. This situation was never observed with TF formulations in any condition. Besides, it can be assumed that a gel is formed when the whole volume of the initial solution turns to solid, whether a slight shrinkage occurs or not. Under these conditions, the constitutive nodules are ‘small’ (a few nm to a few tens of nm in diameter) and homogeneous, unlike precipitates whose particles have a very broad distribution of sizes and can be much bigger. Such differences are expected to affect light transmission. Figure 2 shows the visual sorting of all hydrogels based on their aspect.
Figure 2.
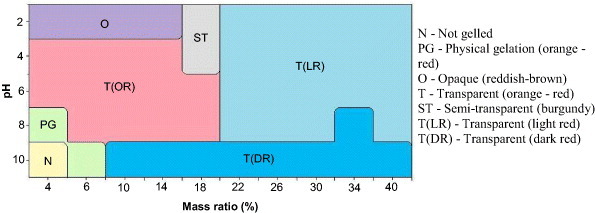
Phase diagram based on the appearance of TF hydrogels.
The two remarkable visual characteristics in the differentiation of the samples are transparency and colour. Transparency can be associated with the aerogel structure. Emmerling et al [48] showed that, in the presence of larger nodules and consequently larger clusters, the transparency of the final material is decreased. The ‘opaque’ region of the diagram in figure 2, for which the mass ratio is low (below 16%) and the pH is extremely acidic (∼2), seems to corroborate this fact, since aerogels prepared at low pH are indeed known to contain larger nodules [13, 49], resulting in bigger clusters. When increasing both pH and concentration of the TF resin, the size of the aerogels’ nodules is expected to decrease, leading to a higher transparency of the material. This is evidenced by the other parts of the diagram, higher pH and/or higher concentration always leading to more transparent gels.
The second parameter explored was the colour of the gels. All samples exhibited reddish colours, varying from red-brown at acidic pH to dark red at alkaline pH, passing through burgundy or orange-red at intermediate pH. Such changes are strongly related to the presence of quinones, which are produced by oxidation of phenolic compounds. Their colours range from pale yellow through orange, red, purple and brown to almost black [50]. In alkaline pH, quinones present a darker colour, whereas at acidic pH they exhibit a red colour [50]. Quinones are thus more easily evidenced at high concentration and high pH, in agreement with figure 2.
As expected, the intensity of the colour increased with concentration of TF resin. Above 18 wt%, all the samples were transparent, but significantly darker than those prepared at lower concentrations. At both high pH and high concentration, the gels became very dark but remained transparent. The darkest samples were all obtained at pH 10, except those that were physically gelled. ATF4%-8 and ATF6%-10 were orange-red, but transparent and opaque, respectively.
The combined effect of increasing the TF concentration and pH of the initial solution provided not only darker but also stiffer hydrogels. As a general experimental rule, phenolic aerogels prepared at higher pH have smaller pores [49, 51, 52] and, obviously, higher concentrations of solid induce lower porosity [52]. As a result, the gels have better mechanical properties, as demonstrated below.
3.2. Pore texture analysis
The structure of aerogels is important for their applications, which are closely related to their textural properties. Supercritical CO2 drying has been chosen because it preserves the high open porosity based on narrow pores, leading to high micro and/or mesopore volumes associated with a high surface area [39]. Moreover, no degradation of the materials is expected with such a method, given the low pressure and temperature involved. Other drying methods such as freeze drying [53] may produce materials with very wide pores due to ice crystal growth [7], which is sometimes detrimental to retention of a monolithic character, whereas subcritical drying facilitates the shrinkage-induced loss of porosity through the persistence of capillary forces at the vapour–liquid interface, which are very intense at the nanometre level [54].
Textural properties have been investigated for all samples. Volume shrinkage of TF hydrogels submitted to supercritical drying in CO2 is shown in figure 3. The highest volume shrinkage was found for the most diluted samples, 4 and 6 wt% of TF at pH 6 and 8. As stated in the introduction, this fact is related to the lower mechanical strength expected at high dilutions (see next section). Additionally, the highest pH values correspond to gels with the smallest nodules and narrowest pores, in agreement with the findings described below, for which solvent exchange is the least efficient. If it is assumed that ethanol was not completely replaced by liquid CO2 inside the chamber of the critical point drier, then residual surface tensions may have occurred, even enhanced by the low pore size [52], leading to additional shrinkage. The range of volume shrinkage, from 37 to 87%, is broad, and the shrinkage values are rather high. They correspond to linear shrinkages ranging from 14 to 49%, respectively [39]. However, such high shrinkage values are not rare in the literature and, for example, shrinkages exceeding 75% have been reported for aerogels derived from another natural biopolymer [55].
Figure 3.
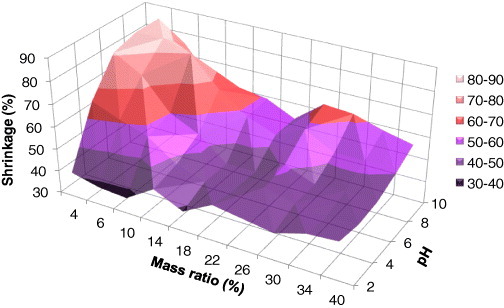
Volume shrinkage of ATF samples as a function of their synthesis parameters.
A selection of samples was submitted to helium pycnometry analysis. All aerogels had high skeletal densities, ranging from 1.6 to 2.0 g cm−3. Because of such unusual values for polymer samples, it was suspected that adsorption of He in the narrowest pores may have distorted the results. Experiments at 30 and 50 °C were thus carried out to check this possible effect, and indeed the measured density decreased to 1.40 ± 0.05 g cm−3 for all samples, irrespective of their initial pH or concentration.
Nitrogen adsorption–desorption isotherms are presented in figure 4 for a few aerogels only. All were combinations of type I and IV isotherms (micro–mesoporous) [56], but the type of hysteresis loop, typical of capillary condensation in mesopores, changed depending on the gels. Thus, type-H3 hysteresis loops were observed for gels prepared with low concentrations of TF resin (4–18 wt%) and acidic to slightly neutral initial pH (2–6). Figure 4(a) shows isotherms of samples ATF6%-2 and ATF6%-4 taken as examples. H3 loops are characteristic of a very wide distribution of pore sizes [57]. Given the absence of saturation at high relative pressures, though some inflection can be detected, the determination of V0.95 and hence of Vmeso was not very accurate. However, the trends were clear, as observed from the isotherms and the data of table 1: the mesopore volume decreased with increasing pH. Samples with such isotherms also had the highest macropore fractions, from 68 to 97%.
Figure 4.
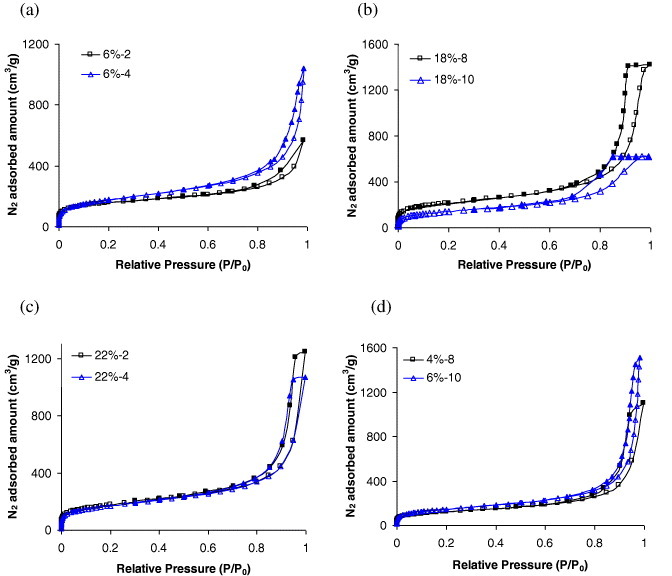
Nitrogen adsorption–desorption (open and solid symbols, respectively) isotherms of (a) ATF6%-2, ATF6%-4, (b) ATF18%-8, ATF18%-10, (c) ATF22%-2, ATF22%-4 and (d) ATF4%-8 and ATF6%-10 aerogels.
Table 1.
Textural properties of ATF samples: bulk density ρb (g cm−3), total pore volume Vp (cm3 g−1), micropore VDR, mesopore Vm and macropore VM volumes (cm3 g−1).
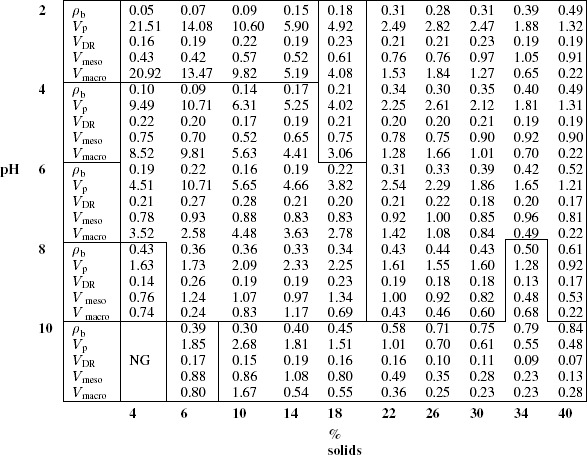 |
At alkaline pH of 8–10 and high TF resin concentrations of 34 and 40%, the hysteresis loops were of H2 type, which corresponds to inkbottle-shaped pores, i.e. with the pore body wider than the pore mouth [57]. Examples are given in figure 4(b). These samples also exhibited the highest values of mesopore volume, especially at pH 8 (see table 1). Samples prepared at lower concentrations (22–30%) and at pH 2–6 were similar, as seen in figure 4(c). These aerogels, however, had a significant macropore fraction, from 45 to 65% and smaller mesopore volumes (see table 1).
Thermoreversible gels, figure 4(d), presented the same kind of isotherms. Furthermore, similar percentages of macro (45%) and mesopore (84%) volumes were measured, confirming porous characteristics rather similar to those of chemical gels. A physical gel is obtained from reversible linkages, which are formed between polymeric chains under appropriate conditions, through weak forces such as hydrogen bonding or ionic interactions [4]. It has been conjectured that chemical gels, in general, have more developed porous structures than physical gels [4]. Our tannin aerogels based on physical gelation also have remarkable textural properties and a well-developed mesoporous structure.
The largest pore volumes were logically observed for samples with the lowest shrinkage. However these samples were mostly macroporous, the samples prepared at low pH having macropore volumes, VM, very close to the total pore volume, Vp, as seen in table 1. Micropore volumes, VDR, did not change significantly with the TF concentration and pH, except for 26–40% at pH 10, which resulted in the lowest microporosity. This behaviour is expected because of the high concentration of solids in the solution and the high pH, which together result in a more compact structure as observed in a previous work [13]. On the other hand, mesopore volumes had a very broad range of values, and were the highest at pH 8 in most cases, with values about and higher than 1 cm3 g−1. This result suggests that 8 is the optimal pH for producing TF aerogels with high mesoporosity. Furthermore, the macropore volumes at this pH were among the lowest, leading to the highest mesopore fractions of the entire phase diagram. The highest mesopore volume, 1.34 cm3 g−1, was obtained at pH 8 and 18% of TF resin, which seems to be the optimal concentration.
A clear trend for porosity values is observed in figure 5(a) as a function of pH and concentration of TF resin. Porosity increases when both these parameters are decreased, reaching an outstanding maximum value of 97% for ATF4%-2. The density of this sample, 0.05 g cm−3, is among the lowest ever reported for aerogels.
Figure 5.
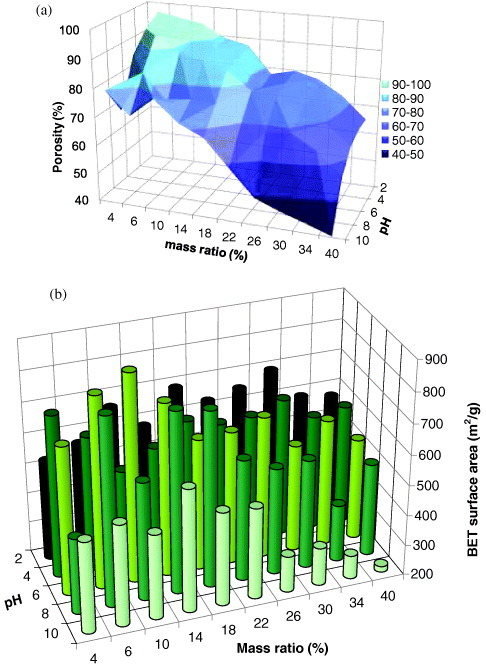
Pore texture characteristics of ATF aerogels as a function of their synthesis parameters: (a) total porosity; (b) BET surface area.
Figure 5(b) shows BET surface areas, which range from 219 to 880 m2 g−1 and mostly exceed 500 m2 g−1. The values corresponding to pH 4–8 at concentrations below 20 wt% are the highest for any organic aerogels based on natural sources. High surface areas at intermediate pH probably originate from the low reaction kinetics of phenolic compounds at pH ∼ 7 [58], allowing the formation of loose compact structures. As to the effect of TF resin concentration, figure 5(b) clearly shows than SBET goes through a maximum, as conjectured in the introduction to this paper. An optimal dilution indeed exists due to a compromise between high porosity, promoted by higher dilution, and moderate shrinkage, favoured by enhanced mechanical properties at lower dilution.
As expected, the highest value of SBET (in ATF10%-6) is related to the highest value of VDR (0.28 cm3 g−1, see table 1). A linear correlation between SBET and VDR is indeed observed in figure 6(a). Plotting SBET as a function of Vmeso in figure 6(b) resulted in much higher scattering. However, a trend exists, suggesting that the contribution of the mesoporosity to the surface area is not negligible.
Figure 6.
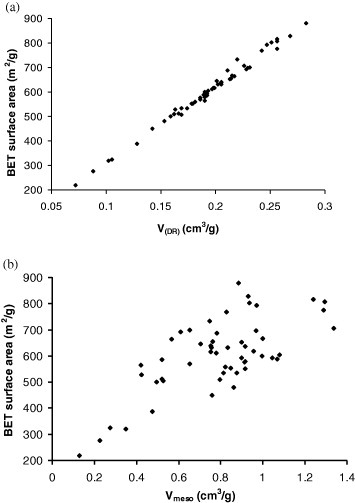
Correlations between BET surface area and (a) micropore volume and (b) mesopore volume.
The corresponding pore size distributions calculated by the BJH method are shown in figure 7. The observed behaviours confirmed the mixed micro-mesoporous character of these gels, although the microporosity can only be suspected with the method we used, through the rapid increase of the differential pore volume with decreasing pore diameter. Increasing the pH led to higher mesopore volumes, as expected. Increasing the TF resin concentration increased mesoporosity until a maximum was reached for ATF18%-8, followed by a decrease of mesopore volume at higher concentration. Broad pore size distributions (PSDs) were found for the most diluted samples at pH varying from 2 to 6, as expected from their isotherms, whereas rather narrow PSDs were observed at higher pH and higher concentrations. Most PSDs were shifted towards lower median diameters when pH and concentration were increased, as shown in figures 7(a)–(c). From this point of view, physical gels are exceptions (figure 7(d)), probably due to their different polymer structure.
Figure 7.
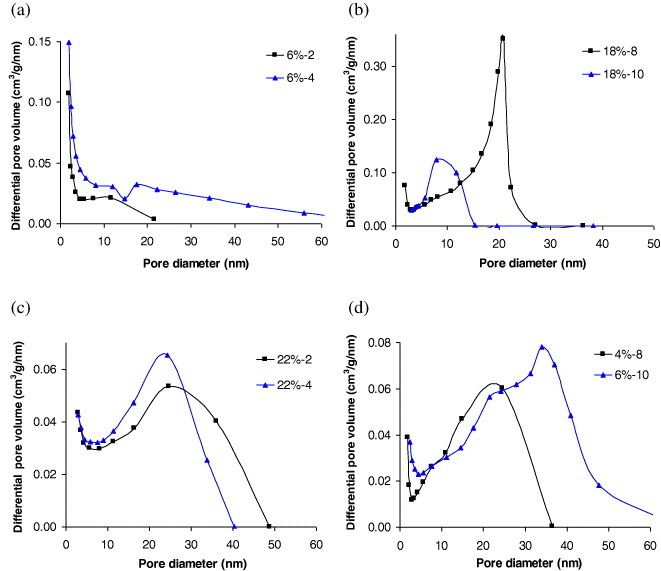
Pore size distributions calculated from figure 4.
The internal structure of organic tannin aerogels was observed using SEM. Similar images were observed at low magnification, both for chemical or physical aerogels, with flaking off at the surface and a characteristic conchoidal fracture [13, 20]; see figure 8(a). Physical gels had smoother surfaces, as seen in figure 8(b), but the same kind of fracture. Higher magnification images of figures 8(c)–(f) clearly reveal the expected granular structure, based on roughly spherical nodules arranged in a random packing [59]. The structure became less porous when the TF resin concentration and the pH were increased. This observation is consistent with the overall porosity calculated above, and with previous reports ([13, 49] and references therein).
Figure 8.
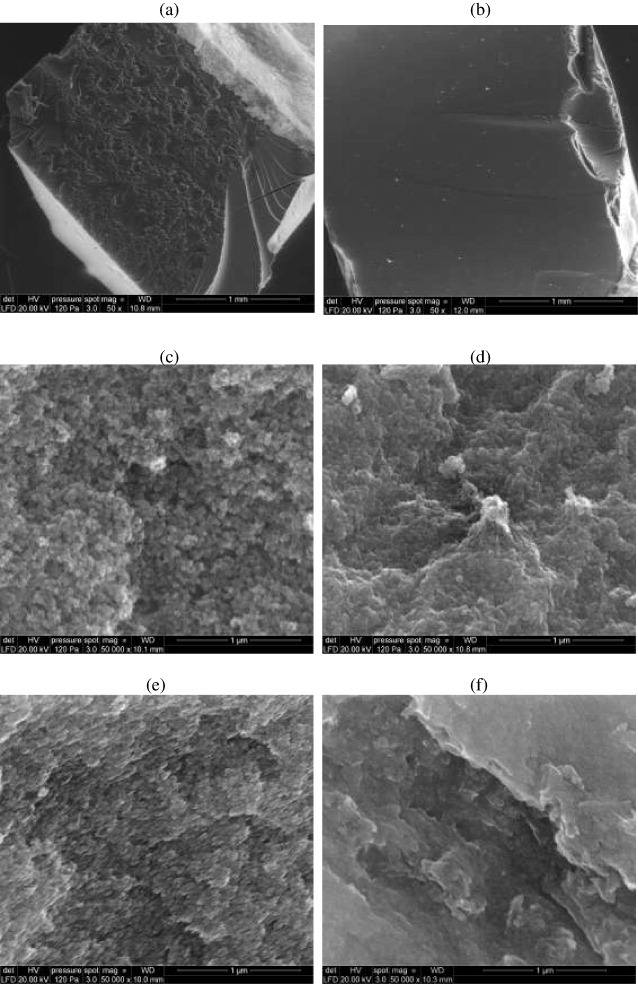
SEM images of TF aerogels at low (50×) and high (50 000×) magnification: (a) ATF18%-10, (b) ATF6%-10, (c) ATF18%-6, (d) ATF18%-10, (e) ATF40%-2, (f) ATF40%-10.
3.3. Thermal and mechanical properties
Figure 9(a) shows the thermal conductivity values of TF aerogels of different densities. Thermal conductivities of ATF were higher than those reported for organic aerogels derived from cellulose [55], the lowest values being similar to those of organic aerogels made from lignin and tannin [20]. The thermal conductivity increased roughly linearly with density, with the zero-density intercept being close to the thermal conductivity of air at room temperature, 0.027 W m−1 K−1.
Figure 9.
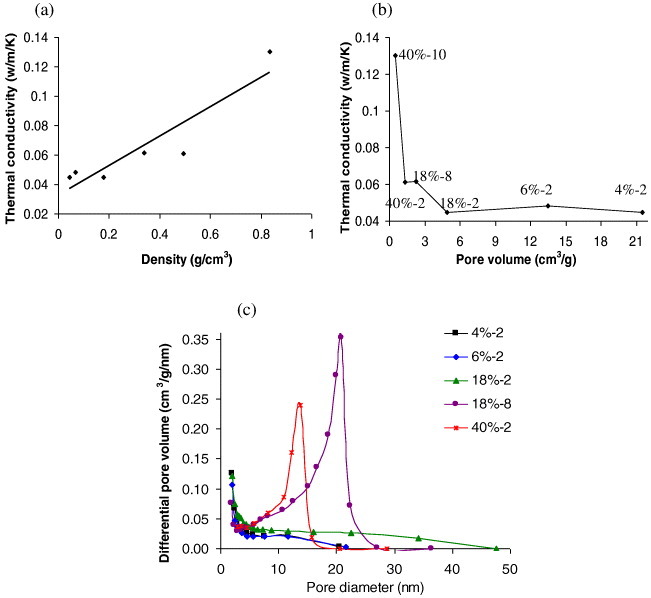
Thermal conductivity of tannin-based aerogels as a function of (a) bulk density and (b) total pore volume (Vp). (c) Pore size distributions of samples from figure 9(b).
Figure 9(b) presents the thermal conductivity as a function of total pore volume, showing saturation for pore volumes greater than 4.5 cm3 g−1. Such behaviour is related to the major role played by gaseous thermal conductivity and agrees with the data in table 1, showing that the main contribution to the very high specific pore volumes in these materials is the macroporosity. Unfortunately, the latter has no influence on the thermal performance. This is the reason for the saturation of thermal conductivity with pore volume. Only extremely narrow pores in which the Knudsen effect is predominant may induce a thermal conductivity lower than that of air [60]. Thus, a minimum thermal conductivity is observed for samples (labelled in figure 9(b)) that simultaneously have a low density and a significant fraction of very narrow pores. This fact is particularly well evidenced in figure 9(c), which reveals lower thermal conductivities for samples with the lowest average pore diameters. Producing material with both the highest pore volume and the lowest pore size would lead to superinsulators, but this remains a true challenge.
As suggested above, shrinkage values could be explained on the basis of the mechanical strength of the hydrogel precursors, expected to be related to the dilution of the resin. To prove this suggestion, we chose three samples prepared at pH 6 and 4, 18 and 40 wt% of TF resin. These hydrogels were compressed when immersed in water to avoid any perturbation due to possible drying during the test. From the slope of the initial, linear part of the strain–stress curves (not shown), the elastic modulus was deduced and is given in table 2. The compressive strength was determined at the point where the curves deviate from linearity by 0.2% strain. This method was suggested by Pekala et al [61] for the mechanical characterization of aerogels and for comparing the strength of different low-density materials. The corresponding values are also reported in table 2. The significant enhancement of mechanical properties with increasing TF concentration correlates with the decrease of shrinkage observed in figure 3 at a constant pH of 6.
Table 2.
Compressive modulus and compressive strength of some tannin–formaldehyde hydrogels and aerogels.
| Samples | Density (g cm−3) | Modulus (MPa) | Compressive strength (MPa) |
|---|---|---|---|
| Hydrogels | |||
| TF4%-6 | 1.07 | 0.03 | 0.01 |
| TF18%-6 | 1.10 | 0.32 | 0.08 |
| TF40%-6 | 1.17 | 2.07 | 1.46 |
| Aerogels | |||
| ATF18%-2 | 0.18 | 0.26 | 0.48 |
| ATF18%-8 | 0.34 | 1.01 | 1.21 |
| ATF40%-2 | 0.49 | 3.19 | – |
| ATF40%-10 | 0.84 | 12.76 | 6.34 |
Flawless aerogel samples were chosen for compression tests, and two different rupture behaviours were observed. Samples with low densities, typically below 0.4 g cm−3, progressively collapsed but retained their monolithic form, forming a kind of pellet after compression. In contrast, samples with higher densities suddenly broke into pieces during the test. Breaking points are marked by arrows in figure 10, which presents the stress–strain characteristics of the aerogels. The modulus was again defined as the slope of the initial, linear part of the strain–stress curve. However, it is neither the elastic nor Young's modulus, given that the aerogels irreversibly deform under compression. The compressive strength was defined in the same way as for hydrogels, and all the data are gathered in table 2.
Figure 10.
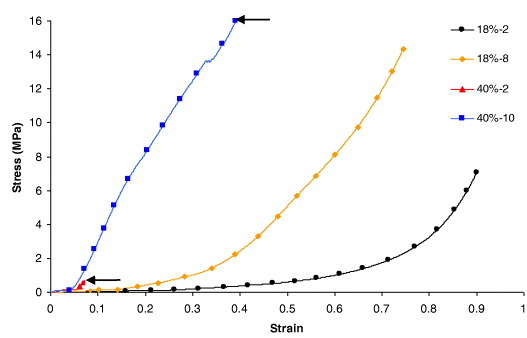
Stress–strain characteristics of TF aerogels submitted to compression.
As expected, the modulus increased as a function of bulk density, and the following relationship, which has been suggested for many porous materials [62] including aerogels ([61, 63] and references therein), has been verified:
Here, c is a constant and n is an exponent that usually ranges from 2 to 4 [61]. For highly regular open-cell foams, the exponent is close to 2.0, whereas ideal closed-cell foams have n = 3.0 ([61] and references therein). Figure 11 shows an example of application of equation (4). The slope of the straight line, n = 2.54, agrees with the values ranging from 2.48 to 2.87 reported for aerogels based on resorcinol–formaldehyde [61].
Figure 11.
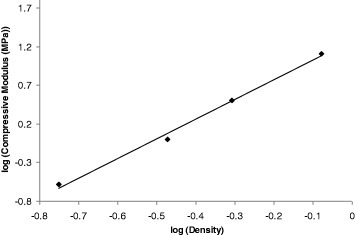
Compressive modulus versus density of selected aerogel samples plotted in a double logarithmic scale.
4. Conclusions
Gelation of wattle tannin in the presence of formaldehyde has been thoroughly investigated through systematic studies of the effects of pH and dilution. The phase diagram constructed contained thermoreversible physical gels, all the other materials being irreversibly crosslinked chemical gels. Supercritical drying under strictly controlled conditions allowed not less than 50 aerogels to be obtained, which were thoroughly characterized for their shrinkage, bulk and skeletal densities, surface area, porous volumes and pore size distributions, microscopic texture, thermal conductivity and mechanical properties. The main conclusions of this work are as follows.
-
1.
With only one exception of low TF resin concentration and high pH, all concentration–pH conditions resulted in gels, where dilution and hence mechanical resistance controlled shrinkage and related final porosity.
-
2.
Physical, thermoreversible gels have been produced at low TF resin concentrations and high pH.
-
3.
There exist an optimal pH and TF resin concentration of 8 and 18%, respectively, which result in the largest mesopore volume.
-
4.
A high surface area of 880 m2 g−1 was measured for samples made at pH 6 and a resin concentration of 10%.
-
5.
Both micropore and mesopore volumes contribute to the surface area.
-
6.
The pore size distribution of chemical aerogels shifts towards narrower sizes with increasing pH.
-
7.
TF aerogels are good thermal insulators, but are not superinsulators.
-
8.
The mechanical properties of TF aerogels follow the expected power law as a function of density.
Carbon aerogels were prepared from such materials, and their porous textures developed further during pyrolysis. These results will be published in the near future.
Acknowledgments
The authors gratefully acknowledge the financial support of the CPER 2007–2013 ‘Structuration du Pôle de Compétitivité Fibres Grand'Est’ (Competitiveness Fibre Cluster), through local (Conseil Général des Vosges), regional (Région Lorraine), national (DRRT and FNADT) and European (FEDER) funds.
References
- Aegerter M A, Leventis N. and Koebel M M. Advances in Sol–Gel Derived Materials and Technologies. New York: Springer; 2011. [Google Scholar]
- Wei G, Liu Y, Zhang X, Yu F. and Du X. Int. J. Heat Mass Transfer. 2011;54:2355. doi: 10.1016/j.ijheatmasstransfer.2011.02.026. [DOI] [Google Scholar]
- Smirnova I, Suttiruengwong S. and Arlt W. J. Non-Cryst. Solids. 2004;350:54. doi: 10.1016/j.jnoncrysol.2004.06.031. [DOI] [Google Scholar]
- García-González C A, Alnaief M. and Smirnova I. Carbohyd. Polym. 2011;86:1425. doi: 10.1016/j.carbpol.2011.06.066. [DOI] [Google Scholar]
- Biesmans G, Randall D, Francais E. and Perrut M. J. Non-Cryst. Solids. 1998;225:36. doi: 10.1016/S0022-3093(98)00103-3. [DOI] [Google Scholar]
- Gorle Babu S K, Smirnova I. and McHugh M A. J. Supercrit. Fluid. 2009;48:85. doi: 10.1016/j.supflu.2008.09.010. [DOI] [Google Scholar]
- Pons A, Casas L, Estop E, Molins E, Harris K D M. and Xu M. J. Non-Cryst. Solids. 2012;358:461. doi: 10.1016/j.jnoncrysol.2011.10.031. [DOI] [Google Scholar]
- Husing N, Schwertfeger F, Tappert W. and Schubert U. J. Non-Cryst. Solids. 1995;186:37. doi: 10.1016/0022-3093(95)00031-3. [DOI] [Google Scholar]
- Ariga K, Vinu A, Yamauchi Y, Ji Q. and Hill J P. Bull. Chem. Soc. Japan. 2012;85:1. doi: 10.1246/bcsj.20110162. [DOI] [Google Scholar]
- Vivero-Escoto J L, Chiang Y D, Wu K C W. and Yamauchi Y. Sci. Technol. Adv. Mater. 2012;13:015001. doi: 10.1088/1468-6996/13/1/013003. [DOI] [PMC free article] [PubMed] [Google Scholar]
- Pizzi A. and Mittal K L. Handbook of Adhesive Technology. vol 2. New York: Dekker; 2003. p. p 573. [Google Scholar]
- Raquez J M, Deléglise M, Lacrampe M F. and Krawczak P. Prog. Polym. Sci. 2010;35:487. doi: 10.1016/j.progpolymsci.2010.01.001. [DOI] [Google Scholar]
- Szczurek A, Amaral-Labat G, Fierro V, Pizzi A, Masson E. and Celzard A. Carbon. 2011;49:2773. doi: 10.1016/j.carbon.2011.03.007. [DOI] [Google Scholar]
- Szczurek A, Amaral-Labat G, Fierro V, Pizzi A, Masson E. and Celzard A. Carbon. 2011;49:2785. doi: 10.1016/j.carbon.2011.03.005. [DOI] [Google Scholar]
- Kraiwattanawong K, Mukai S R, Tamon H. and Lothongkum A W. Micropor. Mesopor. Mater. 2007;98:258. doi: 10.1016/j.micromeso.2006.09.007. [DOI] [Google Scholar]
- Ogata T. and Nakano Y. Water Res. 2005;39:4281. doi: 10.1016/j.watres.2005.06.036. [DOI] [PubMed] [Google Scholar]
- Nakano Y, Takeshita K. and Tsutsumi T. Water Res. 2001;35:496. doi: 10.1016/S0043-1354(00)00279-7. [DOI] [PubMed] [Google Scholar]
- Sengil I A. and Ozacar M. J. Hazard. Mater. 2008;157:277. doi: 10.1016/j.jhazmat.2007.12.115. [DOI] [PubMed] [Google Scholar]
- Sanchez-Martin J, Beltran-Heredia J. and Gibello-Perez P. Chem. Eng. J. 2011;168:1241. doi: 10.1016/j.cej.2011.02.022. [DOI] [Google Scholar]
- Grishechko L I, Amaral-Labat G, Szczurek A, Fierro V, Kuznetsov B N, Pizzi A. and Celzard A. Ind. Crop. Prod. 2013;41:347. doi: 10.1016/j.indcrop.2012.04.052. [DOI] [Google Scholar]
- Grishechko L I, Amaral-Labat G, Szczurek A, Fierro V, Kuznetsov B N. and Celzard A. Micropor. Mesopor. Mater. 2013;168:19. doi: 10.1016/j.micromeso.2012.09.024. [DOI] [Google Scholar]
- Amaral-Labat G, Grishechko L I, Szczurek A, Fierro V, Kuznetsov B N, Pizzi A. and Celzard A. Green Chem. 2012;14:3099. doi: 10.1039/c2gc36263e. [DOI] [Google Scholar]
- Falcão L. and Araújo M E M. J. Cult. Herit. 2011;12:149. doi: 10.1016/j.culher.2010.10.005. [DOI] [Google Scholar]
- Harbertson J F, Parpinello G P, Heymann H. and Downey M O. Food Chem. 2012;131:999. doi: 10.1016/j.foodchem.2011.09.101. [DOI] [Google Scholar]
- Hoong Y B, Paridah M T, Loh Y F, Koh M P, Luqman C A. and Zaidon A. J. Adhes. Sci. Technol. 2010;24:1653. doi: 10.1163/016942410X507740. [DOI] [Google Scholar]
- Ping L, Pizzi A, Guo Z D. and Brosse N. Ind. Crop. Prod. 2012;40:13. doi: 10.1016/j.indcrop.2012.02.039. [DOI] [Google Scholar]
- Grigsby W. and Warnes J. Eur. J. Wood P. 2004;62:433. [Google Scholar]
- Pekala R W, Alviso C T, Fricke J, Gross J. and Lu X. J. Non-Cryst. Solids. 1995;188:34. doi: 10.1016/0022-3093(95)00027-5. [DOI] [Google Scholar]
- Amaral-Labat G, Szczurek A, Fierro V, Pizzi A, Masson E. and Celzard A. Micropor. Mesopor. Mater. 2012;158:272. doi: 10.1016/j.micromeso.2012.03.051. [DOI] [Google Scholar]
- Pizzi A. and Scharfetter H. J. Appl. Polym. Sci. 1978;22:1745. doi: 10.1002/app.1978.070220623. [DOI] [Google Scholar]
- Ping L, Brosse N, Chrusciel L, Navarrete P. and Pizzi A. Ind. Crop. Prod. 2011;33:253. doi: 10.1016/j.indcrop.2010.10.007. [DOI] [Google Scholar]
- Brinker C J. and Scherrer G W. Sol–Gel Science. San Diego: CA: Academic; 1990. [Google Scholar]
- Santos A M M. and Vasconcelos W L. J. Non-Cryst. Solids. 2000;273:145. doi: 10.1016/S0022-3093(00)00126-5. [DOI] [Google Scholar]
- Baetens R, Jelle B P. and Gustavsend A. Energy Build. 2011;43:761. doi: 10.1016/j.enbuild.2010.12.012. [DOI] [Google Scholar]
- Wu D, Fu R, Dresselhaus M S. and Dresselhaus G. Carbon. 2006;44:675. doi: 10.1016/j.carbon.2005.09.022. [DOI] [Google Scholar]
- Zarzycki R, Modrzejewska Z. and Nawrotek K. Ecol. Chem. Eng. S. 2010;17:9. [Google Scholar]
- García-González C A, Camino-Rey M C, Alnaief M, Zetzl C. and Smirnova I. J. Supercrit. Fluids. 2012;66:297. doi: 10.1016/j.supflu.2012.02.026. [DOI] [Google Scholar]
- Shi F, Wang L. and Liu J. Mater. Lett. 2006;60:3718. doi: 10.1016/j.matlet.2006.03.095. [DOI] [Google Scholar]
- Amaral-Labat G, Szczurek A, Fierro V, Masson E, Pizzi A. and Celzard A. Micropor. Mesopor. Mater. 2012;152:240. doi: 10.1016/j.micromeso.2011.11.023. [DOI] [Google Scholar]
- Szczurek A, Amaral-Labat G, Fierro V, Pizzi A, Masson E. and Celzard A. Mater. Chem. Phys. 2011;129:1221. doi: 10.1016/j.matchemphys.2011.06.021. [DOI] [Google Scholar]
- Adebajo M O, Frost R L, Kloprogge J T, Carmody O. and Kokot S. J. Porous Mater. 2003;10:159. doi: 10.1023/A:1027484117065. [DOI] [Google Scholar]
- Yokogawa H. and Yokoyama M. J. Non-Cryst. Solids. 1995;6:23. doi: 10.1016/0022-3093(95)00086-0. [DOI] [Google Scholar]
- Amaral-Labat G, Szczurek A, Fierro V, Stein N, Boulanger C, Pizzi A. and Celzard A. Biomass Bioenerg. 2012;39:274. doi: 10.1016/j.biombioe.2012.01.019. [DOI] [Google Scholar]
- Brunauer S, Emmet P H. and Teller E. J. Am. Chem. Soc. 1938;60:309. doi: 10.1021/ja01269a023. [DOI] [Google Scholar]
- Dubinin M M. Carbon. 1989;27:457. doi: 10.1016/0008-6223(89)90078-X. [DOI] [Google Scholar]
- Gregg S J. and Sing K S W. Adsorption: Surface Area and Porosity. London: Academic; 1982. [Google Scholar]
- Barret E P, Joyner L G. and Halenda P P. J. Am. Chem. Soc. 1951;73:373. doi: 10.1021/ja01145a126. [DOI] [Google Scholar]
- Emmerling A, Petricevic R, Beck A, Wang P, Scheller H. and Fricke J. J. Non-Cryst. Solids. 1995;185:240. doi: 10.1016/0022-3093(95)00021-6. [DOI] [Google Scholar]
- Job N, Panariello F, Marien J, Crine M, Pirard J P. and Léonard A. J. Non-Cryst. Solids. 2006;352:24. doi: 10.1016/j.jnoncrysol.2005.11.024. [DOI] [Google Scholar]
- Britton G. The Biochemistry of Natural Pigments. Cambridge: Cambridge University Press; 1983. [Google Scholar]
- Job N, Pirard R, Marien J. and Pirard J P. Carbon. 2004;42:619. doi: 10.1016/j.carbon.2003.12.072. [DOI] [Google Scholar]
- Job N, Thery A, Pirard R, Marien J, Kocon L, Rouzaud J N, Beguin F. and Pirard J P. Carbon. 2005;43:2481. doi: 10.1016/j.carbon.2005.04.031. [DOI] [Google Scholar]
- Candelaria S L, Chen R, Jeong Y H. and Cao G. Energy Environ. Sci. 2012;5:5619. doi: 10.1039/c1ee02634h. [DOI] [Google Scholar]
- Al-Muhtaseb S A. and Ritter J A. Adv. Mater. 2003;15:101. doi: 10.1002/adma.200390020. [DOI] [Google Scholar]
- Fischer F, Rigacci A, Pirard R, Berthon-Fabry S. and Achard P. Polymer. 2006;47:7636. doi: 10.1016/j.polymer.2006.09.004. [DOI] [Google Scholar]
- Celzard A, Fierro V. and Amaral-Labat G. Supplementary information: adsorption by carbon gels. In: Tascon J M D, editor. Adsorption by Carbons. Amsterdam: Elsevier; 2012. pp. pp 205–44. [Google Scholar]
- Sing K S W, Everett D H, Haul R A W, Moscou L, Pierotti R A, Rouquerol J. and Siemienewska T. Pure Appl. Chem. 1985;57:603. doi: 10.1351/pac198557040603. [DOI] [Google Scholar]
- Pizzi A. Advanced Wood Technology. New York: Dekker; 1994. [Google Scholar]
- Albert D F, Andrews G R, Mendenhall R S. and Bruno J W. J. Non-Cryst. Solids. 2001;296:1. doi: 10.1016/S0022-3093(01)00905-X. [DOI] [Google Scholar]
- Fricke J. Proc. Int. Symp. on Aerogels (Wurzberg, Germany) Berlin: Springer; 1986. p. p 94. [Google Scholar]
- Pekala R W, Alviso C T. and LeMay J D. J. Non-Cryst. Solids. 1990;125:67. doi: 10.1016/0022-3093(90)90324-F. [DOI] [Google Scholar]
- Tuncer E. and Wegener M. Mater. Lett. 2004;58:2815. doi: 10.1016/j.matlet.2004.05.002. [DOI] [Google Scholar]
- Ma H S, Roberts A P, Prévost J H, Jullien R. and Scherer G W. J. Non-Cryst. Solids. 2000;277:127. doi: 10.1016/S0022-3093(00)00288-X. [DOI] [Google Scholar]