Abstract
Well-crystallized (Y0.97−xTb0.03Eux)2(OH)5NO3·nH2O (x = 0–0.03) layered rare-earth hydroxide (LRH) nanoflakes of a pure high-hydration phase have been produced by autoclaving from the nitrate/NH4OH reaction system under the optimized conditions of 100 °C and pH ∼7.0. The flakes were then converted into (Y0.97−xTb0.03Eux)2O3 phosphor nanoplates with color-tunable photoluminescence. Detailed structural characterizations confirmed that LRH solid solutions contained NO3− anions intercalated between the layers. Characteristic Tb3+ and Eu3+ emissions were detected in the ternary LRHs by selectively exciting the two types of activators, and the energy transfer from Tb3+ to Eu3+ was observed. Annealing the LRHs at 1100 °C produced cubic-lattice (Y0.97−xTb0.03Eux)2O3 solid-solution nanoplates with exposed 222 facets. Multicolor, intensity-adjustable luminescence was attained by varying the excitation wavelength from ∼249 nm (the charge transfer excitation band of Eu3+) to 278 nm (the 4f8–4f75d1 transition of Tb3+). Unitizing the efficient Tb3+ to Eu3+ energy transfer, the emission color of (Y0.97−xTb0.03Eux)2O3 was tuned from approximately green to yellowish-orange by varying the Eu3+/Tb3+ ratio. At the optimal Eu3+ content of x = 0.01, the efficiency of energy transfer was ∼91% and the transfer mechanism was suggested to be electric multipole interactions. The phosphor nanoplates developed in this work may be incorporated in luminescent films and find various lighting and display applications.
Keywords: 10.11, 20.03, 20.09
Keywords: layered rare-earth hydroxide, solid solution, color-tunable luminescence, energy transfer
1. Introduction
Rare-earth elements are used in phosphors for fluorescent lamps, white-light-emitting diodes, plasma display panels, flat-panel displays, field emission displays, and cathode-ray tubes. Current advances in high-definition display technologies require fine phosphor particles of well-defined morphology to improve the resolution by reducing pixel size, improve the overall luminescent performance and reduce the size of optoelectronic devices. As the traditional solid-state reaction route generally yields micron-sized phosphor particles with a wide size distribution and considerable aggregation [1], the past decade witnessed a boom in solution-based processing of phosphor particles with better-defined characteristics [2–7]. Y2O3 doped with Eu3+ and Tb3+ ions are among the best-known red-emitting and green-emitting phosphors, respectively, owing to their simple chemical composition, excellent luminescence efficiency, high color purity and long-term stability [8–10]. Tb3+ has also been used as a sensitizer to enhance Eu3+ emission in some phosphor systems such as Y2O2S:Eu3+ [11]. Among the low-dimensional Y2O3:RE phosphors (RE = rare-earth element), zero-dimensional (0D) nanoparticles [12–14] and 1D nanowires/nanotubes [15–19] have been extensively studied for their controlled synthesis, surface modification, size and shape dependent optical properties, and new applications in areas such as bio-analysis [20]. However, reports on 2D nanosheets were rare. In the solution-based processing methodology, oxide phosphors are mostly produced via controlled precursor synthesis followed by proper annealing. The lack of studies on 2D nanophosphors originated from the scarcity of precursor nanosheets or precursor compounds that could be delaminated into nanosheets. A breakthrough came in 2006 [21] when Gandara et al synthesized interlayer-anion exchangeable layered rare-earth hydroxides (LRHs) of the typical composition Ln2(OH)5A·nH2O, where A is interlayer anion such as NO3−, Cl− or Br−; Ln is lanthanide (but may also be Y); and n = 1.5–1.8. Since then, considerable attention has been paid to LRHs owing to the interesting magnetic, catalytic and optical properties of the Ln elements. It was found that the LRH compounds tend to crystallize under roughly neutral pH, either through hydrothermal or refluxing synthesis, and the presence of mineralizers containing anion A helps stabilize the corresponding LRH phase [22–28]. Detailed crystal structure analysis by Sasaki et al [26] revealed two types of coordination environments for Ln3+, that is, eight-fold coordinated [Ln(OH)7(H2O)] (C1 symmetry) and nine-fold coordinated [Ln(OH)8(H2O)] (C4v symmetry) polyhedrons. In the LRH structure, each LnO8 unit is linked to two other LnO8 and four LnO9 groups via edge sharing. The linked polyhedron units form a two-dimensional host layer parallel to the ab plane, with the free anions A located in the interlayer to support the layers and for charge balance. Photoluminescence studies on the Y/Eu binary [29] and Y/Gd/Eu ternary [30] LRH systems showed that the optical properties crucially depend on the local symmetry around Eu3+ ions. Luminescence systematically changes with the dehydration of LRH (decreasing n value), since the loss of crystal water shifts the Eu3+ symmetry from C4v to C1 [29]. It was also found that in the Y/Gd/Eu ternary system Gd3+ preferentially sensitizes the emission of Eu3+ ions possessing C1 local symmetry [30].
Since the host layer of LRH is a close-packed (low energy) crystal plane, the LRH compounds tend to crystallize as nanoplates. The 2D morphologies of the pristine and the exfoliated LRHs are thus well suited for the construction of highly [001] oriented films with improved luminescence, since the [001] orientation maximizes the exposure of Ln activators to the excitation light [31–34]. Meanwhile, the [001] oriented LRH film would transform into a [111] oriented oxide film via quasitopotactic atomic arrangements under proper annealing [31–33], which should result in an enhanced exposure of the close-packed 222 facets of the oxide crystals and thus stronger luminescence [32–34]. Improved catalytic performance may similarly be expected from the maximized Ln exposure.
In view of the importance and wide application of Y2O3:Eu3+ red and Y2O3:Tb3+ green phosphors, Y/Tb binary and Y/Tb/Eu ternary LRHs were synthesized in this work for optical studies of the LRHs and their annealing-derived oxide nanoplates. With Eu3+ incorporation, color-tunable photoluminescence was achieved either by varying the excitation wavelength or through an efficient energy transfer from Tb3+ to Eu3+ ions. In the following sections, we report the phase purity controlled synthesis, detailed structure characterization and optical properties of the LRH compounds and their calcination-derived oxides.
2. Experimental procedures
2.1. Hydrothermal synthesis of LRH solid solutions
The starting rare-earth sources were Ln2O3 (Ln = Y, Tb and Eu; 99.99% purity; Conghua Jianfeng Rare Earth Co. Ltd, Conghua, China). Nitrate solutions of Ln3+ ions were prepared by dissolving the corresponding oxides with a proper amount of hot nitric acid. For each synthesis run, the total Ln3+ concentration was kept at 0.08 mol l−1. Optimal Tb concentration in the Y2O3:Tb3+ green phosphor was previously established at 5 at.% [35, 36], and in this work the Tb/(Y + Tb + Eu) atomic ratio was fixed at 3 at.%. The Eu content in the (Y0.97−xTb0.03Eux) combination was varied in the range of x = 0–0.03 to reveal its effects on the optical properties. In a typical synthesis, a proper amount of ammonium hydroxide solution (25 wt%) was added to the mixed nitrate solution until pH ∼ 7, and the resultant suspension was then transferred into a Teflon-lined stainless steel autoclave after room-temperature homogenization for 30 min under magnetic stirring. The tightly sealed autoclave was placed in an electric oven preheated to a certain temperature in the range of 100–220 °C for a reaction period of 24 h. After natural cooling, the hydrothermal product was collected via centrifugation, washed with distilled water and ethanol, and finally dried in the air at 70 °C for 24 h to yield a white powder for characterization and further processing.
2.2. Characterization techniques
Crystalline phases were identified with an x-ray diffractometer (XRD, Model RINT 2200 V/PC, Rigaku, Tokyo, Japan) operated at 40 kV per 40 mA, using nickel-filtered Cu-Kα radiation and a scanning speed of 1° 2θ per minute. Fourier transform infrared spectroscopy (FTIR, Model 4200, JASCO, Tokyo) measurements were performed using KBr pellets. Morphology and microstructure were analyzed by transmission electron microscopy (TEM, 200 kV, Model JEM-2000FX, JEOL, Tokyo) and field emission scanning electron microscopy (FE-SEM, 10 kV, Model S-5000, Hitachi, Tokyo). Differential thermal analysis/thermogravimetry (DTA/TG, Model Thermo Plus TG8120, Rigaku, Tokyo) of the LRHs was carried out in stagnant air with a heating rate of 10 °C min−1. Photoluminescence (PL), photoluminescence excitation (PLE) and fluorescence decay were analyzed at room temperature using an FP-6500 spectrofluorometer (JASCO, Tokyo) equipped with a 60 mm-diameter integrating sphere (Model ISF-513, JASCO) and a 150 W Xe lamp as the excitation source. Excitation and emission beams were monochromatized with a Rowland concave grating (1800 grooves mm−1). Optical measurements were conducted at a scanning speed of 100 nm min−1, wavelength accuracy of ±0.3 nm and slit widths of 5 nm both in excitation and emission. Spectral response of the system was corrected in the range of 220–850 nm with a Rhodamine-B solution (5.5 g l−1 in ethylene glycol) and a standard light source unit (ECS-333, JASCO) as references.
3. Results and discussion
3.1. Phase-controlled processing, structure characterization and optical properties of the Y/Tb/Eu LRHs
The LRH phase was widely observed to crystallize under approximately neutral pH [22–30]. When keeping solution pH at ∼7.0, we found that processing temperature significantly affects the phase composition of the hydrothermal product, as shown in figure 1 for the example of Y0.965Tb0.03Eu0.005 system. The sample synthesized at 100 °C exhibits a series of strong 00l and sharp 220 diffractions, suggesting that a Ln2(OH)5NO3·nH2O LRH compound with highly ordered host layers has been formed [21–34, 37–40]. The samples processed at higher temperatures up to 200 °C similarly show the 220 diffraction of LRH, but splitting of the 002 and 004 diffractions was clearly observed. Lattice spacing calculations (table S1; see the supplementary material available from stacks.iop.org/STAM/14/015006/mmedia) confirmed that the two additional peaks belong to oscillation diffractions in each case. The above results thus imply that these higher-temperature samples contain two phases with different interlayer distances. Dehydration was believed to be responsible for the appearance of the LRH phase with a shorter interlayer distance. Sasaki and co-workers [26–28] revealed that, in the LRH structure, water molecules are directly coordinated to the Ln atoms to form coordination polyhedrons, instead of being intercalated between the layers, and the loss of hydration water shortens the interlayer distance. This explanation was confirmed by water content analysis of the samples (figure S1). The LRH phase dehydrates up to ∼260 °C [29, 30], and the average water contents derived from the TG curves at 260 °C indeed tend to decrease toward a higher synthesis temperature (table S1). The two phases are thereafter referred to high hydration (HH, larger interlayer spacing) and low hydration (LH) phases. The LH content can be evaluated from the intensities of the 002 diffractions of the HH (IHH002) and LH (ILH002) phases using the ratio ILH002/(IHH002 + ILH002). Results show that the samples synthesized at 130, 150, 180 and 200 °C have ∼40.2, 31.2, 45.8 and 49.2 wt% of the LH phase, respectively. Though the LH fraction tends to increase for a higher processing temperature, attempts to obtain a pure LH phase failed, as already at 220 °C the product changed into an anhydrous Ln4O(OH)9NO3 compound (JCPDS file no. 79-1352, figure 1(f)).
Figure 1.
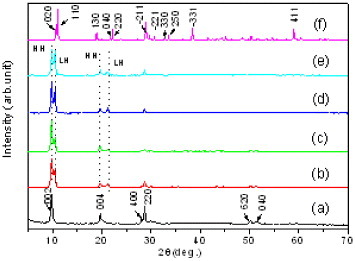
Powder XRD patterns of the hydrothermal products fabricated at (a) 100, (b) 130, (c) 150, (d) 180, (e) 200 and (f) 220 °C. All samples have the same cation combination of Y0.965Tb0.03Eu0.005; HH and LH represent high-hydration and low-hydration phases, respectively.
FTIR spectra (figure S2) of the 100 °C sample show a single and sharp absorption band centered at ∼1387 cm−1, characteristic of free nitrate ions (the v3 vibration mode) in the interlayer of LRHs [21–28, 37, 41, 42]. The additional absorption at ∼3600 cm−1 is indicative of the hydroxide anion (OH−) [38, 39], while the 3380 and 1640 cm−1 peaks can be assigned to the O–H stretching vibrations (ν1 and ν3) and the H–O–H bending mode (ν2) of the water molecules, respectively [38, 39]. This analysis reveals that an LRH compound has been crystallized with free NO3− anions intercalated between the layers, in agreement with the XRD results. Although a shortened interlayer spacing might lead to the coordination of NO3− anions to Ln in the LH phase, FTIR spectra of the samples processed up to 200 °C exhibit the single absorption of free NO3− anion at ∼1387 cm−1, and are clearly different from the spectrum of the Ln4O(OH)9NO3 compound obtained at 220 °C (spectrum d in figure S2). Since the nitrate anions are indirectly linked to Ln via the hydrogen bonding between OH− and NO3− anions in Ln4O(OH)9NO3 [37], two peaks appear at ∼1370 and 1410 cm−1, corresponding to the ν3 vibration of NO3− anion and the ν4 asymmetric stretching of the O–NO2 group, respectively [37, 41, 42].
FE-SEM observation indicated that the product obtained at 100 °C crystallizes as hexagonal nanoflakes with lateral sizes of up to ∼500 nm and thicknesses of up to 80 nm (figure S3). Raising the hydrothermal temperature yields larger crystallites, and at 150 °C some crystallites of up to ∼2 μm in lateral size and over 150 nm in thickness were produced. For the sake of phase purity, however, 100 °C was chosen as the hydrothermal temperature for the further synthesis.
Figure 2 shows XRD patterns of the powders synthesized at 100 °C, with varying x in the Y0.97−xTb0.03Eux combination. The strong 00l and 220 diffractions imply that well-crystallized LRHs have been produced. Splitting of the 00l diffractions was no longer observed in any sample. Closer observations revealed that the 00l diffractions slightly shift to the high-angle side and the 220 diffraction to the low-angle side with increasing Eu3+ concentration. As the 00l diffractions reflect the stacking of host layers along the c-axis of the crystal structure while the 220 diffraction originates within the host layers, the above results thus suggest that the interlayer distance shrinks while the ab plane expands at a higher Eu3+ content. The 002 basal spacing and 220 lattice spacing calculated from the XRD patterns are shown in table S2 (see the supplementary material available from stacks.iop.org/STAM/14/015006/mmedia). The shrinking interlayer distance is again caused by lowered hydration, as seen from the n value (table S2) derived via TG analysis (figure S4). Sasaki and co-workers [26–28] reported that, for the nitrate family of LRH, the hydration number n in Ln2(OH)5NO3·nH2O decreases for a bigger Ln3+ ion, and this accounts for the successively lower hydration with increasing Eu3+ incorporation. We have reported similar phenomena in the Y/Eu binary [29] and Y/Gd/Eu ternary [30] nitrate-LRH systems. The expansion of the ab plane (host layer) results from the incorporation of relatively large Eu3+ ions (for eight-fold coordination,rY3+ = 0.1019 , rTb3+ = 0.1040 and rEu3+ = 0.1066 nm; for nine-fold coordination, rY3+ = 0.1075 , rTb3+ = 0.1095 and rEu3+ = 0.1120 nm) [43]. These results demonstrate that well-crystallized Y/Tb/Eu LRHs have been produced in the solid solution form.
Figure 2.
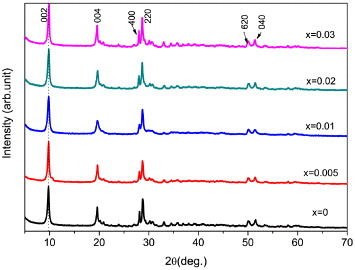
Powder XRD patterns of the Y0.97−xTb0.03Eux LRH samples synthesized at 100 °C.
A low-magnification TEM image (figure 3(a)) shows the typical flake-like nanocrystals of the Y0.965Tb0.03Eu0.005 LRH sample. The hexagonal nanoplates exhibit a relatively wide size distribution and the biggest has a lateral size of ∼500 nm. Platelets as thin as ∼15–20 nm are seen in the micrograph. FE-SEM observations indicate that Eu content does not significantly affect the crystal morphology (figure S5). High-resolution TEM (HR-TEM) analysis clearly resolves lattice fringes of the LRH crystal, and the spacing of 0.312 nm may well correspond to the 220 plane of the host layer (figure 3(b)). Selected area electron diffraction (SAED) yielded well-defined diffraction spots (figure 3(c)), indicating that the object under observation is a well-crystallized single crystal. Indexing the SAED pattern (figure 3(c)) is consistent with the ab plane of the LRH crystal.
Figure 3.

Low-magnification TEM (a) and HR-TEM (b) images and SAED pattern (c) of the Y0.965Tb0.03Eu0.005 LRH.
To elucidate the optical properties of the Y/Tb/Eu ternary system, two binary LRHs of the Y0.995Eu0.005 and Y0.97Tb0.03 combinations were synthesized and their PL and PLE spectra are shown in figure S6 (see the supplementary material available from stacks.iop.org/STAM/14/015006/mmedia). The PLE spectrum of the Y0.995Eu0.005 LRH obtained by monitoring the red emission of Eu3+ ions at 615 nm is composed of a relatively strong charge transfer (CT) excitation band at ∼256 nm and a series of sharp lines in the range 350–550 nm that are ascribed to the intra-4f6 electronic transitions of Eu3+, as labeled in the figure (figure S6(a)). The CT band is assigned to electron transfer from the 2p orbital of O2− to the 4f orbital of Eu3+. Such a strong band was not observed before for the Y/Eu and Gd/Eu binary systems [29, 32] and its origin is still unclear. The PLE of the Y0.97Tb0.03 LRH, recorded by monitoring the green emission of Tb3+ at 545 nm, exhibits a less-defined broad 4f–5d transition band in the 230–295 nm region [44], along with peaks at 295–500 nm that are attributed to the intra-4f8 transitions between the 7F6 and 5H7–4, 5D1,0, 5L10–7,5G6–2, and 5D2–4 levels of Tb3+ (figure S6(a)) [45]. The Y0.965Tb0.03Eu0.005 ternary LRH shows PLE spectra (figure 4(a)) almost identical to those of the Y0.995Eu0.005 and Y0.97Tb0.03 binary LRHs for the 615 and 545 nm emissions, respectively, implying that the characteristic emissions of Eu3+ and Tb3+ can both be obtained by selective excitation.
Figure 4.
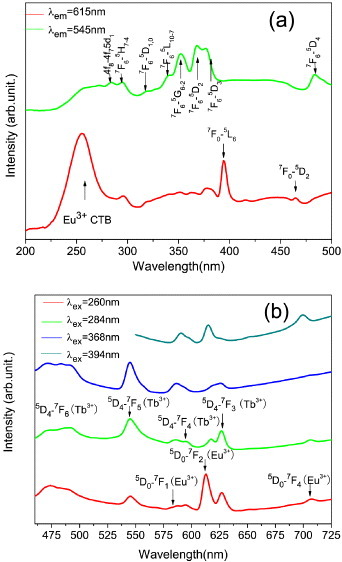
(a) Luminescence excitation spectra of the Y0.965Tb0.03Eu0.005 LRH obtained by monitoring the Eu3+ emission at 615 nm (red line) and Tb3+ emission at 545 nm (green line). (b) Emission spectra of the Y0.965Tb0.03Eu0.005 LRH obtained under the different excitation wavelengths indicated in the figure.
Photoluminescence spectra of the Y0.995Eu0.005 and Y0.97Tb0.03 binary LRHs are shown in figure S6(b). Under 394 nm excitation (the 7F0 → 5L6 transition of Eu3+), the Y0.995Eu0.005 sample exhibits characteristic Eu3+ emissions at ∼593 (5D0 → 7F1), 615 (5D0 → 7F2) and 699 nm (5D0 → 7F4). Exciting the Y0.97Tb0.03 sample at 368 nm (the 7F6 → 5D2 transition of Tb3+, the strongest on the PLE curve) yields a strong green band at ∼545 nm (5D4 → 7F5 transition), weaker blue bands at ∼450 (5D3 → 7F5) and 492 nm (5D4 → 7F6), and minor red bands at 587 (5D4 → 7F4) and 628 nm (5D4 → 7F3) [45]. These typical Tb3+ emissions are also observed in Tb3+-doped Y2O3 [35, 36], Lu2O3 [46, 47] and yttrium aluminum garnet (YAG) [48, 49] green phosphors. Tunable emission (figure 4(b)) was achieved with the Y0.965Tb0.03Eu0.005 ternary LRH by varying the excitation wavelength from 260 (the CT band of Eu3+) to 394 nm (the 7F0 → 5L6 transition of Eu3+), showing the advantages of Tb3+ and Eu3+ codoping. Under 260 nm excitation, the PL spectrum is dominated by Eu3+ emissions, along with weaker ones from Tb3+. The Tb3+ emission is seen because the excitation wavelength resides on the left slope of the 4f–5d transition band of Tb3+ (figure 4(a)). Upon excitation at 284 nm (the 4f8–4f75d1 transition of Tb3+), the sample exhibits strong Tb3+ and weak Eu3+ signals. Eu3+ emission appears since this excitation wavelength is located on the right-hand tail of the CT band of Eu3+ (figure 4(a)). Only Tb3+ and Eu3+ peaks were recorded under 368 and 394 nm excitations, respectively, in accordance with the excitation spectra shown in figure 4(a).
The effects of Eu content on photoluminescence of the Y0.97−xTb0.03Eux ternary LRHs are shown in figure 5 for the two typical excitation wavelengths of 260 (figure 5(a)) and 284 nm (figure 5(b)). Irrespective of the x value, strong Eu3+/weak Tb3+ and strong Tb3+/weak Eu3+ peak combinations were recorded under 260 and 284 nm excitations, respectively, conforming to the results of figure 4(a). The Tb3+ emission intensity decreases while that of Eu3+ increased with Eu3+ content (figure 5(c)), implying the occurrence of energy transfer from Tb3+ to Eu3+. The energy transfer rate increased with Eu3+ content, thereby affecting the emission intensities of both the activators. Figure 5(c) suggests that the energy transfer is more efficient under 284 nm excitation that corresponds to the 4f8–4f75d1 transition of Tb3+. Tunable emission colors can thus be obtained with the Tb3+ and Eu3+ codoped LRHs.
Figure 5.
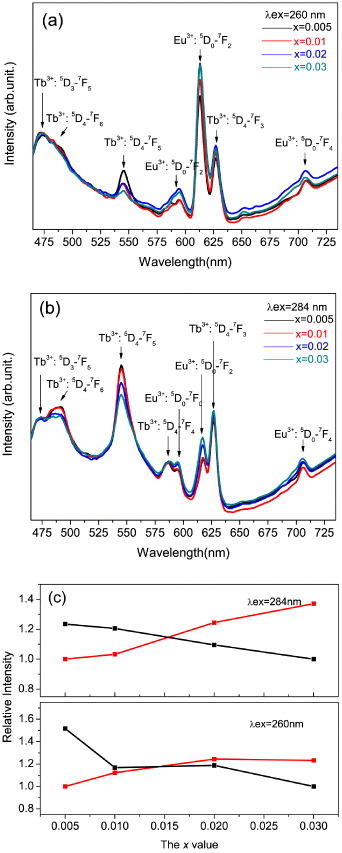
Emission spectra of the Y0.97−xTb0.03Eux LRHs under 260 nm (a) and 284 nm (b) excitation. Panel (c) shows relative intensities of the 615 nm Eu3+ and 545 nm Tb3+ emissions, as a function of the Eu3+ content (the x value).
3.2. Characterization and optical properties of the (Y0.97−xTb0.03Eux)2O3 solid solutions
Tb3+ ions readily oxidize at elevated temperatures to form Tb4+, and thus flowing NH3 (300 ml min−1) was used as a protective/reducing atmosphere upon LRH calcination. The Tb3+-bearing oxides processed up to 900 °C were light brown, suggesting the presence of Tb4+, while those calcined at 1100 °C were white. XRD analysis (figure 6) showed that the 1100 °C samples had high crystallinity and exhibited almost all the diffractions corresponding to the cubic Y2O3 (space group:  , JCPDS no. 89-5591). The d spacing and lattice constant calculated from the 222 diffraction become steadily larger with increasing Eu3+ addition (table S3 see the supplementary material available from stacks.iop.org/STAM/14/015006/mmedia), in accordance with the observed gradual shift of the diffraction peak towards the low angles. This result confirms the successful incorporation of larger Eu3+ and Tb3+ ions into the Y2O3 lattice to form solid solutions.
Figure 6.
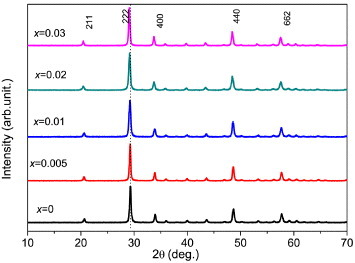
Powder XRD patterns of the (Y0.97−xTb0.03Eux)2O3 samples calcined from their corresponding LRHs at 1100 °C for 4 h under flowing NH3.
FE-SEM images revealed that the oxides largely retain the thin-plate-like shapes of the original LRH crystals, though some plates have partially collapsed due to the strain arising from thermal decomposition (figures 7(a)–(e)). HR-TEM analysis of the lateral surface of an isolated nanoplate clearly resolved lattice fringes with a spacing of ∼0.307 nm that corresponds to the 222 crystal plane of the oxide (figure 7(f)). This complies with the findings of Sasaki and co-workers [32], which showed that the host layer (the ab plane) of LRH would quasitopotactically transform into the 222 plane of the oxide owing to the similar atomic configurations of the two planes.
Figure 7.
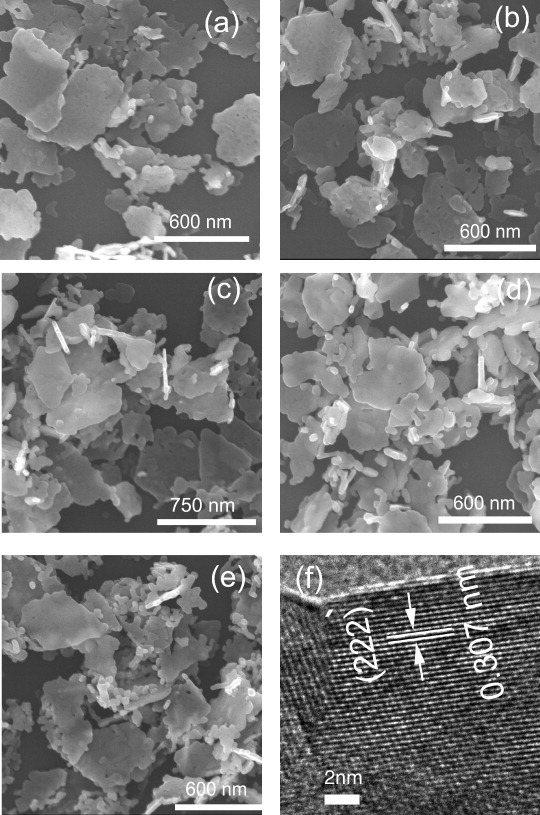
FE-SEM (a)–(e) and HR-TEM (f) images of the (Y0.97−xTb0.03Eux)2O3 solid solutions calcined under flowing NH3 at 1100 °C for 4 h. Panels (a)–(e) correspond to x =0, 0.005, 0.01, 0.02 and 0.03, respectively; the same sample was used for panels (b) and (f).
Figure 8 shows excitation spectra of the Y0.965Tb0.03Eu0.005 ternary and the Y0.995Eu0.005 and Y0.97Tb0.03 binary solid solution oxides obtained by monitoring the red emission of Eu3+ at 613 nm and the green emission of Tb3+ at 543 nm. The Y0.995Eu0.005 sample (spectrum c) shows a sharp and strong CT band at ∼250 nm, together with a weak host excitation band at ∼212 nm, as widely observed for Eu3+-doped Y2O3 red phosphors [5]. The Y0.97Tb0.03 sample exhibits a broad and strong excitation band in the range of ∼225–320 nm, corresponding to the well-documented 4f8–4f75d1 Tb3+ transition (spectrum d) [35]. The doublet at ∼278 and 303 nm arises from the low-spin and high-spin inter-configurational f–d transitions of Tb3+ electrons, respectively [26, 50]. Unlike their LRH counterparts, the oxides show negligible excitations at longer wavelengths, indicating that the most efficient Eu3+ and Tb3+ emissions can be obtained through exciting the CT and 4f8–4f75d1 transition bands, respectively. Monitoring the 543 nm green emission of Tb3+ in the Y0.965Tb0.03Eu0.005 ternary sample yielded a PLE spectrum (curve (b)) almost identical to that of the Y0.97Tb0.03 (curve (d)). Monitoring the 613 nm Eu3+ emission of the same sample, however, produced both the f–d transition band of Tb3+ and the CT band of Eu3+ in the PLE spectrum (curve (a)), with the former even significantly stronger than the latter. This provides persuasive evidence of an efficient energy transfer from Tb3+ to Eu3+, and predicts that stronger Eu3+ luminescence can be achieved by exciting the Tb3+ ions at 278 or 303 nm rather than through the CT band at ∼250 nm.
Figure 8.
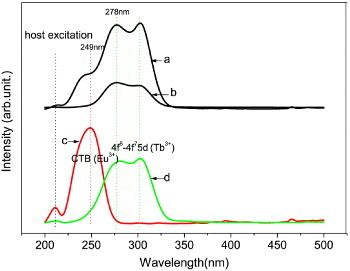
Luminescence excitation spectra of the Y0.965Tb0.03Eu0.005 (a, b), Y0.995Eu0.005 (c) and Y0.97Tb0.03 (d) oxides recorded by monitoring the 613 nm Eu3+ emission (a, c) and 543 nm Tb3+ emission (b, d).
Figure 9 shows the effects of excitation wavelength (249–278 nm) on the luminescence of Y0.965Tb0.03Eu0.005 oxide. The PL spectra exhibit similar features irrespective of the excitation wavelength and are composed of two major emission bands at ∼595 (5D0 → 7F1) and 615 nm (5D0 → 7F2) for Eu3+ and at ∼485 (5D4 → 7F4) and 543 nm (5D4 → 7F3) for Tb3+. The Tb3+ and Eu3+ activators can thus be simultaneously excited by UV light. The emission intensity of both Tb3+ and Eu3+ increases with increasing excitation wavelength. The increase for Tb3+ is readily understandable, since the excitation becomes closer to the center of the strong f–d transition band of Tb3+ (figures 8(a) and (d)). The enhancement of Eu3+ emission, despite moving the excitation away from the center of the CT band, is clearly due to the energy transfer from Tb3+ to Eu3+. Plotting the intensity ratio of the green to red emission (I543/I615) against the excitation wavelength shows that, though the red emission is dominant in each case, green emission gradually gains intensity at longer excitation wavelengths up to 278 nm (figure 9, inset). Color-tunable emission can thus be obtained via selective excitation of the Y0.965Tb0.03Eu0.005 sample. When excited at 249, 260, 265, 270 and 278 nm, the sample has CIE chromaticity coordinates of (0.48,0.39), (0.47,0.42), (0.46,0.42), (0.46,0.43) and (0.46,0.43), respectively. All these emission colors fall into the yellow to greenish-yellow region of the CIE chromaticity diagram but with different proportions of green.
Figure 9.
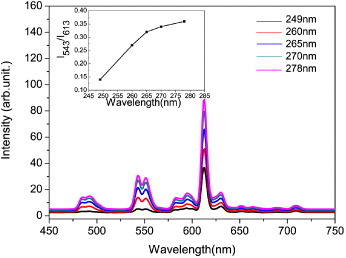
Emission spectra of the Y0.965Tb0.03Eu0.005 solid solution oxide under the various excitation wavelengths indicated in the figure. Inset shows the intensity ratio of the green to red emission (I543/I613) as a function of excitation wavelength.
The effects of Eu content (the x value) on photoluminescence of the Y0.97−xTb0.03Eux oxides were investigated by exciting the 4f8–4f75d1 transition of Tb3+ at 278 nm, and the results are shown in figure 10(a) with the Y0.995Eu0.005 spectrum included for comparison. The Y0.97Tb0.03 sample (x = 0) exhibits the typical emission of Tb3+ in Y2O3 and is characterized by strong bands at ∼543 nm (5D4 → 7F3 transition, green emission) and ∼485 nm (5D4 → 7F4 transition, blue emission). The Y0.995Eu0.005 binary sample only produces weak Eu3+ emissions because the excitation wavelength of 278 nm falls on the tail of the Eu3+ CT band (figure 8, curve (c)), as mentioned above. In the presence of only 0.5 at.% Eu3+ (Y0.965Tb0.03Eu0.005), the intensity of the 543 nm green emission of Tb3+ was drastically reduced to ∼21% of the Eu-free sample. Meanwhile the 613 nm Eu3+ emission increased ∼seven-fold compared to the Y0.995Eu0.005 oxide, indicating a very efficient energy transfer from Tb3+ to Eu3+. The Tb3+ signals gradually weakened with increasing x whereas the Eu3+ emission showed a maximum at x = 0.01.
Figure 10.

(a) Emission spectra of the Y0.97−xTb0.03Eux ternary oxides under 278 nm excitation for x = 0, 0.005, 0.01, 0.02 and 0.03 (curves (a)–(e), respectively). Curve (f) corresponds to the Y0.995Eu0.005 oxide and is included for comparison. The right part shows luminescence of the x = 0 and 0.10 samples under 254 nm excitation from a hand-held UV lamp. (b) Intensities of the 543 and 613 nm emissions normalized to 10, and the I613/I543 intensity ratio versus Eu content (the x value).
Figure 10(b) shows the relative intensities of luminescence and the red-to-green intensity ratio (I613/I543) for the Y0.97−xTb0.03Eux series. The maximum I613/I543 value of ∼8.6 is observed for x = 0.02. The Tb3+ to Eu3+ energy transfer and the varied emission intensities of both the activators conform well to the PLE spectra obtained by monitoring the 613 and 545 nm emissions (figure S7 see the supplementary material available from stacks.iop.org/STAM/14/015006/mmedia). The optimal activator concentration in Y2O3 is ∼5 at.% for either Tb3+ or Eu3+ [35, 36], and this value would also hold for the Tb3+/Eu3+ codoped system. At the maximum Eu3+ emission intensity, the total activator concentration CTb+Eu of 4 at.% is indeed close to 5 at.%. Overdoping leads to the concentration quenching of luminescence via two mechanisms: (i) shortened separation among the neighboring activators, if a uniform dopant distribution was assumed, and (ii) localized dopant distribution (dopant clustering) owing to the lattice strain induced by surplus incorporation of larger Tb3+ and especially Eu3+ ions. Concentration quenching of luminescence was not observed for the LRHs in this and previous studies [28, 29, 32] because in the LRH structure the activators reside at the centers of the [Ln(OH)7(H2O)] and [Ln(OH)8(H2O)] polyhedrons and are well separated from each other. The maximum I613/I543 ratio at x = 0.02 (CTb+Eu = 5 at.%) observed in figure 10(b) might result from an interplay between the efficiency of Tb3+ to Eu3+ energy transfer and the relative extent of concentration quenching between Tb3+ and Eu3+ emissions. In the absence of concentration quenching, the efficiency of Tb3+ to Eu3 energy transfer (η ET ) can be calculated from the fluorescence intensity using the formula [51–53]
where IS and IS0 are the integrated intensities of Tb3+ emission in the presence and in the absence of Eu3+, respectively. Using the experiment results of figure 10(a) and equation (1) the η ET values were estimated at ∼86% for x = 0.005 and 91% for x = 0.01. These high efficiencies of energy transfer primarily originate from the significant spectral overlap between the 5D4 → 7Fj emission of Tb3+ and the 7F0,1 → 5D0,1,2 absorption of Eu3+ [54]. The Tb3+ to Eu3+ energy transfer may occur via exchange interaction and electric multipole interaction; it depends on the average distance (R) between the Tb3+ donor and Eu3+ acceptor ions. Exchange interaction generally requires an overlap of the donor and acceptor orbitals and an R value of less than 0.3–0.4 nm; otherwise, the electric multipole interaction may dominate [55]. The average separation R can be estimated from the following equation proposed by Blasse and Bril [56, 57]
where CTb+Eu is the total concentration of Tb3+ and Eu3+ ions, N is the number of sites that the rare-earth ions can occupy per unit cell and V is the cell volume. Cubic Y2O3 has 80 atoms per unit cell, among which 32 are cations, and therefore N = 32 [5, 58]. With the cell volume shown in table S3, calculations according to equation (2) yield R = 1.328, 1.262, 1.209, 1.125 and 1.061 nm for CTb+Eu = 0.03 , 0.035, 0.04, 0.05 and 0.06, respectively. All these values are significantly larger than the 0.3–0.4 nm required for the exchange interaction mechanism, implying that the Tb3+ to Eu3+ energy transfer largely takes place via electric multipole interactions.
The oxide nanoplates exhibit vivid luminescence colors under 254 nm UV excitation, as shown in figure S8 for all the compositions and in the right part of figure 10(a) for two typical ones. Color-tunable photoluminescence was thus achieved with the Y0.97−xTb0.03Eux phosphors by varying the Eu content, and the CIE chromaticity coordinates (x,y) of the emissions were (0.34,0.53) for x = 0, (0.46,0.43) for x = 0.005, (0.48,0.41) for x = 0.01, (0.50,0.39) for x = 0.02, and (0.49,0.39) for x = 0.03, roughly corresponding to yellowish-green, yellow, yellowish-orange, yellowish-orange and yellowish-white colors, respectively.
Fluorescence kinetics were studied for the 5D0 → 7F2 emission of Eu3+ at 613 nm and the 5D4 → 7F5 transition of Tb3+ at 543 nm. The decay curves (figure S9) can be fitted with the single-exponential function of I = A exp(-t/τR) + B, where τR is the fluorescence lifetime, t is delay time, I is relative intensity and A and B are constants, and the derived fluorescence lifetimes are summarized in table 1. The lifetime of Eu3+ emission slowly yet continuously decreases with increasing Eu content, which might be understood from the following two aspects. Raising the Eu concentration shortens the separation among the luminescent centers, which increases the probability of non-radiative energy transfer among them via electric multipole interactions. It also increases the probability of radiative (resonant) energy transfer among the Eu3+ ions followed by non-radiative transfer to the surface sites. Both mechanisms shorten the fluorescence lifetime. The fluorescence lifetime of Tb3+ emission rapidly decreases from 3.03 ms for x = 0 to 2.10 ms for x = 0.005 and then to 1.89 ms for x = 0.01 due to the energy transfer from Tb3+ to Eu3+, which is frequently observed for donor/acceptor codoped systems [54, 59]. Beside the Tb3+ to Eu3+ energy transfer, other mechanisms such as defect clustering due to lattice strain (mechanism (2) mentioned above for Eu3+) may contribute to the lifetime shortening at larger x values.
Table 1.
Fluorescence lifetimes of the 543 nm Tb3+ and 613 nm Eu3+ emissions for the (Y0.97−xTb0.03Eux)2O3 nanoplates, τR (Tb3+) and τR (Eu3+), respectively.
| x | 0 | 0.005 | 0.01 | 0.02 | 0.03 |
|---|---|---|---|---|---|
| τR (Tb3+) ms | 3.03±0.01 | 2.10±0.01 | 1.89±0.01 | 1.47±0.01 | 1.44±0.01 |
| τR (Eu3+) ms | – | 2.56±0.01 | 2.33±0.01 | 2.27±0.01 | 2.04±0.01 |
4. Conclusions
Multicolor phosphor nanoplates of the Y/Tb/Eu system were produced by optimized hydrothermal synthesis of (Y0.97−xTb0.03Eux)2(OH)5NO3·nH2O LRHs and (Y0.97−xTb0.03Eux)2O3 solid solutions (x = 0–0.03). Detailed characterization by XRD, FTIR, FE-SEM, TEM and optical spectroscopies yielded the following conclusions:
-
1.
Phase-pure LRH can be obtained at pH ∼7.0 and 100 °C, whereas mixtures of high-hydration and low-hydration phases were produced at higher temperatures up to 200 °C.
-
2.
Irrespective of the hydration extent, the LRHs are solid solutions with free NO3− anions intercalated between the layers. The incorporation of relatively large Eu3+ and Tb3+ ions expands the ab planes while reducing the hydration degree and the interlayer distance.
-
3.
Characteristic Tb3+ and Eu3+ emission lines are observed from ternary LRHs when selectively exciting the two types of activators, and the occurrence of energy transfer from Tb3+ to Eu3+ was confirmed.
-
4.
The (Y0.97−xTb0.03Eux)2O3 solid-solution nanoplates annealed from the LRHs at 1100 °C possess exposed 222 facets. The color and intensity of luminescence can be tuned by varying the excitation wavelength from ∼249 nm (the charge transfer excitation band of Eu3+) to 278 nm (the 4f8–4f75d1 transition of Tb3+).
-
5.
Efficient Tb3+ to Eu3+ energy transfer was observed for the (Y0.97−xTb0.03Eux)2O3 phosphor, allowing one to tune the emission color from approximately green to yellowish-orange by varying the Eu3+/Tb3+ atomic ratio.
-
6.
At the optimal Eu3+ content of x = 0.01 for (Y0.97−xTb0.03Eux)2O3, the efficiency of energy transfer was ∼91%, and the transfer was attributed to electric multipole interactions.
Acknowledgments
This work was supported by the National Natural Science Foundation of China (grant numbers 50972025 and 51172038) and the Special Fund for Fundamental Research in Central Universities (grant numbers N110802001 and N100702001). Sincere thanks are due to Dr Renzhi Ma, World Premier International Center for Materials Nanoarchitectonics (MANA), National Institute for Materials (NIMS), for performing TEM analysis. X L Wu would like to thank NIMS for granting a NIMS Internship. We acknowledge the Program for New Century Excellent Talents in University (NCET-11-0076).
References
- Ekambaram S, Patil K C. and Maaza M. J. Alloys Compounds. 2005;393:81. doi: 10.1016/j.jallcom.2004.10.015. [DOI] [Google Scholar]
- Igarashi T, Ihara M, Kusunoki T, Ohno K, Isobe T. and Senna M. Appl. Phys. Lett. 2000;76:1549. doi: 10.1063/1.126092. [DOI] [Google Scholar]
- Dhanaraj J, Jagannathan R, Kutty T R N. and Lu C H. J. Phys. Chem. B. 2001;105:11098. doi: 10.1021/jp0119330. [DOI] [Google Scholar]
- Li J-G, Ikegami T, Mori T. and Yajima Y. J. Am. Ceram. Soc. 2003;86:1493. doi: 10.1111/j.1151-2916.2003.tb03502.x. [DOI] [Google Scholar]
- Li J-G, Li X D, Sun X D. and Ishigaki T. J. Phys. Chem. C. 2008;112:11707. doi: 10.1021/jp802383a. [DOI] [Google Scholar]
- Li J-G, Li X D, Sun X, Ikegami T. and Ishigaki T. Chem. Mater. 2008;20:2274. doi: 10.1021/cm7033257. [DOI] [Google Scholar]
- Li J-G, Zhu Q, Li X D, Sun X D. and Sakka Y. Acta Mater. 2011;59:3688. doi: 10.1016/j.actamat.2011.03.004. [DOI] [Google Scholar]
- Ropp R C. The Chemistry of Artificial Lighting Devices: Lamps, Phosphors and Cathode Ray Tubes. New York: Elsevier; 1993. [Google Scholar]
- Bhargava R N. J. Lumin. 1996;70:85. doi: 10.1016/0022-2313(96)00046-4. [DOI] [Google Scholar]
- Ebendorff-Heidepriem H. and Ehrt D. J. Non-Cryst. Solids. 1999;248:247. doi: 10.1016/S0022-3093(99)00243-4. [DOI] [Google Scholar]
- Kawahara Y, Petrykin V, Ichihara T, Kijima N. and Kakihana M. Chem. Mater. 2006;18:6303. doi: 10.1021/cm060609k. [DOI] [Google Scholar]
- Jadhav A P, Kim C W, Cha H G, Pawar A U, Jadhav N A, Pal U. and Kang Y S. J. Phys. Chem. C. 2009;113:13600. doi: 10.1021/jp903067j. [DOI] [Google Scholar]
- Flores-Gonzalez M A, Villanueva-Ibanez M. and Bazzi R. Bol. Soc. Esp. Ceram. V. 2009;48:141. [Google Scholar]
- Meng Q. et al J. Appl. Phys. 2007;102:015006. doi: 10.1063/1.2803502. [DOI] [Google Scholar]
- Feldmann C. and Merikhi J. J. Mater. Sci. 2003;38:1731. doi: 10.1023/A:1023279710821. [DOI] [Google Scholar]
- Song H W, Yu L X, Yang L M. and Lu S Z. J. Nanosci. Nanotechnol. 2005;5:1519. doi: 10.1166/jnn.2005.318. [DOI] [PubMed] [Google Scholar]
- Devaraju M K, Yin S. and Sato T. Nanotechnology. 2009;20:015006. doi: 10.1088/0957-4484/20/30/305302. [DOI] [PubMed] [Google Scholar]
- Zhong S, Wang S, Xu H, Hou H, Wen Z, Li P, Wang S. and Xu R. J. Mater. Sci. 2009;44:3687. doi: 10.1007/s10853-009-3493-9. [DOI] [Google Scholar]
- Zhu H, Ma Y, Yang H, Zhu P, Du J, Ji C. and Hou D. Solid State Commun. 2010;150:1208. doi: 10.1016/j.ssc.2010.04.017. [DOI] [Google Scholar]
- Setua S, Menon D, Asok A, Nair S. and Koyakutty M. Biomaterials. 2010;31:714. doi: 10.1016/j.biomaterials.2009.09.090. [DOI] [PubMed] [Google Scholar]
- Gandara F, Perles J, Snejko N, Iglesias M, Gomez-Lor B, Gutierrez-Puebla E. and Monge M A. Angew. Chem. Int. Edn Engl. 2006;45:7998. doi: 10.1002/anie.200602502. [DOI] [PubMed] [Google Scholar]
- McIntyre L J, Jackson L K. and Fogg A M. Chem. Mater. 2008;20:335. doi: 10.1021/cm7019284. [DOI] [Google Scholar]
- McIntyre L J, Jackson L K. and Fogg A M. J. Phys. Chem. Solids. 2008;69:1070. doi: 10.1016/j.jpcs.2007.11.004. [DOI] [Google Scholar]
- Poudret L, Prior T J, McIntyre L J. and Fogg A M. Chem. Mater. 2008;20:7447. doi: 10.1021/cm802301a. [DOI] [Google Scholar]
- Lee K H. and Byeon S H. Eur. J. Inorg. Chem. 2009;7:929. [Google Scholar]
- Geng F X, Matsushita Y, Ma R Z, Xin H, Tanaka M, Izumi F, Iyi N. and Sasaki T. J. Am. Chem. Soc. 2008;130:16344. doi: 10.1021/ja807050e. [DOI] [PubMed] [Google Scholar]
- Geng F X, Matsushita Y, Ma R Z, Xin H, Tanaka M, Iyi N. and Sasaki T. Inorg. Chem. 2009;48:6724. doi: 10.1021/ic900669p. [DOI] [PubMed] [Google Scholar]
- Geng F X, Xin H, Matsushita Y, Ma R Z, Tanaka M, Izumi F, Iyi N. and Sasaki T. Chem. Eur. J. 2008;14:9255. doi: 10.1002/chem.200800127. [DOI] [PubMed] [Google Scholar]
- Zhu Q, Li J-G, Zhi C Y, Li X D, Sun X D, Sakka Y, Golberg D. and Bando Y. Chem. Mater. 2010;22:4204. doi: 10.1021/cm1011586. [DOI] [Google Scholar]
- Wu X L, Li J-G, Zhu Q, Li J K, Ma R Z, Sasaki T, Li X D, Sun X D. and Sakka Y. Dalton Trans. 2012;41:1854. doi: 10.1039/c1dt11332a. [DOI] [PubMed] [Google Scholar]
- Hu L F, Ma R Z, Ozawa T C, Geng F X, Iyi N. and Sasaki T. Chem. Commun. 2008;40:4897. doi: 10.1039/b812111g. [DOI] [PubMed] [Google Scholar]
- Hu L F, Ma R Z, Ozawa T C. and Sasaki T. Angew. Chem. Int. Edn. Engl. 2009;48:3846. doi: 10.1002/anie.200806206. [DOI] [PubMed] [Google Scholar]
- Hu L F, Ma R Z, Ozawa T C. and Sasaki T. Inorg. Chem. 2010;49:2960. doi: 10.1021/ic902484v. [DOI] [PubMed] [Google Scholar]
- Zhu Q, Li J-G, Zhi C Y, Ma R Z, Sasaki T, Xu J X, Liu C H, Li X D, Sun X D. and Sakka Y. J. Mater. Chem. 2011;21:6903. doi: 10.1039/c1jM0048a. [DOI] [Google Scholar]
- Flores-Gonzalez M A, Ledoux G, Roux S, Lebbou K, Perriat P. and Tillement O. J. Solid State Chem. 2005;178:989. doi: 10.1016/j.jssc.2004.10.029. [DOI] [Google Scholar]
- Ray S, Patra A. and Pramanik P. Opt. Mater. 2007;30:608. doi: 10.1016/j.optmat.2007.01.013. [DOI] [Google Scholar]
- McIntyre L J, Prior T J. and Fogg A M. Chem. Mater. 2010;22:2635. doi: 10.1021/cm1000208. [DOI] [Google Scholar]
- Geng F X, Ma R Z. and Sasaki T. Acc. Chem. Res. 2010;43:1177. doi: 10.1021/ar900289v. [DOI] [PubMed] [Google Scholar]
- Lee K-H. and Byeon S H. Eur. J. Inorg. Chem. 2009;31:4727. [Google Scholar]
- Lee K-H, Lee B-I, You J-H. and Byeon S-H. Chem. Commun. 2010;46:1461. doi: 10.1039/b922612e. [DOI] [PubMed] [Google Scholar]
- Nakamoto K. Infrared and Raman Spectra of Inorganic and Coordination Compounds. New York: Wiley; 1978. [Google Scholar]
- Sandford S A. Icarus. 1984;60:115. doi: 10.1016/0019-1035(84)90141-6. [DOI] [Google Scholar]
- Shannon R D. Acta Crystallogr. A. 1976;32:751. doi: 10.1107/S0567739476001551. [DOI] [Google Scholar]
- Liu Y, Qian G D, Wang Z Y. and Wang M Q. Appl. Phys. Lett. 2005;86:71907. doi: 10.1063/1.1864233. [DOI] [Google Scholar]
- Wang L, Yan D P, Qin S H, Li S D, Lu J, Evans D G. and Duan X. T Dalton Trans. 2011;40:11781. doi: 10.1039/c1dt10810g. [DOI] [PubMed] [Google Scholar]
- Makhov V N, Lushchik C, Lushchik A, Kirm M, Wang Z F, Zhang W P, Yin M. and Zhao J T. J. Lumin. 2009;129:1711. doi: 10.1016/j.jlumin.2008.12.028. [DOI] [Google Scholar]
- Trojan-Piegza J, Zych E, Hölsä J. and Niittykoski J. J. Phys. Chem. C. 2009;113:20493. doi: 10.1021/jp906127k. [DOI] [Google Scholar]
- Robbins D J, Cockayne B, Lent B. and Glasper J L. Solid State Commun. 1976;20:673. doi: 10.1016/0038-1098(76)90743-2. [DOI] [Google Scholar]
- Van der Weg W F, Popma T J A. and Vink A T. J. Appl. Phys. 1985;57:5450. doi: 10.1063/1.334821. [DOI] [Google Scholar]
- Dorenbos P. J. Lumin. 2000;91:155. doi: 10.1016/S0022-2313(00)00229-5. [DOI] [Google Scholar]
- Kumar G A, Biju P R, Jose G. and Unnikrishnan N V. Mater. Chem. Phys. 1999;60:247. doi: 10.1016/S0254-0584(99)00080-2. [DOI] [Google Scholar]
- Paulose P I, Jose G, Thomas V, Unnikrishnan N V. and Warrier M K R. J. Phys. Chem. Solids. 2003;64:841. doi: 10.1016/S0022-3697(02)00416-X. [DOI] [Google Scholar]
- Rai S. and Hazarika S. Opt. Mater. 2008;30:1343. doi: 10.1016/j.optmat.2007.06.016. [DOI] [Google Scholar]
- Di W, Wang X, Zhu P. and Chen B. J. Solid State Chem. 2007;180:467. doi: 10.1016/j.jssc.2006.11.006. [DOI] [Google Scholar]
- Dexter D L. and Schulman J H. Chem. Phys. 1954;22:1063. [Google Scholar]
- Blasse G. and Bril A. J. Chem. Phys. 1969;51:3252. doi: 10.1063/1.1672503. [DOI] [Google Scholar]
- Blasse G. J. Solid State Chem. 1986;62:207. doi: 10.1016/0022-4596(86)90233-1. [DOI] [Google Scholar]
- Gaboriaud R J, Pailloux F, Guerin P. and Paumier F. J. Phys. D: Appl. Phys. 2000;33:2884. doi: 10.1088/0022-3727/33/22/304. [DOI] [Google Scholar]
- Mukherjee S, Sudarsan V, Vatsa R K, Godbole S V, Kadam R M, Bhatta U M. and Tyagi A K. Nanotechnology. 2008;19:015006. doi: 10.1088/0957-4484/19/32/325704. [DOI] [PubMed] [Google Scholar]


