

Abstract
The experimental exfoliation of layered, ternary transition-metal carbide and nitride compounds, known as MAX phases, into two-dimensional (2D) nanosheets, is a great development in the synthesis of novel low-dimensional inorganic systems. Among the MAX phases, Mo-containing ones might be considered as the source for obtaining Mo2C nanosheets with potentially unique properties, if they could be exfoliated. Here, by using a set of first-principles calculations, we discuss the effect of the interlayer ‘A’ element on the exfoliation of Mo2AC (A = Al, Si, P, Ga, Ge, As or In) MAX phases into the 2D Mo2C nanosheets. Based on the calculated exfoliation energies and the elastic constants, we propose that Mo2InC with the lowest exfoliation energy and the highest elastic constant anisotropy between C11 and C33 might be a suitable compound for exfoliation into 2D Mo2C nanosheets.
Keywords: MAX phase, MXene, Exfoliation, Carbide and nitride, Nanosheet
Introduction
Two-dimensional (2D) nanosheets are expected to have a significant impact on a large variety of applications, ranging from electronic and thermoelectronic to gas storage, catalysis, high-performance sensors, support membranes and coatings [1–3]. These important applications have stimulated tremendous research into the synthesis and characterization of new complex 2D systems. So as to obtain new 2D nanosheets, as a top-down approach, experimentalists have focused on the exfoliation of layered organic and inorganic materials with weak van der Waals interlayer interactions. For instance, monolayers and flakes of 2D graphene were obtained mechanically by rubbing graphite against other surfaces or by the sonication of graphite powder in various aqueous or organic solvents [4]. Similar mechanical techniques were also applied to some of the inorganic layered materials, such as boron nitrides and metal chalcogenides [5, 6]. Recently, a selective chemical etching method with hydrofluoric acid (HF) was proposed to exfoliate some members of a family of highly conductive, tough layered ceramics with strong interlayer interactions, known as the MAX phases, into 2D carbide nanosheets [7–14]. The MAX phases are compounds with the chemical formula of Mn+1AXn(n = 1, 2 or 3) where ‘M’, ‘A’ and ‘X’ are an early transition metal, an element from groups 13–16 in the periodic table, and carbon and/or nitrogen, respectively [15]. After the removal of the interlayer ‘A’ element by HF treatment, the 2D carbide and nitride nanosheets created are called MXenes [7, 8]. By using the above method, three-dimensional particles of Ti2AlC, Ti3AlC2 and Ta3AlC2 were successfully exfoliated into 2D-Ti2C, -Ti3C2 and -Ta4C3 nanosheets [7, 8].
Owing to the large compositional possibilities of the MAX phases, a large number of new 2D Mn+1Xn systems is also expected to be synthesized. The first-principles calculations have shown that the 2D MXenes possess a variety of electronic structures depending on their composition and surface functionalization [16–24]. In addition, some MXenes were predicted to have peculiar properties such as large Seebeck coefficients [21]. Hence, the experimental synthesis and characterization of some of the MXenes are a priority because of their expected remarkable properties for energy-related applications. In this regard, 2D Mo2C is one of the target systems, since it has been predicted to have unique electronic and thermoelectric properties [25]. In addition the nanostructured Mo2C thin films are considered as an active catalyst in a wide variety of reactions: for methane aromatization, hydrodesurfurization, hydrodenitrogenation and so on [26–33].
It is expected that 2D Mo2C nanosheets could be synthesized from the exfoliation of layered Mo2AC powders, using an appropriate selective etchant. The models of bulk Mo2AC and 2D Mo2C nanosheets are presented in figure 1. At least seven possible compositions could be considered for Mo2AC (where A = Al, Si, P, Ga, Ge, As or In) MAX phases. Among them, Mo2GaC has already been experimentally synthesized [34, 35] and was shown to be a superconductor with the transition temperature of 3.7–4.1 K [36]. Mo2AlC has also already been synthesized as a solid solution, (Ti1−xMox)2AlC, and used for the fabrication of a (Ti1−xMox)2AlC/10 wt% Al2O3 composite [37]. There is no reason that the other Mo-containing MAX phases cannot be synthesized in the near future.
Figure 1.
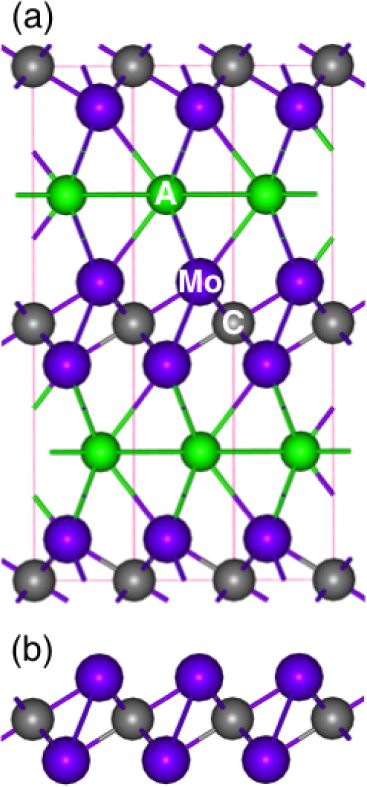
(a) Crystal structure of a Mo2AC system and (b) side view of a 2D Mo2C nanosheet.
Here, using a set of first-principles calculations, we investigate the exfoliation possibility of seven possible layered Mo2AC (A = Al, Si, P, Ga, Ge, As or In) MAX phases into 2D Mo2C nanosheets. First, by calculating the elastic constants, it is shown that the above Mo2AC systems are mechanically stable. Then, considering the elastic constant results and by calculating the exfoliation energies, it is concluded that Mo2InC is the best source to realize a perfect 2D Mo2C nanosheet.
Method of calculations
The first-principles calculations were performed within the framework of the density functional theory with the Perdew–Burke–Ernzerhof version of the generalized gradient approximation (GGA) as the exchange-correlation functional [38]. The projector augmented wave method was used for the basis. In the calculations, a plane-wave cutoff energy of 520 eV was used. The positions of atoms, cell parameters and angles were fully optimized by using the conjugate gradient method and applying the Methfessel–Paxton smearing scheme [39] with a smearing width of 0.1 eV. In the optimized structures, the magnitude of the force acting on each atom became less than 0.005 eV Å−1. The total energies of the optimized structures were well converged within 10−6 eV cell−1. In the structural optimizations of bulks, the Brillouin zone was sampled using a set of 12 × 12 × 4 k points [40]. The densities of states were obtained using 42 × 42 × 18 k points and using a tetrahedron technique. All of the calculations were done by VASP code [41]. We have also performed a set of spin-polarized calculations within GGA. However, all the compounds were found to be non-magnetic. The current GGA approach obtains the equilibrium lattice parameters for Mo2GaC in good agreement with the experimental results within 2% [34, 35].
Mo2AC (A = Al, Si, P, Ga, Ge, As or In) with hexagonal structures adopt P63/mmc space group symmetry. The elastic constants are obtained by means of a Taylor expansion of the total energy of the strained crystal with respect to a small distortion parameter (α), as described in [42]. In this study, the elastic constants are derived from the total energy calculations of nine different distortions α = ± 0.02, ±0.015, ±0.01, ±0.005 and 0.0. The bulk modulus is estimated by fitting the curve of total energies to the third-order Birch–Murnaghan equation of state [43].
Results and discussion
The optimized structures for all Mo2AC (A = Al, Si, P, Ga, Ge, As or In) were obtained. Table 1 presents the optimization results for the lattice parameters of bulk Mo2AC (A = Al, Si, P, Ga, Ge, As or In), and the corresponding Mo–A and Mo–C bond distances. Table 2 indicates the calculation results of the elastic constants and the bulk modulus for the studied Mo2AC systems. Our results in tables 1 and 2 are in excellent agreement with the previous experimental and theoretical studies [34, 35, 44–47]. From table 2, it can be seen that the current results for all Mo2AC systems satisfy the elastic stability criteria: C11 > |C12|,C44 > 0, (C11 + C12)C33 − 2C132 > 0 [48]. Thereby, it is predicted that all above Mo2AC systems are mechanically stable and can probably be formed in particular experimental conditions. However, it should be noted that there might be some other competing phases, which might be thermodynamically more favorable than the Mo2AC systems [49].
Table 1.
Structural parameters and bond distances in bulk Mo2AC (A = Al, Si, P, Ga, Ge, As or In) with P63/mmc symmetry.
| Mo2AC | a (Å) | c (Å) | c/a | Mo–A (Å) | Mo–C (Å) |
|---|---|---|---|---|---|
| Mo2AlC | 3.029, 3.038c | 13.448, 13.48c | 4.440, 4.437c | 2.779 | 2.122 |
| Mo2SiC | 3.103, 3.119c | 12.401, 12.39c | 3.996, 3.972c | 2.643 | 2.133 |
| Mo2PC | 3.185, 3.200c | 11.603, 11.62c | 3.643, 3.612c | 2.565 | 2.150 |
| Mo2GaC | 3.071, 3.01a,b, 3.084c | 13.147, 13.18a,b, 13.16c | 4.281, 4.369a, 4.267c | 2.766 | 2.121 |
| Mo2GeC | 3.135, 3.149c | 12.636, 12.64c | 4.030, 4.040c | 2.718 | 2.134 |
| Mo2AsC | 3.200, 3.225c | 12.210, 12.17c | 3.816, 3.774c | 2.695 | 2.145 |
| Mo2InC | 3.132, 3.140c | 13.980, 14.01c | 4.463, 4.462c | 2.985 | 2.127 |
Table 2.
Calculated elastic constants and bulk moduli of Mo2AC (in GPa; A = Al, Si, P, Ga, Ge, As or In) systems.
| Structure | C11 | C12 | C13 | C33 | C44 | B |
|---|---|---|---|---|---|---|
| Ti2AlC | 304.4, 302a, 305b, 321c | 65.4, 62a, 60b, 76c | 64.0, 61a, 60b, 100c | 269.9, 269a, 275b, 318c | 105.7, 109a, 110b, 144c | 139.3, 138a, 139b, 168c |
| Mo2AlC | 354.4, 333a | 98.0, 97a | 146.7, 144a | 358.9, 327a | 144.4, 137a | 203.0, 196a |
| Mo2SiC | 326.2, 311a | 151.4, 149a | 197.9, 192a | 359.1, 338a | 130.3, 124a | 229.1, 225a |
| Mo2PC | 266.4, 262a | 139.2, 148a | 228.9, 218b | 331.0, 329a | 106.4, 105a | 190.1, 225a |
| Mo2GaC | 312.0, 294a, 306.4d | 94.05, 98a, 105.1d | 163.7, 160a, 169.0d | 313.9, 289a, 311.2d | 128.4, 127a, 102.1d | 191.5, 190a, 248.6d |
| Mo2GeC | 307.1, 299a | 152.7, 151a | 180.5, 170a | 311.9, 325a | 100.9, 97a | 214.4, 212a |
| Mo2AsC | 286.2, 247a | 139.7, 140a | 206.1, 200a | 325.5, 306a | 56.3, 60a | 220.6, 209a |
| Mo2InC | 300.1, 270a | 101.1, 94a | 120.6, 127a | 290.2, 286a | 86.2, 85a | 173.3, 169a |
From table 1, it is found that in Mo2AC systems, the lattice constant a and Mo–C distances are not affected significantly by different A elements. In contrast, the lattice constant c and Mo–A bond distances are strongly affected by different A elements. These trends may indicate that Mo–C bonds are rather stronger than A–A bonds. Indeed, the A–A bond length is larger than twice the corresponding covalent radius of A element. Therefore the lattice constant a is basically determined by the chemical bonds in the Mo2C layers. The strength of Mo–C and Mo–A bonds will be discussed on the basis of the electronic structure below.
Figure 2 shows the calculated band structures of the various Mo2AC systems. It is observed that all Mo2AC structures are metallic, similar to many other MAX phases [50–57]. Figures 3(a)–(g) show the local density of states (LDOS) for each atom. In order to investigate the contribution of each atomic orbital in the LDOS, the projected densities of states (PDOSs), decompositions into each angular momentum channel, are also calculated. As an example, the PDOSs of Mo2GeC are shown in figures 3(h)–(j). In general, the obtained band structure and LDOS features of Mo2AC (A = Al, Si, P, Ga, As or In) are similar.
Figure 2.
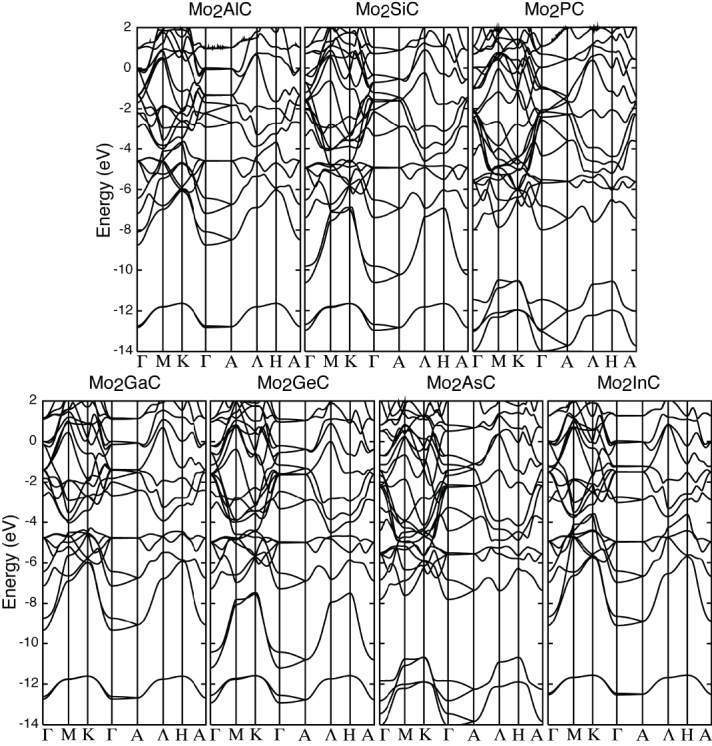
Band structures of Mo2AC (A = Al, Si, P, Ga, Ge, As or In). Γ(0,0,0), M(1/2,0,0), K(1/3,1/3,0), A(0, 0, 1/2), Λ(1/2,0,1/2) and H(1/3,1/3,1/2) symmetry points of the Brillouin zone of a Mo2AC. The Fermi energy is at zero.
Figure 3.

(a)–(f) LDOS for Mo2AC (A = Al, Si, P, Ga, Ge, As or In). (g)–(j) Local projected densities of states of Mo2GeC on different atoms and different atomic orbitals. The Fermi energy is at zero.
Metal atoms usually take part in bonding via their partially filled valence shells. Thereby, in Mo2AC systems, C, Al, Si, P, Ga, Ge, As or In atoms are involved in the bonding states through their outmost s and p orbitals, and Mo is mainly involved through its d orbitals. Accordingly, the hybridizations of Mo-d, C-s, C-p, A-s and A-p orbitals contribute to the LDOS of Mo2AC. As an example, let us discuss the LDOS and PDOS of Mo2GeC in figures 3(g)–(j). In the lowest energy region, the states near −12.0 eV can be clearly assigned as bonding states between C 2s and Mo 4d orbitals. Above these bands, the Ge 4s orbitals form wider bands at energies between −12.0 and −8.0 eV from the hybridization with Mo 4d. The PDOSs of C-p and Ge-p are mainly distributed between −8.0 and −4.0 eV and between −5.0 and −2.0 eV, respectively. These states can be regarded as bonding states between the C 2p/Ge 4p and the Mo 4d orbitals. The states near the Fermi energy are mainly derived from the Mo 4d orbitals.
A strong heteropolar covalent bond is formed when the atomic levels of the paired atoms are close in energy. When the hybridizations are stronger, the bonding states will be created in the lower energies. In the LDOSs of Mo2AC systems in figure 3, it can be seen that the centers of C-s and C-p bands do not vary significantly in the different system. This fact indicates that the strengths of Mo–C bonds in different Mo2AC systems are relatively similar. This is the reason why the Mo–C bond distances of Mo2AC are very similar to ∼ 2.1 Å. In contrast, the centers of the A-s and A-p bands of Mo2AC systems differ significantly, which might imply the different strength of the Mo–A bonds in the different Mo2AC systems. But since the atomic energy levels of A elements (Al, Si, P, Ga, As or In) are different from each other, it is not easy to compare the strength of Mo–A bonds in Mo2AC systems from the LDOSs. However, such information might be inferred indirectly from the calculations of the elastic constants and the exfoliation energy.
Here, we discuss the calculated C11 and C33 elastic constants, which are listed in table 2. Basically, C11 and C33 elastic constants are kinds of quantities that imply the stiffness of overall chemical bonds along the ab and c directions, respectively. It is observed that in the case of Ti2AlC, which was successfully exfoliated into 2D Ti2C nanosheets in the experiments, C11 is larger than C33. Therefore, if C33 is smaller than C11, it might be more feasible to break the Mo–A–Mo bonds under appropriate mechanical and chemical tensions without significantly damaging the Mo–C–Mo bonds. By considering the elastic constants of Mo2AC systems in table 2, it is seen that the C33s of Mo2PC and Mo2AsC are larger than their C11s, while for other compounds, C33 and C11 are similar or C11 is larger than C33. This indicates that in Mo2PC and Mo2AsC, the strength of the chemical bonds along the c lattice is stronger than that of the overall chemical bonds in the ab lattices. Therefore it is suggested that the chance for the exfoliation of Mo2PC and Mo2AsC into 2D Mo2C layers is very little. In contrast, the C33 of Mo2InC is smaller than its C11. This implies more chances for obtaining 2D Mo2C nanosheets from the Mo2InC MAX phase. In addition, from the bulk modulus calculations, it appears that Mo2InC/Mo2SiC is the softest/hardest among the considered Mo2AC systems. It should be noted that the bulk modulus B in hexagonal systems is directly related to C11, C12, C13 and C33 elastic constants: B = (2C11 + 2C12 + 4C13 + C33)/9 [42].
In addition to the elastic constants, the strength of the chemical bonds between Mo and A atoms can be measured in another way by calculating the exfoliation energy of a bulk Mo2AC system into 2D Mo2C. In experiments, the exfoliation occurs dynamically; there are a lot of affecting parameters such as an acidic solution type, the concentration of the acid and the temperature. However, it is impossible or very difficult to simulate the details of this process using the current computational facilities. At present, static calculations are considered as the only way that we can provide some useful information on the exfoliation process. In such calculations, the exfoliation energy is defined by ΔHf = 1/2Etot(Mo2AC) − Etot(Mo2C) − Etot(A), where Etot(Mo2AC), Etot(Mo2C) and Etot(A) stand for the total energies of bulk Mo2AC, 2D Mo2C and the ‘A’ element, respectively. The total energy of an ‘A’ element is estimated from its most stable bulk structure, as indicated in table 3 [58–64]. The results of the exfoliation energies are presented in table 4. For comparison, we have also calculated the exfoliation energy of a 2D Ti2C nanosheet from Ti2AlC, which was experimentally obtained. Thus, the Mo2AC systems with a lower exfoliation energy than Ti2AlC (− 2.668 eV) might be exfoliated into 2D Mo2C nanosheets. Among the studied Mo2AC systems, the exfoliation energy of Mo2InC (− 2.543 eV) is lower than that of Ti2AlC (− 2.668 eV). Therefore, it can be the best candidate for the exfoliation into 2D Mo2C nanosheets.
Table 3.
Structural properties of the ‘A’ metals. The lattice distances are in Å.
| ‘A’ metals | Group symmetry | a | b | c |
|---|---|---|---|---|
| Al | Fm3m | 4.039, 4.041a | 4.039, 4.041a | 4.039, 4.041a |
| Si | Fd3m | 5.468 5.431b | 5.468, 5.431b | 5.468, 5.431b |
| P | P1 | 3.306, 3.313c | 11.260, 10.408c | 4.552, 4.374c |
| Ga | Cmca | 4.579, 4.523d | 7.774, 7.661d | 4.594, 4.524d |
| Ge | Fd3m | 5.783, 5.657e | 5.783, 5.657e | 5.783, 5.657e |
| As | R-3m | 3.815, 3.759f | 3.815, 3.759f | 10.806, 10.457f |
| In | I4/mmm | 3.328, 4.599g | 3.328, 4.599g | 4.977, 4.946g |
Table 4.
Calculated exfoliation energies of M2C from M2AC (A = Al, Si, P, Ga, Ge, As, In or Ti) systems.
| M2AC | Exfoliation energies (eV) |
|---|---|
| Mo2AlC | −3.247 |
| Mo2SiC | −3.058 |
| Mo2PC | −3.247 |
| Mo2GaC | −3.104 |
| Mo2GeC | −2.901 |
| Mo2AsC | −2.818 |
| Mo2InC | −3.544 |
| Ti2AlC | −2.668 |
In the experiment, during the exfoliation process, depending on the utilized etchant, various chemical groups terminate the surfaces of MXenes. In the above exfoliation energy calculations, we discussed the suitability of Mo-containing MAX phases for possible exfoliation, irrespective of the selective etchant. This is because, for example, HF has been observed to work only for the exfoliation of Al-containing MAX-phases, and does not affect/etch the other MAX-phases. Moreover, even if we wish to discuss such issues, in the static calculation approach, since the surface termination energy of 2D Mo2C does not depend on the ‘A’ element, it does not affect the ordering of the exfoliation energies in table 4. As examples of surface termination energies, here we report them for the Mo2C nanosheets functionalized with F, Cl, Br and OH groups (− 7.81, −4.70, −3.90 and −6.86 eV, respectively) [25]. Such large negative energies indicate that Mo2C nanosheets make strong bonds with the F, Cl, Br or OH groups and become more stabilized, especially by F termination.
Finally, it is worth mentioning that there might be other ways to produce 2D Mo2C in addition to the exfoliation of the Mo2AC MAX phases. For example, it has been shown experimentally that thin films of Mo2C can be formed on the top of graphite surfaces resulting from MoO3 reactions with the carbon atoms of graphite [65].
Summary
By using first-principles calculations, we have studied the electronic structures, elastic constants and exfoliation energies of Mo2AC (A = Al, Si, P, Ga, Ge, As or In) MAX phases. On the basis of the above analyses, it is predicted that Mo2InC has the best chance for exfoliation into 2D Mo2C nanosheets. We hope our results would stimulate experimentalists to synthesize various Mo-containing MAX phases and investigate their selective etching and exfoliation into novel 2D Mo2C nanosheets with potentially unique energy-related properties.
References
- Song X, Hu J. and Zeng H. J. Mater. Chem. C. 2013;1:2952. [Google Scholar]
- Butler S Z. ACS Nano. 2013;7:2898. doi: 10.1021/nn400280c. [DOI] [PubMed] [Google Scholar]
- Balendhran S, Walia S, Nili H, Ou J Z, Zhuiykov S, Kaner R B, Sriram S, Bhaskaran M. and Kalantar-Zadeh K. Adv. Funct. Mater. 2013;23:3952. [Google Scholar]
- Novoselov K S, Jiang D, Schedin F, Booth T J, Khotkevich V V, Morozov S V. and Geim A K. Proc. Natl Acad. Sci. USA. 2005;102:10451. doi: 10.1073/pnas.0502848102. [DOI] [PMC free article] [PubMed] [Google Scholar]
- Mars-Ballesté R, Gómez-Navarro C, Gómez-Herrero J. and Zamora F. Nanoscale. 2011;3:20. doi: 10.1039/c0nr00323a. [DOI] [PubMed] [Google Scholar]
- Tang Q. and Zhou Z. Prog. Mater. Sci. 2013;58:1244. [Google Scholar]
- Naguib M, Kurtoglu M, Presser V, Lu J, Niu J, Heon M, Hultman L, Gogotsi Y. and Barsoum M W. Adv. Mater. 2011;23:4248. doi: 10.1002/adma.201102306. [DOI] [PubMed] [Google Scholar]
- Naguib M, Mashtalir O, Carle J, Presser V, Lu J, Hultman L, Gogotsi Y. and Barsoum M W. ACS Nano. 2012;6:1322. doi: 10.1021/nn204153h. [DOI] [PubMed] [Google Scholar]
- Naguib M, Come J, Dyatkin B, Presser V, Taberna P-L, Simon P, Barsoum M W. and Gogotsi Y. Electrochem. Commun. 2012;16:61. [Google Scholar]
- Mashtalir O, Naguib M, Mochalin V N, Agnese Y D, Heon M, Barsoum M W. and Gogotsi Y. Nature Commun. 2013;4:1716. doi: 10.1038/ncomms2664. [DOI] [PubMed] [Google Scholar]
- Chang F, Li C, Yang J, Tang H. and Xue M. Mater. Lett. 2013;109:295. [Google Scholar]
- Zhang X, Xu J, Wang H, Zhang J, Yan H, Pan B, Zhou J. and Xie Y. Angew. Chem. Int. Edn Engl. 2013;52:4361. doi: 10.1002/anie.201300285. [DOI] [PubMed] [Google Scholar]
- Naguib M, Halim J, Lu J, Cook K M, Hultman L, Gogotsi Y. and Barsoum M W. J. Am. Chem. Soc. 2013;135:15966. doi: 10.1021/ja405735d. [DOI] [PubMed] [Google Scholar]
- Lukatskaya M R, Mashtalir O, Ren C E, Dall'Agnese Y, Rozier P, Taberna P L, Naguib M, Simon P, Barsoum M W. and Gogotsi Y. Science. 2013;341:1502. doi: 10.1126/science.1241488. [DOI] [PubMed] [Google Scholar]
- Sun Z M. Int. Mater. Rev. 2011;56:143. [Google Scholar]
- Enyashin N. and Ivanovskii A L. Comput. Theor. Chem. 2012;989:27. [Google Scholar]
- Shein I R. and Ivanovskii A L. Comput. Mater. Sci. 2012;65:104. [Google Scholar]
- Kurtoglu M, Naguib M, Gogotsi Y. and Barsoum M W. MRS Commun. 2012;2:133. [Google Scholar]
- Enyashin A N. and Ivanovskii A L. J. Phys. Chem. C. 2013;117:13637. [Google Scholar]
- Tang Q, Zhou Z. and Shen P. J. Am. Chem. Soc. 2012;134:16909. doi: 10.1021/ja308463r. [DOI] [PubMed] [Google Scholar]
- Khazaei M, Arai M, Sasaki T, Chung C-Y, Venkataramanan N S, Estili M, Sakka Y. and Kawazoe Y. Adv. Funct. Mater. 2013;23:2185. [Google Scholar]
- Xie Y. and Kent P R C. Phys. Rev. B. 2013;87:235441. [Google Scholar]
- Gan L-Y, Huang D. and Schwingenschlögl U. J. Mater. Chem. A. 2013;1:13672. [Google Scholar]
- Enyashin A N. and Ivanovskii A. Solid State Chem. 2013;207:42. [Google Scholar]
- Khazaei M, Arai M, Sasaki T, Estili M. and Sakka Y. 2014 submitted. [Google Scholar]
- Chen H Y, Chen L, Lu Y, Hong Q, Chua H C, Tang S B. and Lin J. Catal. Today. 2004;96:161. [Google Scholar]
- Solymosi F, Németh R, Óvári L. and Egri L. J. Catal. 2000;195:316. [Google Scholar]
- Zhou B, Liu X, Cuervo J. and Salahub D R. Struct. Chem. 2012;23:1459. [Google Scholar]
- Ren J, Wang J, Huo C-F, Wen X D, Cao Z, Yuan S, Li Y. and Jiao H. Surf. Sci. 2007;601:1599. [Google Scholar]
- Shi X-R, Wang S-G, Hu J, Qin Z. and Wang J. Surf. Sci. 2012;606:1187. [Google Scholar]
- Tominaga H. and Nagai M. Appl. Catal. A. 2007;328:35. [Google Scholar]
- Pistonesi C, Juan A, Farkas A P. and Solymosi F. Surf. Sci. 2008;602:2206. [Google Scholar]
- Xing S-K. and Wang G-C. J. Mol. Catal. A. 2013;377:180. [Google Scholar]
- Barsoum M W. Prog. Solid State Chem. 2000;28:201. [Google Scholar]
- Jeitschko W, Nowotny H. and Benesovsky F. Monatsh. Chem. 1963;94:672. [Google Scholar]
- Toth L E. J. Less-Common Met. 1967;13:129. [Google Scholar]
- Zhu J. and Pan R. Mater. Sci. Forum. 2012;724:315. [Google Scholar]
- Perdew J P, Burke K. and Ernzerhof M. Phys. Rev. Lett. 1996;77:3865. doi: 10.1103/PhysRevLett.77.3865. [DOI] [PubMed] [Google Scholar]
- Methfessel M. and Paxton A T. Phys. Rev. B. 1989;40:3616. doi: 10.1103/physrevb.40.3616. [DOI] [PubMed] [Google Scholar]
- Monkhorst H J. and Pack J D. Phys. Rev. B. 1976;13:5188. [Google Scholar]
- Kresse G. and Furthmüller J. Comput. Mater. Sci. 1996;6:15. [Google Scholar]
- Fast L, Wills J M, Johansson B. and Eriksson O. Phys. Rev. B. 1995;51:17431. doi: 10.1103/physrevb.51.17431. [DOI] [PubMed] [Google Scholar]
- Birch F. Phys. Rev. 1974;71:809. [Google Scholar]
- Cover M F, Warschkow O, Bilek M M M. and McKenzie D R. J. Phys.: Condens. Matter. 2009;21:305403. doi: 10.1088/0953-8984/21/30/305403. [DOI] [PubMed] [Google Scholar]
- Rosen J, Dahlqvist M, Simak S I, McKenzie D R. and Bilek M M M. Appl. Phys. Lett. 2010;97:073103. [Google Scholar]
- Sun Z, Li S, Ahuja R. and Schneider J M. Solid State Commun. 2004;129:589. [Google Scholar]
- Shein I R. and Ivanovskii A L. Phys. Status Solidi b. 2011;248:228. [Google Scholar]
- Nye J F. 2010. Physical Properties of Crystals: Their Representation by Tensors and Matrices (New York: Oxford University Press; ) [Google Scholar]
- Dahlqvist M, Alling B. and Rosén J. Phys. Rev. B. 2010;81:220102. [Google Scholar]
- Music D, Emmerlich J. and Schneider J M. J. Phys.: Condens. Matter. 2007;19:136207. [Google Scholar]
- Sun Z, Music D, Ahuja R, Li S. and Schneider J M. Phys. Rev. B. 2004;70:092102. [Google Scholar]
- Yang Z J, Tang L, Guo A M, Cheng X L, Zhu Z H. and Yang X D. J. Appl. Phys. 2013;114:083506. [Google Scholar]
- Emmerlich J, Music D, Houben A, Dronskowski R. and Schneider J M. Phys. Rev. B. 2007;76:224111. [Google Scholar]
- Warner J A, Patil S K R, Khare S V. and Masiulaniec K C. Appl. Phys. Lett. 2006;88:101911. [Google Scholar]
- Daoudi B, Yakoubi A, Beldi L. and Bouhafs B. Acta Mater. 2007;55:4161. [Google Scholar]
- He X, Li Y, Zhu C. and Li M. Solid State Commun. 2009;149:564. [Google Scholar]
- Du Y L, Sun Z M. and Hashimoto H. Physica B. 2010;405:720. [Google Scholar]
- Straumanis M E. J. Appl. Phys. 1949;20:726. [Google Scholar]
- Hom T, Kiszenick W. and Post B. J. Appl. Crystallogr. 1975;8:457. [Google Scholar]
- Cartz L, Srinivasa S R, Riednes R J, Jorgensen J D. and Worlton T G. J. Chem. Phys. 1979;71:1718. [Google Scholar]
- Sharma B D. and Donohue J. Z. Kristallogr. 1962;117:293. [Google Scholar]
- Smakula A. and Kalnajs J. Phys. Rev. 1955;99:1737. [Google Scholar]
- Schiferl D. and Barrett C S. J. Appl. Crystallogr. 1969;2:30. [Google Scholar]
- Ridley N. J. Less-Common Met. 1965;8:354. [Google Scholar]
- Song J, Guo Q, Gao X, Tao Z, Shi J. and Liu L. Carbon. 2011;49:3165. [Google Scholar]