Abstract
The Portevin–Le Chatelier (PLC) effect manifests itself as an unstable plastic flow during tensile tests of some dilute alloys under certain regimes of strain rate and temperature. The plastic strain becomes localized in the form of bands which move along a specimen gauge in various ways as the PLC effect occurs. Because the localization of strain causes degradation of the inherent structural properties and surface quality of materials, understanding the effect is crucial for the effective use of alloys. The characteristic behaviors of localized strain bands and techniques commonly used to study the PLC effect are summarized in this review. A brief overview of experimental findings, the effect of material properties and test parameters on the PLC effect, and some discussion on the mechanisms of the effect are included. Tests for predicting the early failure of structural materials due to embrittlement induced by the PLC effect are also discussed.
Keywords: dislocations, serrated plastic flow, metal surface potential
Introduction
The Portevin–Le Chatelier (PLC) effect occurs in vitally important industrial materials such as steel and aluminum alloys. The localized deformation associated with the PLC effect causes both cosmetic and structural problems. Car bodies, aircraft fuselage and most types of casing made of steel and aluminum alloys can develop rough and unsightly markings on their surfaces during shape-forming processes, as shown in figure 1.
Figure 1.
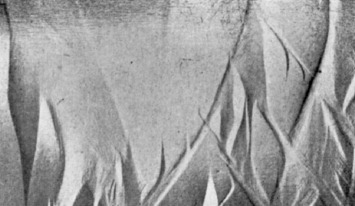
PLC bands formed in an Al–Cu alloy part by shaping processes (reproduced with permission from [153] © 1952 The Institute of Metals).
The PLC effect affects most material properties. It increases flow stress, ultimate tensile strength and the work hardening rate. It decreases the ductility of metals with a corresponding decrease in elongation, the effective gauge cross-sectional area, the strain rate sensitivity coefficient and fracture toughness. Alloys under load become susceptible to unprecedented service failures because of the increased embrittlement and reduced fracture toughness resulting from the PLC effect [1, 2].
When these negative qualities induced by the PLC effect are combined with embrittlement by environmental conditions, material failures are expected to be much more catastrophic. Further embrittlement can result from the presence of hydrogen in gaseous and aqueous environments, which accelerates corrosion processes, or through the physical contact of load-bearing materials with other materials resulting in localized corrosion. Thus, especially for load-bearing and mission-critical materials, the detection of susceptibility to the PLC effect is an imperative issue, as is the monitoring of materials during their service for events related to PLC effect.
The PLC effect has been researched extensively since its discovery in 1909. Investigations started with conventional strain- and stress-controlled tensile tests and have evolved significantly through the addition of novel devices and procedures. Optical, acoustical, thermographic, magnetic, electromagnetic and electrochemical techniques have been applied to correlate the spatio-temporal characteristics of the PLC effect with the associated serrations observed in conventional tensile tests. These imaging and correlation techniques have also been helpful in detecting some microscopic features of the effect that may shed light on possible mechanisms of the plastic instability phenomenon. The empirical studies have provided information on dislocation–solute and dislocation–dislocation interactions, and affirmed the effect of microstructural and bulk specimen characteristics on the dynamic nature of localized strain appearing in various types. The studies that dealt with the influence of inherent material characteristics and external test parameters on the PLC effect have resolved practical issues for industry and have produced sound theoretical explanations for the origin of the unstable plastic flow. Some of the present models simulate all observed features of the PLC effect equally well, even though some of their assumptions are somewhat discrete, especially regarding the role of solutes and vacancies and the type of diffusion. Insights from further experimental work based on new approaches may contribute towards a single generalized model that can be universally accepted.
This paper reviews experimental results and methods concerning the PLC effect and only briefly mentions the commonly proposed interpretations and mechanisms. It starts with describing plastic flow in general, and then moves onto a description of the PLC effect and PLC bands, followed by a summary of the commonly accepted mechanisms of the effect. The implications of some of the empirical findings for the mechanism of the PLC effect are briefly discussed. Then the experimental methods for investigation the PLC effect and the results produced to date are described with an emphasis on the factors known to influence the effect. Some new tests for the prediction of early failure of structural materials in aqueous media due to embrittlement induced by the PLC effect are also presented. Finally, an overall summary of the fundamental achievements related to the PLC effect is given, along with likely future developments.
The PLC effect from macro to micro scale
Plastic flow
The mechanical deformation of crystalline solids is greatly assisted by dislocations. This can be easily shown by calculating the stress associated with one atomic plane sliding over an adjacent plane from the known periodic bonding forces along the slip plane. The resulting value is roughly an order of magnitude lower than the bulk shear modulus defined by experimental elastic deformation of the sample. Typically, the stress required to deform a metal is of the order of a few hundred MPa, at least an order of magnitude less than that expected from the calculation for a sliding atomic plane, and much less than the shear modulus. Thus, the mechanical deformation of metallic alloys requires only a small fraction of the theoretical stress. The theory of dislocations, which explains this paradox, was formulated in the mid-20th century by several scientists. In particular, contributions from Frenkel [3], who is best remembered for his work on defect structures; Schottky [4], known for the Schottky effect in thermionic emission; Burgers [5], who defined the Burgers closure vector; and Cottrell [6], known for the term Cottrell atmosphere and also the dynamic strain aging phenomenon, have helped establish solid foundations for the theory of point defects and dislocations.
Plastic flow in metals and alloys can be explained in terms of the nucleation and motion of dislocations [6–9]. Dislocations are considered as the agents responsible for a steady flow; this, however, does not describe their general contribution to plastic deformation. While it is difficult to deform a metal without dislocations, plastic deformation also becomes much more difficult as the extent of deformation increases. The toughening effect of cold work on metals exemplifies this clearly [10]. The basic mechanism behind this effect is known to be the hindering of the motion of dislocations by the presence of other dislocations [11]. When dislocations pile up, they can block an ongoing stable flow until a sufficient strain is built up to unlock them [12]. Dislocations may also interact with diffused foreign atoms such as the solutes in solid solutions. The solutes tend to migrate towards dislocations, where their energy is lowered [13–15], and hinder the motion of dislocations. This phenomenon, referred to as dislocation pinning by solutes [6, 16], is believed to be the main factor controlling instabilities in plastic flow.
Temperature affects the mobility of solutes and vacancies present in a metallic specimen because heat provides the energy for the motion of point defects. Similarly, the strain rate alters the number and mobility of dislocations nucleated in a material under stress [17, 18]. Temperature and strain rate are the most significant external factors affecting the interactions between defects and the stability of plastic flow. In general, when dislocations move without interacting with each other or with point defects, a steady plastic flow is observed. In other words, the transitions between the enriched and saturated regions of the induced strain in a stressed specimen become smooth in the presence of mobile noninteracting defects. Otherwise, the motion of dislocations is disturbed and the plastic flow becomes unstable [7, 14, 15]. In addition to temperature and strain rate, the stability of plastic flow strongly depends on parameters such as test machine stiffness and geometry and the surface quality of samples. Inherent properties such as alloy composition, crystal lattice, structure, type and amount of solutes, mobile dislocation density, type of obstacle and grain size also affect the instability of plastic deformation of alloys.
PLC effect
When dislocation motion is unstable, the plastic flow is also unstable and appears as strain bursts and arrests in a tensile test curve obtained under a constant load. Under a constant strain rate and temperature the instability appears as serrations in the stress–strain curve with a characteristic range of frequency and amplitudes of stress drops, as shown in figure 2. The PLC effect occurs in both substitutional and interstitial alloys such as alloys of aluminum, copper, zirconium, and austenitic, mild and low-carbon steels [19, 20]. A typical strain rate-temperature range for a serrated flow of the PLC effect for a commercial aluminum alloy is shown in figure 3. Unstable flow was first studied by Le Chatelier [21] in mild carbon steels. Later work by Portevin and Le Chatelier on susceptible substitutional alloys made the effect to be known as the PLC effect [22]. The most distinct feature of the PLC effect is the localization of strain in a section of the stressed specimen and the motion of the localized strain along the specimen with increasing stress, as shown in figure 4. The strain localization manifests itself as bands a few millimeters thick, which are inclined at approximately 55° to the tensile axis and move in various ways on the specimen. Each stress drop of a serrated plastic flow that occurs during a constant-strain-rate test corresponds to a macroscopically observable plastic avalanche of one of these localized bands [23, 24]. Experimental observations have shown that PLC bands are of different types, and the transition between band types may occur upon changes in strain rate and temperature [25, 26].
Figure 2.
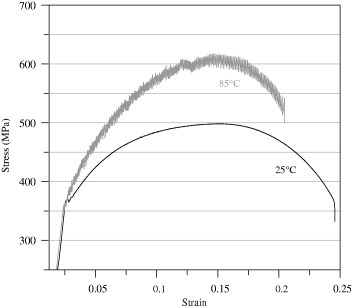
Regular and serrated flows of a low carbon steel strained at 25 and 85 °C at a strain rate of 1.6×10⁻⁶ s−1 (reproduced with permission from [112] © 2011 Springer Science and Business Media).
Figure 3.
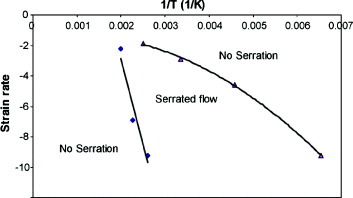
Serrated flow range of the aluminum alloy AA 5083 in the strain rate-reciprocal temperature plane (reproduced with permission from [154] © 2008 Elsevier Ltd).
Figure 4.
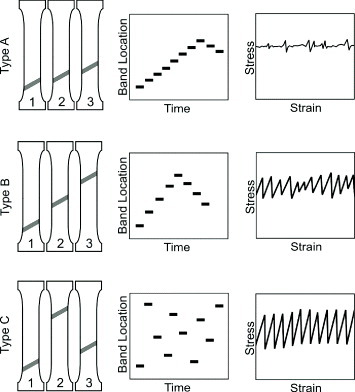
Schematics of motion, orientation, spatio-temporal appearances and strain-controlled tensile curve characteristics of the PLC bands.
PLC bands
Various types of deformation bands induced by the PLC effect are known to exist; each type corresponds to a well-defined serration shape in the tensile test curve, as illustrated in figures 4 and 5. The band types have particular locations in strain rate-temperature plots, as shown in figure 6 for a commercial aluminum alloy sample. The band types are associated with the spatio-temporal organization of dislocations in the effective gauge of a specimen and are assigned as type A, B, or C [27–29]. Type C bands are randomly nucleated, nonpropagating, or hopping bands throughout the specimen gauge and correspond to a tensile test curve with relatively consistent serrations around a certain amplitude and frequency. Type B bands propagate in a gauge in an intermittent manner with roughly equal intervals. The amplitudes and frequencies in the corresponding tensile test curve appear somewhat irregular and are smaller than those of a type C curve. Type A bands propagate continuously in a gauge resembling a longitudinal wave [30], with arbitrarily located small stress drops embedded in the regular flow in the tensile test curve. Not all type A bands are alike. Schwink and Nortmann have distinguished the sudden and the gradual stress drops for type A bands, referred to as type A1 and A2 bands, respectively [27]. Usually, higher strain rates are associated with type A bands, lower strain rates with type C bands and intermediate levels with type B bands [31]. The temperature has the opposite effect on the band type; with type C bands occurring at higher temperatures and type A bands occurring at lower ones.
Figure 5.
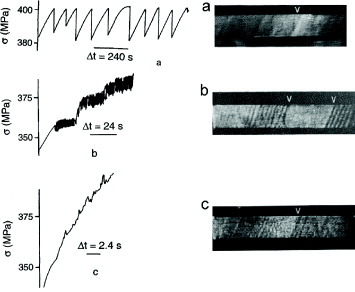
Stress-time curves for an Al–Mg alloy at T=300 K showing the change from type C to type B, and then to type A serrations with increasing strain rate. (a) Type C; 5×10⁻⁶ s−1, (b) type B; 5×10⁻⁴ s−1 and (c) type A; 5×10⁻³ s−1 (reproduced with permission from [28] © 1987 Elsevier Ltd).
Figure 6.
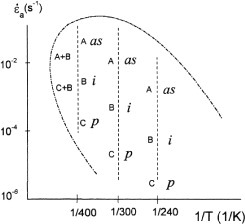
Typical band types (A, B, C, A+B, C+B) in the serrated flow range of an Al–Mg alloy; ‘i’, ‘p’ and ‘as’ refer to the crystal type of the studied sample (reproduced with permission from [140] © 2000 Elsevier Ltd).
Because the deformation bands of the PLC effect are transitional, different types of bands do not occur together except at the critical temperatures and strain rates [32, 33], which are also called the crossover regimes of the bands [31, 34]. Thus, when one type is present, the other types generally disappear. The bands can form in single or multiple locations in the effective gauge of a test specimen [35]. The analysis of serration shapes of mild carbon steels carried out by Cuddy and Leslie has shown that only type C bands form at random locations in a specimen gauge [36]. Similarly, aluminum alloys at certain strain rates and temperatures exhibit only one type of band, until the temperature or strain rate is changed [33, 37–39]. A series of studies conducted by Jiang et al [37, 38] and Ranc and Wagner [40] have shown clear transitions among the serration types in Al–Cu alloys; the transitions have been observed using digital speckle correlation, pyrometric and digital image correlation (DIC) techniques on the surfaces of flat specimens during tensile tests.
Chatterjee et al presented an alternative approach [41], suggesting that all PLC dynamics are governed by a single band which changes its character of motion during deformation. This hypothesis is based on a statistical analysis of stress-time series data taken from tensile tests of Al-2.5% Mg alloy at moderate strain rates. According to the study, only the mode of propagation of the band on the test specimen varies, but the inherent character of the band may stay unchanged. Cassarotto et al [24] also emphasized the same point: type B bands were found to be type A bands that no longer propagated in a soliton-like manner. Optical extensometry and infrared thermography have shown that continuously propagating type A bands are reflected from the ends of a specimen gauge and change their inclination to the opposite direction with respect to the tensile axis after reflection [42], as illustrated in figure 7. Band reflections can also occur at any arbitrary location within a specimen gauge, particularly for type B bands [23]. Some bands, as shown in figure 7, can split at any point in a gauge into two different bands with different orientations traveling in opposite directions, as revealed by Shabadi et al [43]. The crossover phenomenon from continuously propagating type A bands to hopping type B bands has recently been analyzed by Ait-Amokhtar and Fressengeas using digital image correlation and infrared thermography techniques. At the critical temperatures and strain rates, the sequential emergence of type A and type B bands shown in figure 2 has been observed in Al–Mg alloys [31].
Figure 7.
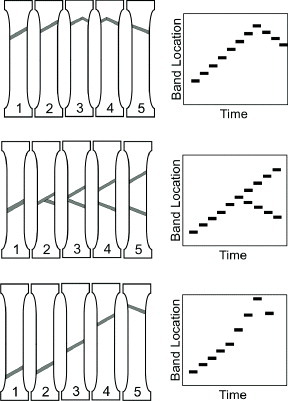
Schematics of reflection, splitting and sequential emergence of PLC bands (type A and type B).
PLC mechanisms
The most commonly accepted explanation for the origin of the PLC effect is based on a model called dynamic strain aging (DSA) [9, 14, 44], which is defined as interaction between the moving dislocations and diffusing solute atoms. The mobile dislocations act as carriers of the plastic strain according to this mechanism, and move unsteadily among the obstacles formed by other defects in the bulk material. Since this early description, the mechanism of the PLC effect has been studied extensively [1]. Copious theoretical work has been reported in the literature including a variety of new simulations and insights into the nature of nucleation and motion of the deformation bands [2].
Recent models have added various new parameters to those discussed in the typical description above. Generally, an evolution factor is added for mobile and forest dislocations because of changes in the local strain within a band [45–47]. It has been considered that the interaction of dislocations with their long-range stress fields is necessary to account for the observed synchronized nucleation, multiplication and propagation in a specimen gauge [48, 49]. Another consideration is that the pipe diffusion of solutes might occur along the dislocation core during the residence time of dislocations at obstacles, together with bulk diffusion across the dislocation core [50–52]. Transmission electron micrographs and a schematic illustrating the pipe diffusion of a solute are given in figure 8.
Figure 8.
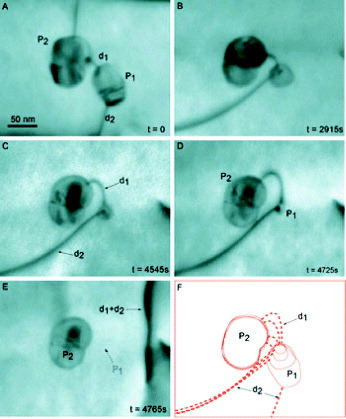
Transmission electron micrographs and schematic showing pipe diffusion of precipitate P1 into precipitate P2 via dislocation line segment d1 (reproduced with permission from [155] © 2001 Elsevier Ltd).
As recently debated, the negative strain rate sensitivity (NSRS) of flow stress, which may occur within a certain range of applied strain rate and temperature, cannot be explained by DSA. It has been shown independently by Hahner [29], Curtin [53] and Olmsted et al [54] that the dynamic strain aging of noninteracting dislocations does not give rise to NSRS. Therefore, a long-range interaction among dislocations is necessary for unstable plastic flow to occur. Such an interaction may be modeled by a stochastic treatment of dislocation dynamics. According to Hahner [29], one of the instabilities corresponding to each band type is associated with a phase transition to a collective mode of slip, which necessitates the combined action of DSA and dislocation self-interactions [29, 55]. Schwink and Nortmann [27] have suggested that unstable plastic flow must include a linear type of diffusion such as pipe diffusion or core diffusion to account for the several different band types which exist in the PLC effect. Other mechanisms have been suggested which avoid the proposed solute contribution entirely. For instance, an experimental study by Korbel et al, on annealed and cold worked α-brasses shows that the relationship between band velocity and dislocation density can be fitted to a common curve. The study considered only measured band parameters such as band velocity, bandwidth and deformation, and it was found that some characteristics of the PLC effect could be explained by collective behavior of dislocations without any requirement of solute diffusion [56].
The strain rate sensitivity of flow stress investigated by Mulford and Kocks [57] for nickel-based and Al–Mg alloys showed some anomalies, which suggested that the DSA mechanism occurs over a much wider temperature range than that in which unstable flow occurs. Figure 9 shows a typical NSRS range in a schematic diagram of strain rate versus reciprocal temperature. The authors reported that NSRS is associated with the contribution of strain hardening to flow stress starting from the beginning of the deformation. In other words, the strain rate sensitivity becomes negative only after strain hardening becomes dominant. In addition, the critical strain for a serrated flow to occur is independent of the vacancy population [58]. Thus, the interpretation of the PLC effect in terms of interactions of moving dislocations with mobile solutes has been questioned. Subsequently, a dislocation arrest model has been more widely accepted, in which solute atoms diffuse along dislocations at forest intersections [57]. Some investigations by Weiss et al [59] using acoustic emission (AE) techniques on single-crystal ice specimens compressed under constant loads support the idea of interactions among dislocations, a model currently supported by many researchers. The authors reported that AE bursts reveal a power law distribution of type A bands, which should result only from dislocation–dislocation elastic interactions.
Figure 9.
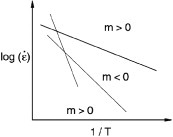
Schematic map of NSRS of an Al–Mg alloy. The PLC effect appears in the m <0 region, while the DSA mechanism appears in a wider area of the strain rate-reciprocal temperature plane (reproduced with permission from [156] © 2004 Elsevier Ltd).
In addition to dilute substitutional alloys, carbon steels are also well known to be prone to the PLC effect. It has long been proposed that this sensitivity originates from the high carbon content of the steels [60]. Carbon steels allow the easy permeation of hydrogen, which may interact with foreign atoms such as carbon and nitrogen existing in the metal and promote the interaction of all solutes with dislocations [2, 61]. A common explanation of the PLC effect for carbon steels is based on reaching a critical strain required to produce a sufficient number of vacancies, that permit carbon diffusion to the dislocation cores, as discussed in depth by Chen et al and others [62–64]. The experimental results of McCormick [65] were in agreement with a model based on mobile dislocations being temporarily arrested at obstacles in the slip path, which was a new proposal at that time. However, more recently, Sarkar et al [66] have shown that there is marginal deterministic chaos in the PLC effect in low-carbon steels. From their analysis of stress time series using a nonlinear dynamical approach, they concluded that the dynamics of the PLC effect in interstitial alloys is much more complex than that in the substitutional Al–Mg alloys.
Although earlier models assumed that vacancies do not contribute to the PLC effect in interstitial alloys [58, 67], an alternative proposal from Almeida et al [68], based on a mechanism involving temperature-induced diffusion, includes vacancy contributions in light of the results of tensile tests carried out on austenitic steels. According to the work, the PLC effect occurs when carbon-vacancy and nitrogen-vacancy complexes are reoriented in the regions where dislocations are arrested or decelerated; this occur at high and low temperatures but not at intermediate temperatures. At intermediate temperatures these complexes are not concentrated in any region because of their higher mobility and higher equilibrium concentration.
In addition to the typical dislocation-solute mechanism, there are many other interpretations of the PLC effect based on various experimentally supported approaches [34, 48, 67, 69–71]. Recent simulations have reproduced empirical observations reasonably well as regards the features of all types of the bands and the crossover phenomenon [72–74]. Generally, some basic assumptions used for a particular interpretation have been found to be unsatisfactory in other interpretations [34]. However, when the complexities of the PLC effect are taken into account [34, 59], and considering the time and effort that will be required to develop new and more accurate experiments to obtain further information and insights on microscopic band nucleation events, even the contributions from imperfect models will be crucial.
In most cases, the proposed models for the PLC effect are associated with only the particular specimen studied, and there are various modeling approaches which describe the unsteady flow behavior of a particular alloy equally well [55]. It is widely acknowledged that most theoretical treatments do not provide an explanation for the exact microscopic nature of the observed PLC bands [23, 34, 75, 76]. An excellent review of the models describing the PLC effect by Ananthakrishna [34] explains in detail the main sources of difficulty and complexity in modeling from statistical, stochastic and dynamical view points, and examines and compares recent models. Ananthakrishna points out that the dissipative and irreversible nature of dislocation processes, the dominant role of nonlinearities, strain localization and the tensor character of dislocations as line defects are the main difficulties in developing a generalized model.
Investigation methods
Many researchers have observed band characteristics and attempted to correlate the serrated flow and discrete physical events on or in metal specimen during the PLC effect. Most correlation studies employed optical, magnetic, thermographic, or acoustic techniques to monitor the specimens. Some studies involved magnetic flux leakage measurements of ferritic materials, and a few applied electromagnetic and electrochemical techniques. The basic characteristics of these investigation methods are briefly compared in table 1.
Table 1.
Common techniques for investigating PLC effect and their basic characteristics.
| Investigation technique | Basic characteristics |
|---|---|
| Digital image correlation | Visually reveals strain fields with high spatial and temporal precision |
| Speckle pattern interferometry | Allows quantitative analysis by precise vector field displacement measurements on specimen surfaces |
| Laser scanning extensometry | Provides accurate data on the band speed and localized strain along the specimen |
| Thermography | High data acquisition frequency enables accurate detection of temporal features of the PLC bands |
| Acoustic emission | Efficiently monitors PLC events and number of dislocations involved in strain localization |
| Magnetic flux measurements | Suitable for ferromagnetic materials |
| Electric field measurements | Correlate air-metal interface charge fluctuations with PLC band events |
| Electrochemical measurements | Correlate electrolyte-metal interface charge fluctuations with PLC band events in aqueous environments |
Optical methods
Digital image correlation
Optical methods, including DIC, speckle pattern metrology and optical extensometry are widely used to characterize the PLC effect. They accurately resolve the local strain fields of bands and their spatio-temporal characteristics within the gauge length. DIC is a powerful technique that is able to detect the distinct features of strain localization in the PLC effect. This method provides quantitative data on the changes in strain fields even within the deformation bands, with a high time resolution [77, 78]. A schematic of the setup and an example of the band strain resolution obtained by the method are given in figure 10. In addition to conventional tensile test equipment, a high-speed digital camera and computer processing are required for this relatively new image acquisition method. To examine the nucleation and motion of PLC bands, the entire gauge section of a sample is imaged using a digital camera generally operating at 30 frames per second or higher. The recorded digital images are then analyzed by the software, which calculates the displacement vector field using successive pairs of images. Then, strain maps of the entire specimen surface are generated for each image [79].
Figure 10.
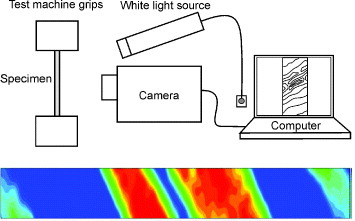
Basic DIC setup (above) and DIC pattern of two developing PLC bands nucleated consecutively (below). The red color represents the highest local strain (reproduced with permission from [51] © 1998 Wiley-VCH Verlag Berlin GMBH).
The preparation of the specimen surface significantly affects the quality of the images and the resulting data; therefore, the flatness and smoothness of specimens are important. Generally, the accuracy of strain measurements by the DIC method is within ±0.001 [80]. In some studies flat specimen surfaces are covered with a randomly distributed speckle pattern created by spray paint to produce a better physical reference for the image recording system and the correlation software [81]. DIC measurements have confirmed the common observation that the kinetics of strain buildup within a band changes when the stress is changed [80, 82]. It has also been shown by DIC that drops in the stress–strain curve are directly correlated with band nucleation and the subsequent strain buildup inside the band, as can be seen in figure 11. The bands remain unchanged during increases in stress, and cyclic strain accumulation occurs outside the bands shortly before a new band is generated [82]. A procedure recently developed by Casarotto et al [24] uses the DIC technique with a triggered CMOS camera and a line-scan camera to correlate the changes in local and global strains by scanning both surfaces of a flat specimen.
Figure 11.
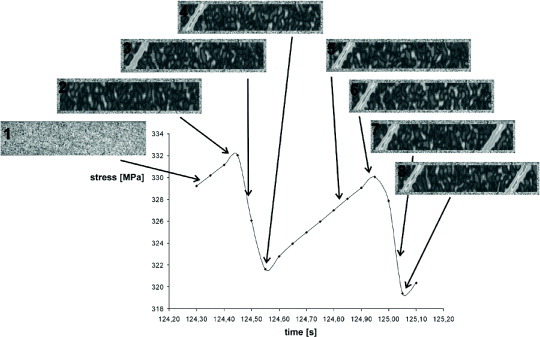
Band nucleation upon lowering of external stress. No significant change in strain occurs within the band when the stress is increased (reproduced with permission from [55] © 2003 Elsevier Ltd).
Speckle pattern interferometry
Digital speckle pattern correlation (DSPC) is another commonly used technique for the investigation of PLC bands. It is based on laser scanning extensometry (LSE) [25], which was improved by Zhang et al [83]. A schematic of the setup is shown in figure 12. During a tensile test, a flat specimen gauge is illuminated by two laser beams set at the same oblique angle on the same plane, and the change in the fringe pattern during the motion of PLC bands is recorded by a high-speed digital camera as described by Jiang et al [38, 84]. Another procedure, the laser speckle technique (LST), has been derived from DSPC by Shabadi et al [43]. The technique involves observing changes in the grainy appearance of a deforming sample surface illuminated by a coherent light source such as an expanded (diffused) laser beam. Then an active PLC band propagating through the specimen gauge causes a disturbance in the grainy appearance (i.e. the ‘speckle pattern’), making it distinguishable from the rest of the gauge as shown in figure 13. The contrast of the speckle patterns is improved by subtracting consecutive images from each other. The LST was found to be equally effective for alloys subjected to any type of heat treatment. Arevalo et al [85] compared the DIC and DSPC techniques using martensitic steel specimens. Since the DIC technique uses white light illumination it provides better visual information. However, the DSPC technique yields better quantitative results, owing to the greater precision in measuring displacement vector fields from the specimen surface illuminated by the laser. Using DSPC Xiang et al [86] have shown that the nucleation of type B bands starts at the surface of a specimen gauge and grow into the bulk at a certain inclination. The same study also revealed that each stress drop corresponds to an avalanche-like deformation inside the band and shrinkage outside the band, with both events occurring within a few milliseconds. For type A bands, much smaller, consecutively occurring avalanches have been detected, corresponding to band propagation of much less than the bandwidth, demonstrating the high resolution of the method. These capabilities of the DSPC technique have clarified the transitions between the band types, such as between type C and type B, in some alloys for the first time [37].
Figure 12.
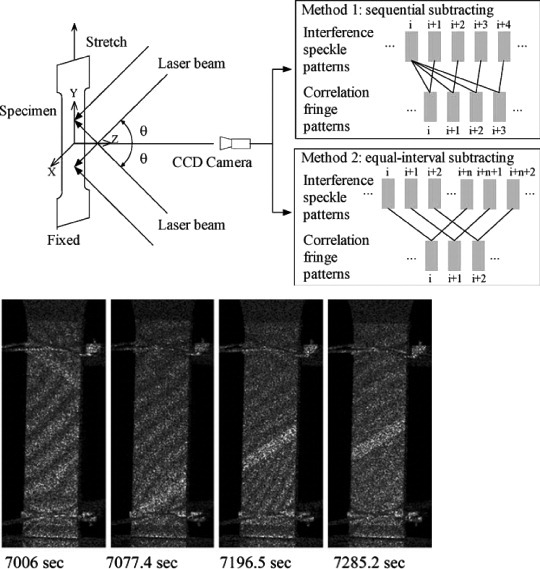
DSPC setup used with two different imaging methods (above). Random nucleation of PLC bands (below) (reproduced with permission from [56] © 1976 Elsevier Ltd).
Figure 13.
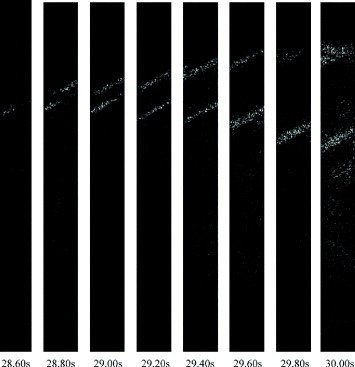
Band splitting observed using the DSPC technique (reproduced with permission from [43] © 2004 Elsevier B.V.).
Laser scanning extensometry
Another laser technique for monitoring the PLC effects is multi-zone LSE developed by Zeigenbein et al [25]. The technique reveals one-dimensional information, and its spatial resolution is related to the size of patterns drawn on the specimen surface [87]. It has been used to monitor the propagation of PLC bands, yields quantitative information on the band speed, and measures the strain along the specimen gauge in a line parallel to the specimen axis [25, 30, 88]. LSE has proven to be a valuable tool for establishing direct correlations between the spatio-temporal characteristics of the PLC effect and the global information from a tensile test machine in the investigations of Zeigenbein et al [25]. Examples of stress–temperature and stress–strain diagrams obtained by the method are shown in figure 14.
Figure 14.
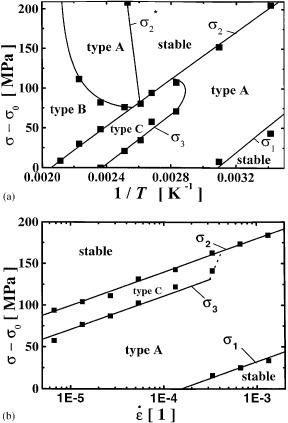
Stress–temperature (a), and stress–strain (b) diagrams for an Al–Cu alloy measured by the LSE technique (σ−σ0: reduced flow stress=external flow stress – initial yield stress) (reproduced with permission from [25] © 2000 Elsevier B.V.).
The typical resolution of the above optical techniques when applied to the spatial features of PLC bands can be less than half a millimeter, which remains high compared with the width of the bands, with a strain resolution of approximately 0.005%. These techniques and their combinations or derivatives are easy to set up and relatively straightforward to carry out because of the availability of state of the art cameras with high resolution and speed and image acquisition software.
Thermographic techniques
Plastic strain is always accompanied by heat dissipation due to the associated mechanical work, which causes a temperature increase in the strained region [89]. Infrared thermography and pyrometry are therefore promising for quantifying PLC band features such as bandwidth, velocity, inclination and localized strain [90]. Thermographic techniques allow the measurement of temperature fields on a strained specimen surface using an infrared camera with a capture rate of about 200 frames per second and a noise level of less than 0.02 °C [91]. The recorded temperatures are converted to dissipated heat powers using the heat transfer equation. Then, the dissipated powers are correlated with the stress and plastic strain to create strain maps and visualize PLC band events. A typical thermal map of a propagating type A PLC band is shown in figure 15. To visualize the formation of PLC bands and accurately determine the band velocities, the thermal camera may be coupled with a pyrometer in an infrared pyrometry system such as that used by Ranc and Wagner [92]. Generally, the specimen surface is coated with a thin layer of black dye to homogenize the surface emissivity [40]. As thermographic methods have much higher data acquisition frequencies than DIC, DSPC and LST they are better at resolving the temporal features of PLC bands.
Figure 15.
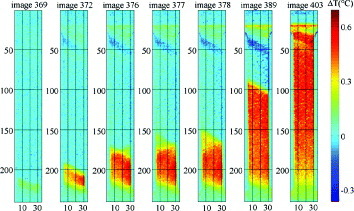
Temperature increase during the nucleation and propagation of a type A band measured by a thermographic method (reproduced with permission from [64] © 1998 Springer Science and Business Media).
Ranc and Wagner [92] and Louche and Chrysochoos [93] demonstrated this capability of thermographic methods by clearly distinguishing hopping type B bands from propagating type A bands. Using temperature field measurements, Ait-Amokhtar et al found a difference between type A and type B bands that has not been possible to detect by other means. For Al–Mg alloys, the hopping of type B bands has been related to a quasi-isothermal process, while nucleation and propagation of type A bands is quasi-adiabatic [31, 91]. Ranc and Wagner studied an Al–Cu alloy at a constant strain rate and temperature and found that several type B bands can nucleate in the effective gauge of a specimen with a certain time interval between consecutive nucleations. The average interval was 95 ms, and band formation occurred within 1.5 ms of a stress drop [92]. Note that the time between successive serrations varies in proportion to the reciprocal strain rate, provided the plastic events take place under similar strains. The formation time of each band, which is determined by the dislocation dynamics and the stress history during plastic relaxation, does not necessarily depend on the strain rate. The bandwidth in the same study was estimated to be 3.5 mm and the band inclination with respect to the tensile axis as 62°. Thus, in common with the optical methods, the thermographic and pyrometric techniques also allow precise measurements of the characteristic times and location of PLC bands.
Acoustic emission
Acoustic emission (AE) techniques have long been used for the detection of cracks in structural materials to avoid catastrophic failure during service [94]. Plastic instabilities in alloys such as crack nucleation and propagation, twinning and dislocation motion are always accompanied by pronounced AE activity resulting from sudden local changes in inelastic strain [95]. This activity can be correlated with PLC band events by separating the signature of dislocation motion from those of other instabilities occurring in an alloy under a tensile test, as demonstrated experimentally by Chmelik et al [33, 96], Weiss et al [59] and other researchers [97–99]. The correlation of acoustic signals with PLC band events is shown in figure 16. Generally, a miniature piezoelectric transducer is used to record the acoustic data, and a linear source location tool enables the correlation of AE burst signals with their exact location in an effective gauge. The sensor is attached to a waveguide and is generally welded to the specimen, and several types of filters and threshold identifiers have been used to separate signals due to PLC activity from those originating from other AE sources [94]. Members of Chmelik's group have extensively used AE monitoring and analysis methods to investigate the PLC effect in Al–Cu alloys [33, 96, 100]. They have shown that each stress drop in a serrated flow corresponds to a movement of at least 104 dislocations in any metal [33]. Some striking differences between the propagation of Lüders bands and PLC bands have been noted in another study of the same authors on Al-1.5% Mg alloys [96]. Furthermore, it is argued that the ‘cooperative character’ of dislocation motion is a necessary condition for emission of acoustic waves [33, 59, 94, 101]. Thus, AE monitoring is superior to other techniques for detecting event counts due to the PLC effect.
Figure 16.
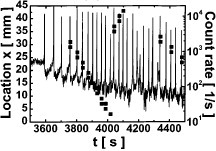
Correlation of acoustic signals with band location and count rate (reproduced with permission from [45] © 1990 Elsevier B.V.).
Magnetic flux measurements
Magnetic flux leakage (MFL) measurements are generally used for detecting fine defects in metals [102]. Usually a sample of a ferromagnetic material is placed in an intense magnetic field which induces magnetic saturation. Then a magnetic Barkhausen sensor combined with some amplifiers and band-pass filters is used to detect defects and their locations. Dhar et al [103] and Sanchez et al [104] have shown that both the Lüders bands and serrated flow due to the PLC effect can be accurately detected by MFL measurements, and the flux leakage in these particular bands originates from the decreasing magnetic permeability due to localized plastic deformation. Only a few studies have applied the MFL technique to PLC bands. However, MFL measurements are nondestructive and are promising for monitoring the flux leakage of ferromagnetic materials, such as carbon steels, that are prone to the PLC effect.
Electric field measurements
Schmitter correlated the electric field emission from the surface of a tensile test specimen with the PLC effect. This experimental method, new to the field, uses an electrical field sensor (an antenna) to monitor the intermittent plastic flow of aluminum and steel specimens [105]. He confirmed a precise correlation between the observed electric field emission and PLC band events, as shown in figure 17, which provided insights into the charges at the air–metal interface and their density fluctuations. Schmitter explained that the brittle oxide layer on the tensile test specimens is broken down by the emerging slip steps, exposing the dislocation core domains at the interface during a serrated plastic flow induced by the PLC effect. Then, the stress field around dislocation core domains alters the electron density, inducing a measurable electric field [105, 106]. Schmitter's study also revealed some striking similarities between the PLC effect and earthquake events, as the Gutenberg–Richter law holds for data obtained from the tensile tests conducted. This similarity has been confirmed by prominent experimentalists and theoreticians [33, 94, 95, 107, 108].
Figure 17.
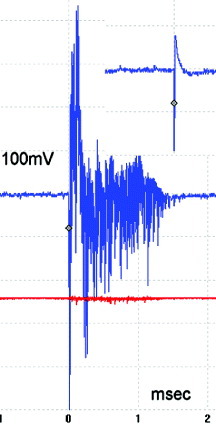
Electrical signature of a single event (top-right inset) and multiple dislocation events (avalanche) (reproduced with permission from [78] © 2007 Elsevier B.V.).
Electrochemical measurements
Darowicki and Orlikowski [109] have examined the effect of impressed potential on the impedance behavior of an aluminum tensile test specimen during the unstable flow of the PLC effect. The observed change in impedance during the PLC effect is greater when the alloy is less passive, i.e. when the surface oxide films are thinner or more brittle. The mechanism responsible for the observed change in impedance may involve the slip steps, which carry extra charges, becoming exposed to the electrolyte, causing the impedance to change [110]. It could also be due to charge separation in the outer oxide layers of the test specimen [111]. Regardless the dominant factor, the work of Darowicki and Orlikowski has shown that PLC band events are correlated with the impedance behavior of the metal under investigation under various impressed potentials.
A recent work [112] on PLC band events examined the metal–electrolyte interface potential in an aqueous environment. The work revealed precise correlations of the PLC serration amplitude with fluctuations of the metal surface potential in a ground water electrolyte. The amplitude–potential correlations were attributed to the increase in the electrical resistance of metals by the formation of dislocations via cold work or the PLC effect [113]. An edge dislocation, for instance, contains an extra plane of ions above and below the slip plane, which are bound states where the conduction electrons are trapped, resulting in increased electrical resistivity [106, 110]. During a serrated plastic flow induced by the PLC effect, the oxide layer is broken down by the emerging slip steps exposing the dislocation core domains at the metal–electrolyte interface. Hence, the stress field around dislocation cores alters the electron density and induces potential fluctuations, which then can be detected with a Luggin probe using the electrochemical cell setup illustrated in figure 18. Because the corrosion potential is a directly observable electrical parameter representing the number of electrons at the metal–electrolyte interface, it may reveal more information than other electrochemical parameters such as impedance and cell current.
Figure 18.
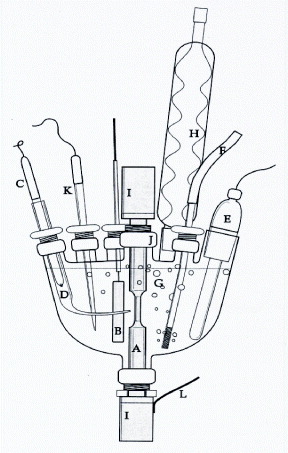
Schematic of an electrochemical setup for detection of the surface potential of an alloy subjected to the serrated flow induced by the PLC effect in an aqueous environment (A: specimen, B: platinum auxiliary electrode, C: reference electrode, D: Luggin probe, E: quartz heater, F: gas-purging capillary, G: electrolyte, H: condenser, I: universal joints, J: O-ring seal threaded joints, K: thermowell, L: electrical connection to the specimen (working electrode) (reproduced with permission from [112] © 2011 Springer Science and Business Media).
Important results
Factors influencing PLC effect
Particle dispersion
The dispersion of particles within an alloy also affects the critical conditions required for instability of the PLC effect to occur, as shown by the experimental studies of Estrin and Lebyodkin [114] and Brechet and Estrin [115], who also reported that the extent of the influence depends on the volume fraction of added particles and their spatial arrangement in the studied specimen. Pink and Krol [116] demonstrated that the formation of dislocation avalanches can be prevented or at least reduced by the addition of non-shearable obstacles. However, the addition of 2–5 vol.% alumina particles into AA 5754 Al–Mg alloy produced almost no effect on the serration behavior in uniaxial tensile tests at various constant strain rates carried out by Dierke et al [117], who attributed this result to the inhomogeneous distribution of the dispersion particles during the manufacture of the test alloy. Furthermore, the experimental investigations of Dablij and Zeghloul indicate that precipitate shearing does not cause serrated flow even if precipitation is thermodynamically possible [118].
These conclusions are consistent with the experimental work of Thevenet et al [119], who found that precipitation reduces the tendency for serrated flow to occur but that the underlying mechanism depends on the type of precipitate. The rates of precipitation in the aluminum alloy studied were increased by the addition of a large amount of copper, which suppressed the serrated flow after 2–3 h of solution treatment. It was observed that the Guinier–Preston (GP) zones are the most effective precipitates to reduce serrations. Chen et al [60] reported that different types of precipitates have different influences on the PLC effect. GP zones and an unstable phase in aluminum alloy AA 7055 can delay the PLC effect, which is promoted by the existence of a stable phase. Jiang found that the PLC effect in solution-treated Al-4% Cu alloys sets earlier than in annealed materials [84]. In some cases, an increase in solute concentration enhances the PLC effect, and subsequent precipitate formation reduces the effect. This has been observed in Al–Cu alloys by Liang et al [120] and in Mg–Li–Al alloys by Wang et al [121].
Shape, size, and surface finish
Zdunek et al found that the flow instability of Al alloy samples increases with the ratio of specimen perimeter to its cross sectional area. The PLC effect was more pronounced in rectangular and T-shaped specimens than in square and circular ones [122]. The bandwidth always increases with increasing specimen thickness [123]. Zhang et al [83] used cylindrical specimens of different diameters under various imposed strain rates. They showed that the bandwidth increases linearly with the specimen diameter with a proportionality constant of 0.50–0.67. The different strain rates imposed by Jiang et al [37] did not have a significant effect on the bandwidth. Thus far, no correlation has been reported between the band type and either specimen thickness or bandwidth [32].
The surface finish of samples also affects their susceptibility to the PLC effect. For example, Abbadi et al [124] found that at a particular strain rate and temperature, the tensile test curves had serrations for unpolished aluminum alloy specimens but were perfectly smooth for specimens polished to 3000 grit or more. It has been reported that the rolling of metal sheets increases their surface roughness and that the surface defects induced by rolling increase the local stress and can induce the nucleation of PLC bands. The authors also found that the bands propagated about twice as fast in polished specimens than in unpolished specimens in stress-controlled tensile tests, that is, the propagation velocity, among other parameters, strongly depends on the surface quality. The same authors reported that the range of temperatures and strain rates over which the PLC effect occurs is greater when the surface quality of a specimen is inferior. This is consistent with the results of experiments of Kang et al [125], who found a strong correlation between the localized strain of PLC bands and the surface roughness as evaluated by confocal microscopy.
The characteristic behavior of PLC bands is also affected by whether the tensile test is stress- or strain-controlled (‘soft’ and ‘hard’ tensile machine types, respectively). The temperature regime of the PLC effect expands noticeably towards higher temperatures as the test machine becomes softer [124]. For instance, it increased from <120 °C with a strain-controlled hard machine to <140 °C with a stress-controlled soft machine. Abbadi et al [124] and Kumar et al [126] have independently observed that the temperature and strain rate ranges over which the PLC effect occurs widen and the domains shrink with increasing loading rate. Under a constant strain rate, the hopping type B bands propagate continuously in soft machines [88], as do type C bands tested with hard machines. This behavior is explained by the high levels of external stress retained by controlling the stress rate. This prevents the local drops in stress that occur when the crosshead speed is controlled and instead produces strain avalanches due to plastic relaxation. The observed periods of continuous band propagation with rather high velocities have been attributed to some intrinsic properties of the studied materials, which allow local stress concentrations to emerge that are caused by moving dislocation groups near the surface of the crystal grains [127].
Critical strain
The critical strain for an alloy to be subjected to the PLC effect depends on the strain rate and temperature. The critical strain, analyzed by a number of tests on substitutional alloys, has an Arrhenius type relationship with the test temperature [128]. An increase in the critical strain with increasing strain rate or with decreasing temperature is referred to as ‘normal’ behavior, while the opposite can also be observed and is referred to as inverse behavior [26, 75, 129, 130]. While inverse behavior is attributed mostly to inhomogeneity, it also occurs in homogeneous solid solutions. In a pressurized low-carbon steel, measurements of the strain rate and temperature dependence of critical strain carried out by McCormick revealed an activation energy of 84.9 kJ mole−1 and a strain exponent of 0.72 in the mobile dislocation density–strain relationship. These numbers agree with a model for the onset of serrated yield based on the strain aging of mobile dislocations temporarily arrested at obstacles in the slip path [65].
Crystal size, orientation, and dislocation density
Kovacs et al [131] studied the effect of crystal orientation by considering the micro-indentation of individual grains. They found that the unstable flow is more pronounced when the direction of indentation is close to the crystallographic orientation 〈100〉; in other words, when the diagonal of the indenter in the Vickers test coincides with the 〈110〉 direction [131]. Shen et al [132] also observed the influence of the crystal orientation on the PLC effect in a study carried out on solution-treated and peak-aged 2090 Al–Li alloys. While no serrations were observed in the central section of the studied specimens, the surface layer, which was oriented differently from the center, exhibited serrations [108]. This is in contrast to the study of Shabadi et al [43], where the specimen orientation did not affect the magnitude of the serrations of the PLC effect in solution-treated AA 2219 alloy specimens. A smaller grain size promotes the PLC effect, as confirmed for 5086 Al–Mg alloys [133]. Chen et al [128] analyzed the critical strain in a series of tests on face-centered substitutional alloys and found Arrhenius-type relationships between critical strain and test temperature for numerous systems. Their data disagree with Cottrell's model because of the need for a critical mobile dislocation density. Chen et al [128] used the concept of local vacancy enrichment in the region near the dislocation core to account for their observed Arrhenius relationships. This concept also explains the observed grain size [133].
Regarding the dislocation density, Chen et al [60] emphasized the obstructive effect of the initial high dislocation density on the mobility of dislocations, as observed in AA 7055 aluminum alloys and confirmed by others [96]. This result also largely explains the phenomenon of the Lüders band, another type of instability that occurs at the onset of plastic deformation. Korbel et al [56] showed that an increase in mobile dislocation density decreases the PLC band velocity and increases the band strain. The experimental results can therefore be fit to a common curve illustrating the relationship between band velocity and dislocation density, independent of the initial history of the alloys. This author has also observed the PLC effect under athermal deformation. Once thermally activated, the PLC effect disappears, resulting in a stable flow [16, 56, 134].
Schwarz performed a series of experiments that helped clarify whether vacancies influence the PLC effect [58]. He combined conventional tensile testing with the sensitive measurement of internal friction (attenuation of vibrations) and provided convincing arguments against the involvement of vacancies in PLC mechanisms.
Fundamental achievements
A number of new findings have been added to those of the earliest investigators, Portevin and Le Chatelier [21, 22]. Penning [8] reported that two stable deformation regimes, a slow regime and a fast one, must coexist for the PLC effect to occur under a constant stress. He recognized the NSRS as a condition for repeated yielding or a serrated flow, which is a decrease in the flow stress with an increase in the applied strain rate [8, 48, 55], or vice versa. Later this decrease in the band velocity with increasing stress rate was observed for various alloys by numerous researchers [118, 124]. The dependence on temperature and strain rate has been studied rigorously, and all observations have shown that the serrated flow of a particular metal occurs at particular strain rates in combination with suitable temperatures [7, 8, 135–138], a feature that many authors have directly connected to the matching of the mobility of solutes with that of dislocations [7, 138, 139]. Because of the long-observed reproducible and well-established temperature–strain rate relationship, Lebyodkin et al proposed the construction of a phase diagram based on strain rate versus reciprocal temperature [49, 140]. Such diagrams have been used by many prominent researchers [32, 48, 88], and are a convenient and practical way of presenting data.
In the last few decades, through the development of better experimental techniques and more precise measuring equipment, such as more sensitive load cells and strain gauges, sensitive temperature measurement and recording tools, high-speed digital cameras, and comprehensive data acquisition software running on fast computers, it has become possible to record the behavior of different band types in detail. The spatio-temporal features of the deformation bands have become much more quantifiable. By combining optical, thermal and acoustic evaluation techniques with conventional tensile tests, the kinetics of strain build-up even within a band have become directly observable. It has been shown that the kinetics during the stress drop and the stress increase are dissimilar [20]. Drops in the stress–strain curve are directly correlated with band nucleation and subsequent build-up of strain inside the band. During the increase in stress, the band remains unchanged, and cyclic strain accumulation occurs outside the bands shortly before the generation of new bands [82]. Some recent DIC studies suggest that the PLC effect does not form nuclei for the localized shear bands, which nucleate on a conjugate plane crossing the plane of the PLC bands [141]. Another work supports this finding and discusses a possible synergetic interaction between the PLC bands and shear bands [142].
Transmission electron microscopy (TEM) is a particularly powerful technique which enables the direct observation of dislocations. In situ deformation techniques based on TEM can be used to clarify plastic deformation, the dynamics and generation of dislocations, and the interactions of dislocations with obstacles and grain boundaries [143]. From such studies, criteria for slip transfer through grain boundaries can easily be determined [144].
The analysis of the time and space series of bands and efforts to develop of experimental techniques to accurately resolve band dynamics are valuable additions to the classical method (the analysis of the stress–strain curves only) [103, 145, 146]. The examination of acquired stress–space–time series by different methods has been used to reveal a significant amount of quantitative information about the dynamic nature of the band types, that is not contained in the stress–strain curves alone [147]. For instance, the possibility of chaos in stress drops, initially predicted by Ananthakrishna, has been demonstrated clearly since type B bands at a medium strain rate are associated with a bell-shaped distribution of the stress drops, while type A bands have a power-law distribution [101, 148]. The crossover regime between these two phases is a subject of intense research at present [149]. It is widely agreed that the theoretical models used to interpret the PLC effect became much more consistent once experimental examination of its spatio-temporal features became possible [34].
Several models can display almost all the features of PLC bands and closely match experimental results for particular alloys. For instance, Hahner and Rizzi have precisely simulated the band speed, band width and plastic strain of a type A band from experimental space-time fields of plastic activity [55, 134]. A DSA-based model proposed by Jiang et al [38] successfully describes all three types of bands obtained through changing the constant strain rate applied. Most recently, Ananthakrishna [72] has included the transitional dynamics of bands to his model in addition to all three types of PLC bands. He has also covered the most recent observation called the crossover phenomenon [31], where the stress drop is in a low-dimensional chaotic state at low and medium strain rates and a high-dimensional power-law state at high strain rates [74]. The latest studies can simulate all the important features of PLC bands, reflecting the progress in the modeling of the PLC effect.
Final remarks
Although some of the present models reproduce all observed band features, quantification of the microscopic formation mechanisms of the bands and the band motion and transition still remains challenging.
The tests used for the examination of PLC bands, such as DIC, DSPI, AE and thermographic techniques are expected to increase in resolution, as their digital components such as computers, cameras and sensors are being continuously improved. These techniques will continue to produce more accurate measurements of banding time, band location, strain and dislocation density, leading to a better understanding of the microscopic nature of the PLC effect.
To clarify the individual contributions of dislocation density, type of obstacle, grain size, grain boundaries, specimen orientation, and so forth, more experiments which use several of the available methods for the same alloy system may be needed. This would test the repeatability and reproducibility of observations, as well as their dependence on the investigation method used.
Studies involving the comparison of shear bands with PLC bands are fairly new. More experimental work is needed to refine the differences between PLC bands and shear bands and their interactions with each other. Also, comparative experimental work on the PLC bands and Lüders band of one particular alloy would be very informative.
Future investigations of the PLC effect should include more correlative experiments aimed at the early detection of the degradation and failure of structural materials. While many slow-strain-rate tests have been carried out [150–152], few reports discuss the fluctuation of electrochemical parameters at the metal–electrolyte interface during the PLC effect. Electromagnetic and electrochemical in situ correlation techniques can potentially be used to detect the embrittlement factor due to the PLC effect, in addition to band characterization, for susceptible load-bearing materials used in ambient and aqueous environments.
Acknowledgments
References
- Brindley B J. and Worthington P J. Metall. Rev. 1970;15:101. [Google Scholar]
- Robinson J M. Int. Mater. Rev. 1994;39:113. [Google Scholar]
- Frenkel J. Phys. Rev. 1938;54:647. doi: 10.1103/PhysRev.54.647. [DOI] [Google Scholar]
- Schottky W. Phys. Rev. 1926;28:74. doi: 10.1103/PhysRev.28.74. [DOI] [Google Scholar]
- Burgers J M. Ned. Akad. Wet. 1939;42:293. [Google Scholar]
- Cottrell A H. Oxford Oxford University Press; 1953. Dislocations and Plastic Flow in Crystals. [Google Scholar]
- Keh A S, Nakada Y. and Leslie W C. Dislocation Dynamics. In: Rosenfield A R, , Hahn G T, , Bement A L Jr, , Jaffee R I, , editors. New York McGraw Hill; 1968. p. p 381. [Google Scholar]
- Penning P. Acta. Metall. 1972;20:1169. doi: 10.1016/0001-6160(72)90165-4. [DOI] [Google Scholar]
- Nabarro F R N. Oxford Clarendon; 1967. Theory of Crystal Dislocations. [Google Scholar]
- Petukhov B V. Crystall. Rep. 2003;48:813. doi: 10.1134/1.1612600. [DOI] [Google Scholar]
- Hu S Y, Li Y L, Zheng Y X. and Chen L Q. Int. J. Plast. 2004;20:403. doi: 10.1016/S0749-6419(03)00094-9. [DOI] [Google Scholar]
- Bacon D J, Osetsky Y N. and Rodney D. New York Elsevier; 2009. Dislocations in Solids; p. p 88. [Google Scholar]
- Shewmon P G. New York McGraw-Hill; 1963. Diffusion in Solids. [Google Scholar]
- Gremaud G. Mater. Sci. Eng. 2004;370(A):191. doi: 10.1016/j.msea.2003.04.005. [DOI] [Google Scholar]
- Doyama M, Kogure Y. and Nozaki T. Nucl. Instrum. Methods Phys. Res. 2007;255(B):85. doi: 10.1016/j.nimb.2006.11.012. [DOI] [Google Scholar]
- Estrin Y. and Kubin L P. Continuum Models for Materials with Microstructures. In: Muhlhaus H B, editor. New York Wiley; 1995. p. p 395. [Google Scholar]
- Friedel J. Oxford Pergamon; 1964. Dislocations. [Google Scholar]
- Hull D. New York Pergamon; 1976. Introduction to Dislocations. [Google Scholar]
- Sakamoto M. Mater. Trans. JIM. 1989;30:337. [Google Scholar]
- Pink E. Scr. Met. Mater. 1994;30:767. doi: 10.1016/0956-716X(94)90196-1. [DOI] [Google Scholar]
- Le Chatelier F. Rev. Metal. 1909;6:914. [Google Scholar]
- Portevin A. and Le Chatelier F. C.R. Acad. Sci. 1923;176:507. [Google Scholar]
- McCormick P G. Trans. Indian Inst. Met. 1986;39:98. [Google Scholar]
- Casarotto L, Dierke H, Tutsch R. and Neuhäuser H. Mater. Sci. Eng. 2009;527(A):132. doi: 10.1016/j.msea.2009.07.043. [DOI] [Google Scholar]
- Ziegenbein A, Hahner P. and Neuhauser H. Comput. Mater. Sci. 2000;19:28. doi: 10.1016/S0927-0256(00)00136-1. [DOI] [Google Scholar]
- Balık J, Lukac P. and Kubin L P. Scr. Mater. 2000;42:465. doi: 10.1016/S1359-6462(99)00373-5. [DOI] [Google Scholar]
- Schwink C H. and Nortmann A. Mater. Sci. Eng. 1997;234(A):l. [Google Scholar]
- Chihab K, Estrin Y, Kubin L P. and Vergnol J. Scr. Metall. 1987;21:203. doi: 10.1016/0036-9748(87)90435-2. [DOI] [Google Scholar]
- Hahner P. Mater. Sci. Eng. 1996;207(A):216. doi: 10.1016/0921-5093(95)10032-6. [DOI] [Google Scholar]
- Casarotto L, Tutsch R, Ritter R, Dierke H, Klose F. and Neuhauser H. Comput. Mater. Sci. 2005;32:316. doi: 10.1016/j.commatsci.2004.09.037. [DOI] [Google Scholar]
- Ait-Amokhtar H. and Fressengeas C. Acta Mater. 2010;58:1342. doi: 10.1016/j.actamat.2009.10.038. [DOI] [Google Scholar]
- Ziegenbein A, Hahner P. and Neuhauser H. Mater. Sci. Eng. 2001;309(A):336. doi: 10.1016/S0921-5093(00)01709-3. [DOI] [Google Scholar]
- Chmelik F, Klose F B, Dierke H, Sachl J, Neuhauser H. and Lukac P. Mater. Sci. Eng. 2007;462(A):53. doi: 10.1016/j.msea.2006.01.169. [DOI] [Google Scholar]
- Ananthakrishna G. Dislocations in Solids. In: Nabarro F R N, , Hirth J P, , editors. New York Elsevier; 2007. p. p 81. [Google Scholar]
- Neuhauser H, Klose F B, Hagemann F, Weidenmüller J, Dierke H. and Hahner P. J. Alloys Compounds. 2004;378:13. doi: 10.1016/j.jallcom.2003.10.064. [DOI] [Google Scholar]
- Cuddy L J. and Leslie W C. Acta Metall. 1972;20:1157. doi: 10.1016/0001-6160(72)90164-2. [DOI] [Google Scholar]
- Jiang Z, Zhang Q, Jiang H, Chen Z. and Wu X. Mater. Sci. Eng. 2005;403(A):154. doi: 10.1016/j.msea.2005.05.059. [DOI] [Google Scholar]
- Jiang H, Zhang Q, Chen X, Chen Z, Jiang Z, Wu X. and Fan J. Acta Mater. 2007;55:2219. doi: 10.1016/j.actamat.2006.10.029. [DOI] [Google Scholar]
- Onodera R. and He Z G. J. Jpn. Inst. Met. 2002;66:1048. [Google Scholar]
- Ranc N. and Wagner D. Mater. Sci. Eng. 2008;474(A):188. doi: 10.1016/j.msea.2007.04.012. [DOI] [Google Scholar]
- Chatterjee A, Sarkar A, Barat P, Mukherjee P. and Gayathri N. Mater. Sci. Eng. 2009;508(A):156. doi: 10.1016/j.msea.2008.12.030. [DOI] [Google Scholar]
- Kok S, Bharathi M S, Beaudoin A J, Fressengeas C, Ananthakrishna G, Kubin L P. and Lebyodkin M. Acta Mater. 2003;51:3651. doi: 10.1016/S1359-6454(03)00114-9. [DOI] [Google Scholar]
- Shabadi R, Kumar S, Roven H J. and Dwarakadasa E S. Mater. Sci. Eng. 2004;382(A):203. doi: 10.1016/j.msea.2004.04.079. [DOI] [Google Scholar]
- Cottrell A H. and Bilby B A. Proc. Phys. Soc. 1949;62(A):49. doi: 10.1088/0370-1298/62/1/308. [DOI] [Google Scholar]
- Estrin Y. and Kubin L P. Acta Metall. 1990;38:697. doi: 10.1016/0956-7151(90)90021-8. [DOI] [Google Scholar]
- Kral R. and Lukac P. Mater. Sci. Eng. 1997;237(A):786. [Google Scholar]
- Horvath G, Chinh N G, Gubicza J. and Lendvai J. Mater. Sci. Eng. 2007;446:186. doi: 10.1016/j.msea.2006.09.019. [DOI] [Google Scholar]
- Hahner P, Ziegenbein A, Rizzi E. and Neuhauser H. Phys. Rev. 2002;65(B):134109. doi: 10.1103/PhysRevB.65.134109. [DOI] [Google Scholar]
- Lebyodkin M A. and Dunin-Barkovskii L R. Phys. Solid State. 1998;40:447. doi: 10.1134/1.1130341. [DOI] [Google Scholar]
- Schlipf J. Scr. Metall. Mater. 1994;31:909. doi: 10.1016/0956-716X(94)90501-0. [DOI] [Google Scholar]
- Springer F, Nortmann A. and Schwink Ch. Phys. Status Solidi. 1998;170(a):63. doi: 10.1002/(ISSN)1521-396X. [DOI] [Google Scholar]
- Picu R C. and Zhang D. Acta Mater. 2004;52:171. [Google Scholar]
- Curtin W A. J. Mech. Phys. Solids. 2006;54:1763. doi: 10.1016/j.jmps.2005.12.008. [DOI] [Google Scholar]
- Olmsted D S, Hector L G, Jr, Curtin W A. and Clifton R J. Nat. Mater. 2006;5:875. doi: 10.1038/nmat1765. [DOI] [PubMed] [Google Scholar]
- Hahner P. and Rizzi E. Acta Mater. 2003;51:3385. doi: 10.1016/S1359-6454(03)00122-8. [DOI] [Google Scholar]
- Korbel A, Zasadzinski J. and Sieklucka Z. Acta Metall. 1976;24:919. doi: 10.1016/0001-6160(76)90040-7. [DOI] [Google Scholar]
- Mulford R A. and Kocks U F. Acta Metall. 1979;27:1125. doi: 10.1016/0001-6160(79)90130-5. [DOI] [Google Scholar]
- Schwarz R B. and Funk L L. Acta Metall. 1985;33:295. doi: 10.1016/0001-6160(85)90148-8. [DOI] [Google Scholar]
- Weiss J, Grasso J R, Miguel M C, Vespignani A. and Zapperi S. Mater. Sci. Eng. 2001;309(A):360. doi: 10.1016/S0921-5093(00)01633-6. [DOI] [Google Scholar]
- Chen J Z, Zhen L, Fan L W, Yang S J, Dai S L. and Shao W Z. Trans. Nonferrous Met. Soc. China. 2009;19:1071. doi: 10.1016/S1003-6326(08)60408-2. [DOI] [Google Scholar]
- Barisic B, Pepelnjak T. and Math M D. J. Mater. Process. Technol. 2008;203:154. doi: 10.1016/j.jmatprotec.2007.09.054. [DOI] [Google Scholar]
- Chen L, Kim H S, Kim S K. and De Cooman B C. ISIJ Int. 2007;47:1804. doi: 10.2355/isijinternational.47.1804. [DOI] [Google Scholar]
- Owen W S. and Grujicic M. Acta Mater. 1998;47:111. doi: 10.1016/S1359-6454(98)00347-4. [DOI] [Google Scholar]
- Kim D W, Ryu W S, Hong J H. and Choi S K. J. Mater. Sci. 1998;33:675. doi: 10.1023/A:1004381510474. [DOI] [Google Scholar]
- McCormick P G. Acta Metall. 1973;21:873. doi: 10.1016/0001-6160(73)90144-2. [DOI] [Google Scholar]
- Sarkar A, Chatterjee A, Barat P. and Mukherjee P. Mater. Sci. Eng. 2007;459(A):361. doi: 10.1016/j.msea.2007.01.006. [DOI] [Google Scholar]
- Beukel A V. Acta Metall. 1980;28:965. doi: 10.1016/0001-6160(80)90114-5. [DOI] [Google Scholar]
- Almeida L H, May I L. and Emygdio P R O. Mater. Charact. 1998;41:137. doi: 10.1016/S1044-5803(98)00031-X. [DOI] [Google Scholar]
- McCormick P G. Acta Metall. 1988;36:3061. doi: 10.1016/0001-6160(88)90043-0. [DOI] [Google Scholar]
- Mesarovic S D J. J. Mech. Phys. Solids. 1995;43:671. doi: 10.1016/0022-5096(95)00010-G. [DOI] [Google Scholar]
- Lasko G, Hahner P. and Schmauder S. Model. Simul. Mater. Sci. Eng. 2005;13:645. doi: 10.1088/0965-0393/13/5/001. [DOI] [Google Scholar]
- Ananthakrishna G. Phys. Rep. 2007;440:113. doi: 10.1016/j.physrep.2006.10.003. [DOI] [Google Scholar]
- Ananthakrishna G, Noronha S J, Fressengeas C. and Kubin L P. Mater. Sci. Eng. 2001;309(A):316. doi: 10.1016/S0921-5093(00)01678-6. [DOI] [Google Scholar]
- Ananthakrishna G. Pramana-J. Phys. 2005;64:343. doi: 10.1007/BF02704562. [DOI] [Google Scholar]
- Pink E. and Grinberg A. Acta Metall. 1982;30:2153. doi: 10.1016/0001-6160(82)90136-5. [DOI] [Google Scholar]
- Pink E. and Grinberg A. Mater. Sci. Eng. 1981;51:1. doi: 10.1016/0025-5416(81)90099-9. [DOI] [Google Scholar]
- Tong W, Zhang N. and Hector L G. Scr. Mater. 2005;53:87. doi: 10.1016/j.scriptamat.2005.03.020. [DOI] [Google Scholar]
- Yang S Y. and Tong W. Int. J. Solids Struct. 2006;43:5931. doi: 10.1016/j.ijsolstr.2005.07.041. [DOI] [Google Scholar]
- Bruck S A, McNeill S R, Sutton M A. and Peters W H. Exp. Mech. 1989;39:261. doi: 10.1007/BF02321405. [DOI] [Google Scholar]
- Zavattieri P D, Savic V, Hector L G, Fekete J R, Tong W. and Xuan Y. Int. J. Plast. 2009;25:2298. doi: 10.1016/j.ijplas.2009.02.008. [DOI] [Google Scholar]
- Benallal A, Berstad T, Borvik T, Hopperstad O. and Codes R N. IUTAM Symposium on Theoretical Modelling and Computational Aspects of Inelastic Media. In: Reddy B D, editor. Berlin Springer Science + Business Media, B. V.; 2005. p. p 329. [Google Scholar]
- Zdunek J, Brynk T, Mizera J, Pakiela Z. and Kurzydlowski K J. Mater. Charact. 2008;59:1429. doi: 10.1016/j.matchar.2008.01.004. [DOI] [Google Scholar]
- Zhang Q, Jiang Z, Jiang H, Chen Z. and Wu X. Int. J. Plast. 2005;21:2150. doi: 10.1016/j.ijplas.2005.03.017. [DOI] [Google Scholar]
- Jiang H. Scr. Mater. 2006;54:2041. doi: 10.1016/j.scriptamat.2006.03.027. [DOI] [Google Scholar]
- Arevalo S, Fernandez T G, Pulos G. and Muniza M V. Mater. Charact. 2009;60:775. doi: 10.1016/j.matchar.2009.01.006. [DOI] [Google Scholar]
- Xiang G F, Zhang Q C, Liu H W, Wua X P. and Jub X Y. Scr. Mater. 2007;56:721. doi: 10.1016/j.scriptamat.2006.08.049. [DOI] [Google Scholar]
- Hahner P, Ziegenbein A, Rizzi E. and Neuhauser H. Phys. Rev. 2002;65(B):134106. doi: 10.1103/PhysRevB.65.134109. [DOI] [Google Scholar]
- Klose F B, Ziegenbein A, Weidenmuller J, Neuhauser H. and Hahner P. Comput. Mater. Sci. 2003;26:80. doi: 10.1016/S0927-0256(02)00405-6. [DOI] [Google Scholar]
- Louche H, Vacher P. and Arrieux R. Mater. Sci. Eng. 2005;404(A):188. doi: 10.1016/j.msea.2005.05.058. [DOI] [Google Scholar]
- Feng X, Crostack H A, Fischer G. and Svendsen B. Proc. Appl. Math. Mech. 2006;6:435. doi: 10.1002/(ISSN)1617-7061. [DOI] [Google Scholar]
- Ait-Amokhtar H, Fressengeas C. and Boudrahem S. Mater. Sci. Eng. 2008;488(A):540. doi: 10.1016/j.msea.2007.11.075. [DOI] [Google Scholar]
- Ranc N. and Wagner D. Mater. Sci. Eng. 2005;394(A):87. doi: 10.1016/j.msea.2004.11.042. [DOI] [Google Scholar]
- Louche H. and Chrysochoos A. Mater. Sci. Eng. 2001;307(A):15. doi: 10.1016/S0921-5093(00)01975-4. [DOI] [Google Scholar]
- Heiple C R. and Carpenter S H. J. Acoust. Emiss. 1987;6:177. [Google Scholar]
- Malen K. and Bolin L. Phys. Status Solidi. 1974;61:637. doi: 10.1002/(ISSN)1521-3951. [DOI] [Google Scholar]
- Chmelik F, Ziegenbein A, Neuhauser H. and Lukac P. Mater. Sci. Eng. 2002;324(A):200. doi: 10.1016/S0921-5093(01)01312-0. [DOI] [Google Scholar]
- Caceres C H. and Bertorello H R. Scr. Met. 1983;17:1115. doi: 10.1016/0036-9748(83)90465-9. [DOI] [Google Scholar]
- Caceres C H. and Rodriguez A H. Acta Metall. 1987;35:2851. doi: 10.1016/0001-6160(87)90284-7. [DOI] [Google Scholar]
- Pawelek A, Stryjewski W. and Bochniak W. Z. Metallk. 1989;80:614. [Google Scholar]
- Chmelik F, Trojanova Z, Prevorovsky Z. and Lukac P. Mater. Sci. Eng. 1993;164(A):260. doi: 10.1016/0921-5093(93)90674-4. [DOI] [Google Scholar]
- Miguel M C, Vespignani A, Zapperi S, Weiss J. and Grasso J R. Nature. 2001;410:667. doi: 10.1038/35070524. [DOI] [PubMed] [Google Scholar]
- Emily E F. Oxford Pergamon; 1966. Principles of Magnetic Technologies; p. p 550. [Google Scholar]
- Dhar A, Clapham L. and Atherton D L. J. Mater. Sci. 2002;37:2441. doi: 10.1023/A:1015419018741. [DOI] [Google Scholar]
- Sanchez J C, Campos M A. and Padovese L R. NDT&E Int. 2007;40:520. doi: 10.1016/j.ndteint.2007.02.005. [DOI] [Google Scholar]
- Schmitter E D. Phys. Lett. 2007;368(A):320. doi: 10.1016/j.physleta.2007.04.029. [DOI] [Google Scholar]
- Landauer R. Phys. Rev. 1951;82:520. doi: 10.1103/PhysRev.82.520. [DOI] [Google Scholar]
- Ananthakrishna G. and Ramachandran H. Heidelberg Springer; 2006. Non-Linearity and Breakdown in Soft Condensed Matter. [Google Scholar]
- Hahner P. and Drossinos Y. Phys. Rev. 1999;59(E):6231. doi: 10.1103/PhysRevE.59.R6231. [DOI] [PubMed] [Google Scholar]
- Darowicki K. and Orlikowski J. Electrochim. Acta. 2007;52:4043. doi: 10.1016/j.electacta.2006.11.022. [DOI] [Google Scholar]
- Landauer R. Phys. Rev. 1954;94:1386. doi: 10.1103/PhysRev.94.1386.2. [DOI] [Google Scholar]
- Baxter W J. J. Appl. Phys. 1974;45:4692. doi: 10.1063/1.1663120. [DOI] [Google Scholar]
- Yilmaz A. J. Mater. Sci. 2011;46:3766. doi: 10.1007/s10853-011-5290-5. [DOI] [Google Scholar]
- Koehler J S. Phys. Rev. 1949;75:106. doi: 10.1103/PhysRev.75.106. [DOI] [Google Scholar]
- Estrin Y. and Lebyodkin M A. Mater. Sci. Eng. 2004;387(A):195. doi: 10.1016/j.msea.2004.01.079. [DOI] [Google Scholar]
- Brechet Y. and Estrin Y. Acta Metall. Mater. 1995;43:935. [Google Scholar]
- Pink E. and Krol J. Acta Metall. Mater. 1995;43:2351. doi: 10.1016/0956-7151(94)00431-5. [DOI] [Google Scholar]
- Dierke H, Krawehl F, Graff S, Forest S, Sachl J. and Neuhauser H. Comput. Mater. Sci. 2007;39:106. doi: 10.1016/j.commatsci.2006.03.019. [DOI] [Google Scholar]
- Dablij M. and Zeghloul A. Mater. Sci. Eng. 1997;237(A):1. doi: 10.1016/S0921-5093(97)00101-9. [DOI] [Google Scholar]
- Thevenet D, Mliha-Touati M. and Zeghloul A. Mater. Sci. Eng. 1999;266(A):175. doi: 10.1016/S0921-5093(99)00029-5. [DOI] [Google Scholar]
- Liang S, Qingchuan Z. and Huifeng J. Front. Mater. Sci. China. 2007;1:173. doi: 10.1007/s11706-007-0031-z. [DOI] [Google Scholar]
- Wang C, Li Z, Xu Y. and Han E. J. Mater. Sci. 2007;42:3573. doi: 10.1007/s10853-006-0167-8. [DOI] [Google Scholar]
- Zdunek J, Spychalski W L, Mizera J. and Kurzydlowski K J. Mater. Charact. 2007;58:46. doi: 10.1016/j.matchar.2006.03.009. [DOI] [Google Scholar]
- McCormick P G, Venkadesan S. and Ling C P. Scr. Metall. Mater. 1993;29:1159. doi: 10.1016/0956-716X(93)90102-X. [DOI] [Google Scholar]
- Abbadi M, Hahner P. and Zeghloul A. Mater. Sci. Eng. 2002;337(A):194. doi: 10.1016/S0921-5093(02)00036-9. [DOI] [Google Scholar]
- Kang J, Wilkinson D S, Embury J D, Jain M. and Beaudoin A J. Scr. Mater. 2005;53:499. doi: 10.1016/j.scriptamat.2005.05.010. [DOI] [Google Scholar]
- Kumar S, Krol J. and Pink E. Scr. Mater. 1996;35:775. doi: 10.1016/1359-6462(96)00218-7. [DOI] [Google Scholar]
- Klose F B, Hagemann F, Hahner P. and Neuhauser H. Mater. Sci. Eng. 2004;387(A):93. doi: 10.1016/j.msea.2004.01.062. [DOI] [Google Scholar]
- Chen M C, Chen L H. and Lui T S. Acta Metall. Mater. 1992;40:2433. doi: 10.1016/0956-7151(92)90161-7. [DOI] [Google Scholar]
- Balık J. and Lukac P. Acta Metall. Mater. 1993;41:1447. doi: 10.1016/0956-7151(93)90253-O. [DOI] [Google Scholar]
- Chihab K. and Fressengeas C. Mater. Sci. Eng. 2003;356(A):102. doi: 10.1016/S0921-5093(03)00141-2. [DOI] [Google Scholar]
- Kovacs Z S, Chinh N Q. and Lendvai J. J. Mater. Res. 2001;16:1171. doi: 10.1557/JMR.2001.0161. [DOI] [Google Scholar]
- Shen Y Z, Oh K H. and Lee D N. Scr. Mater. 2004;51:285. doi: 10.1016/j.scriptamat.2004.04.030. [DOI] [Google Scholar]
- Wagenhofer M, Erickson-Natishan M A, Armstrong R W. and Zerilli F J. Scr. Mater. 1999;41:1177. doi: 10.1016/S1359-6462(99)00265-1. [DOI] [Google Scholar]
- Rizzi E. and Hahner P. Int. J. Plast. 2004;20:121. doi: 10.1016/S0749-6419(03)00035-4. [DOI] [Google Scholar]
- McCormick P G. Acta Metall. 1972;20:351. doi: 10.1016/0001-6160(72)90028-4. [DOI] [Google Scholar]
- Samuel K G, Mannan S L. and Rodriguez P. Acta Metall. 1988;36:2323. doi: 10.1016/0001-6160(88)90331-8. [DOI] [Google Scholar]
- Saha G G, McCormick P G. and Rama Rao P. Mater. Sci. Eng. 1984;62:187. doi: 10.1016/0025-5416(84)90221-0. [DOI] [Google Scholar]
- McCormick P G. Acta Metall. 1971;19:463. doi: 10.1016/0001-6160(71)90170-2. [DOI] [Google Scholar]
- Fressengeas C, Beaudoin A J, Lebyodkin M, Kubin L P. and Estrin Y. Mater. Sci. Eng. 2005;400(A):226. doi: 10.1016/j.msea.2005.02.073. [DOI] [Google Scholar]
- Lebyodkin M A, Dunin-Barkovskii L, Brechet Y, Estrin Y. and Kubin L E. Acta Mater. 2000;48:2529. doi: 10.1016/S1359-6454(00)00067-7. [DOI] [Google Scholar]
- Halim H, Wilkinson D S. and Niewczas M. Acta Mater. 2007;55:4151. doi: 10.1016/j.actamat.2007.03.007. [DOI] [Google Scholar]
- Wilkinson D S, Bruhis M, Jain M, Wu P D, Embury J D, Mishra R K. and Sachdev A K. J. Mater. Eng. Perform. 2008;17:401. [Google Scholar]
- Tabata T, Fujita H. and Nakajima Y. Acta Metall. 1980;28:795. doi: 10.1016/0001-6160(80)90156-X. [DOI] [Google Scholar]
- Lagowa B W, Robertson I M, Jouiad M, Lassila D H, Lee T C. and Birnbaum H K. Mater. Sci. Eng. 2001;309(A):445. doi: 10.1016/S0921-5093(00)01699-3. [DOI] [Google Scholar]
- Abarbanel H D I. New York Springer; 1996. Analysis of the Observed Data; p. p 55. [Google Scholar]
- Schreiber T. and Kantz H. Cambridge Cambridge University Press; 1997. Nonlinear Time Series Analysis; p. p 76. [Google Scholar]
- Kubin L E, Fressengeas C. and Ananthakrishna G. Dislocations in Solids. In: Nabarro F R N, , Duesbury M S, , editors. Amsterdam North-Holland; 2002. p. p 101. [Google Scholar]
- Sarkar A, Webber C L, Jr, Barat P. and Mukherjee P. Phys. Lett. 2008;372(A):1101. doi: 10.1016/j.physleta.2007.08.055. [DOI] [Google Scholar]
- Bharathi M S, Lebyodkin M, Ananthakrishna G, Fressengeas C. and Kubin L P. Acta Mater. 2002;50:2813. doi: 10.1016/S1359-6454(02)00099-X. [DOI] [Google Scholar]
- Yilmaz A, Chandra D. and Rebak R B. Met. Mater. Trans. 2005;36(A):1097. doi: 10.1007/s11661-005-0203-3. [DOI] [Google Scholar]
- Evans K J, Yilmaz A, Day S D, Wong L L, Estill J C. and Rebak R B. J. Miner. Met. Mater. Soc. 2005;57:56. doi: 10.1007/s11837-005-0065-6. [DOI] [Google Scholar]
- Szklarska-Smialowska Z, Xia Z. and Rebak R B. Corr. Sci. 1994;50:334. [Google Scholar]
- Hooper W H L. J. Inst. Met. 1952;81:563. [Google Scholar]
- Serajzadeh S. and Sheikh H. Mater. Sci. Eng. 2008;486(A):138. doi: 10.1016/j.msea.2007.09.021. [DOI] [Google Scholar]
- Legros M, Dehm G, Arzt E. and Balk T J. Science. 2008;319:1646. doi: 10.1126/science.1151771. [DOI] [PubMed] [Google Scholar]
- Picu R C. Acta Mater. 2004;52:3447. doi: 10.1016/j.actamat.2004.03.042. [DOI] [Google Scholar]


