Abstract
Aim: The Japan Atherosclerosis Society (JAS) guidelines for the diagnosis and treatment of hyperlipidemia in Japanese adults recommend using low-density lipoprotein cholesterol (LDL-C) calculated by Friedewald formula (F_LDL-C) for subjects with triglyceride (TG) levels <400 mg/dL and non-high-density lipoprotein cholesterol (non-HDL-C) levels for subjects with TG levels ≥400 mg/dL. Because small-dense LDL particles are more atherogenic than large LDL particles, we sought the better lipid parameter which was more reflective of the high small-dense LDL-C (sdLDL-C) levels in subjects with TG levels <400 mg/dL.
Methods: This study included 769 Japanese subjects who met our inclusion criteria and underwent an annual health examination, including sdLDL-C analyses.
Results: The correlation coefficient of non-HDL-C for sdLDL-C (r = 0.760) was significantly higher than that of F_LDL-C (r = 0.601). The area under the curve (95% confidence interval) was 0.771 (0.731, 0.811) for F_LDL-C and 0.871 (0.842, 0.901) for non HDL-C, which showed significantly higher predictive value for more than fourth quartile value of sdLDL-C (46 mg/dL). The optimal cut-off point of non-HDL-C was 158 mg/dL. Even in subjects stratified by waist circumstance, homeostasis model assessment of insulin resistance, TG, and F_LDL-C levels and non-HDL-C showed stronger relationships with sdLDL-C than F_LDL-C. Moreover, non-HDL-C showed a better relationship with sdLDL-C than total cholesterol (TC), TC/HDL-C, and non-HDL-C/HDL-C.
Conclusion: Our data suggested that non-HDL-C is superior to F_LDL-C and one of the reliable surrogate lipid markers of sdLDL-C in Japanese subjects with TG levels <400 mg/dL.
Keywords: Small-dense LDL, Non-HDL cholesterol, LDL cholesterol calculated by Friedewald formula, Annual health examination
Introduction
The correlation between hypercholesterolemia and the risk of coronary heart disease (CHD) indicates that reduced levels of serum total cholesterol (TC) and low-density lipoprotein cholesterol (LDL-C) results in a reduced risk of CHD1–5). LDL-C comprises multiple distinct subclasses that differ in size, density, physicochemical composition, metabolic behavior, and atherogenicity6). Clinical atherosclerotic events are reported to be uncommon in humans with very low plasma cholesterol levels throughout their lives7). Despite these facts, LDL-C levels are not always elevated in patients with CHD8). Earlier evidence strongly suggests that in addition to lipoprotein levels, the specific natures of these lipoproteins are associated with the development and progression of coronary atherosclerosis9). Clinical studies strongly suggest that a predominance of small-dense LDL-C (sdLDL-C) is associated with a risk of CHD9–12). Therefore, an evaluation of serum lipid levels is a very important step toward reducing the incidence of atherosclerotic events.
The Japan Atherosclerosis Society (JAS) published guidelines for the diagnosis and treatment of hyperlipidemia in Japanese adults in 199713). The JAS later revised these guidelines in 2002, 2007, and 201214–16). In 2007, JAS recommended using LDL-C calculated by Friedewald formula (F_LDL-C) for subjects with triglyceride (TG) levels <400 mg/dL and directly measured LDL-C (D_LDL-C) for subjects with TG levels ≥400 mg/dL to evaluate the cholesterol levels and predict the risk of atherosclerotic disease. A comparison of the 2012 and 2007 JAS guidelines indicates that the F_LDL-C level was recommended for subjects with TG levels <400 mg/dL. In contrast, the non-high-density lipoprotein cholesterol (non-HDL-C) level was promoted for dyslipidemia evaluation in subjects with TG levels ≥400 mg/dL. Direct assays for LDL-C measurement include the traditional ultracentrifugation-based and detergent-based methods. The reported error for one detergent-based assay was 41.6%, suggesting uncertain quality control17). The JAS recommended using F_LDL-C levels in subjects with TG levels <400 mg/dL. However, F_LDL-C values are known to be less accurate not only as TG levels increase but also as LDL-C levels decrease below 100 mg/dL18, 19). The D_LDL-C level was no longer recommended for dyslipidemia evaluation because of quality control concerns.
Accumulating evidence indicates that despite the nature of LDL-C as a strong risk factor for CHD, LDL-C levels are not always elevated in patients with CHD. Hirano et al. reported that patients with CHD had increased sdLDL-C levels, irrespective of the presence of diabetes, despite having LDL-C levels comparable to those of normolipidemic controls20). Furthermore, another report stated that estimated cholesterol levels in the large LDL subfraction were not associated with an increased risk of CHD in men and that the cardiovascular risk attributable to variations in LDL size was largely related to markers indicating a preferential accumulation of sdLDL particles21). Unfortunately, sdLDL-C is not a widely accepted parameter because of the limited availability of the special equipment, techniques, and kits required for its measurement. Therefore, it is very important to use commonly measured lipid parameters, such as LDL-C and non-HDL-C, for evaluations of atherogenicity intended to include sdLDL-C.
This study aimed to identify the better surrogate lipid parameter reflective of high sdLDL-C levels in subjects with TG <400mg/dL.
Methods
Subjects
A total of 994 subjects underwent annual health examinations at the Health Evaluation and Promotion Center at Tokai University Hachioji Hospital between April 2011 and March 2014. These examinations included sdLDL-C analyses. After excluding subjects with TG levels ≥400 mg/dL and subjects who were under treatment for diabetes and dyslipidemia, 769 subjects were ultimately included in this study. Medical history information was obtained through self-administered questionnaires and interviews conducted by nurses. Among the 769 subjects, 142 were using antihypertensive drugs.
Measurements
Waist circumference (WC) was measured at the level of the umbilicus while the subject was standing and during slight expiration. Blood pressure (BP) was measured on the upper right arm using an automatic blood pressure monitor (TM-2655P; A&D, Tokyo, Japan) while the subject was seated. Blood samples were collected early in the morning after fasting overnight. Fasting immunoreactive insulin (FIRI) levels were measured using a fluorescence enzyme immunoassay (ST AIA-PACK IRI; Toso, Tokyo, Japan). The homeostasis model assessment of insulin resistance (HOMA-IR) was calculated as follows: Fasting plasma glucose (FPG; mg/dL) × FIRI (mU/mL)/40522). Levels of HDL-C and TG were measured using visible spectrophotometry (Determiner L HDL-C, and Determiner L TG II, respectively; Kyowa Medex, Tokyo, Japan). The serum LDL-C calculated by Friedewald formula (F_LDL-C) levels were calculated using the Friedewald formula23): LDL-C=TC − HDL-C − [TG/5]. Non-HDL-C levels were calculated by subtracting the HDL-C from the TC. Furthermore, sdLDL-C levels were measured using a homogeneous method (sd LDL-Ex; DENKA SEIKEN Co., Tokyo, Japan). High-molecular-weight adiponectin (HMW-Ad) was measured using chemiluminescent enzyme immunoassay based on a monoclonal antibody to human HMW-Ad (Fujirebio, Tokyo, Japan). Verbal consent for the analytical use of anonymized health records was obtained from the subjects. The study protocol was approved by the institutional ethics committee of the Tokai University School of Medicine.
Statistical Analyses
The significance of pairwise comparisons was determined using the t -test. Relationships between study variables were investigated using Pearson's correlation coefficient. Because the reference range for sdLDL-C was uncertain, the fourth quartile value (46 mg/dL) was determined. A receiver operating characteristic (ROC) curve was prepared to evaluate the discriminatory ability of the variables, and the area under the curve (AUC) with its 95% confidence interval (CI) was calculated. To determine the optimal cut-off point of non-HDL-C, the square root of ([1 − sensitivity]2 + [1 − specificity]2) was calculated, which was the point on the ROC curve with the shortest distance from the upper left corner.
Statistical analyses were performed using SAS software, version 9.3 (SAS Institute Inc., Cary, NC, USA). All P-values were two-tailed, and a P-value <0.05 was considered statistically significant.
Results
Table 1 lists the subjects' characteristics. Men and women did not differ significantly with respect to age, body mass index (BMI), WC, BP, and non-HDL-C levels. However, FPG, HOMA-IR, TG, and sdLDL-C values were significantly higher in men than in women. In contrast, the HDL-C, F_LDL-C, and HMW-Ad values were significantly higher in women than in men.
Table 1. Characteristics of study subjects.
| Men (n = 493) | Women (n = 276) | P | |
|---|---|---|---|
| Age (years) | 57.6 ± 12.4 | 58.8 ± 11.5 | 0.18 |
| BMI (kg/m2) | 23.9 ± 3.0 | 21.8 ± 3.1 | 0.63 |
| Waist circumference (cm) | 84.7 ± 8.3 | 78.8 ± 8.7 | 0.33 |
| Systolic BP (mmHg) | 124.0 ± 16.6 | 118.3 ± 18.2 | 0.08 |
| Diastolic BP (mmHg) | 79.7 ± 12.6 | 72.1 ± 11.7 | 0.16 |
| FPG (mg/dL) | 103.1 ± 12.7 | 98.3 ± 15.3 | <.001 |
| HOMA-IR | 1.65 ± 1.50 | 1.33 ± 1.20 | <.001 |
| TG (mg/dL) | 114.7 ± 56.4 | 90.6 ± 45.6 | <.001 |
| HDL-C (mg/dL) | 59.8 ± 14.6 | 75.8 ± 16.6 | 0.02 |
| F_LDL-C (mg/dL) | 122.8 ± 27.8 | 130.1 ± 32.9 | 0.001 |
| Non HDL-C (mg/dL) | 145.7 ± 31.5 | 148.2 ± 35.3 | 0.31 |
| SdLDL-C (mg/dL) | 39.2 ± 15.8 | 34.1 ± 13.5 | 0.005 |
| HMW-Ad (µg/mL) | 2.92 ± 1.97 | 5.90 ± 3.41 | <.001 |
Variables are given as means ± standard deviations.
BMI, body mass index; BP, blood pressure; FPG, fasting plasma glucose; HOMA-IR, homeostasis model assessment-insulin resistance; TG, triglyceride; HDL-C, high-density lipoprotein cholesterol; F_LDL-C, low-density lipoprotein cholesterol calculated by Friedewald formula; non-HDL-C, non-high-density lipoprotein cholesterol; sdLDL-C, small-dense low-density lipoprotein cholesterol; HMW-Ad, high-molecular-weight adiponectin
Fig. 1 shows scatter plots and regression lines with 95% CIs for comparisons of sdLDL-C with F_LDL-C and non-HDL-C in subjects with TG levels <400 mg/dL. The correlation coefficient of non-HDL-C for sdLDL-C (r = 0.760) was significantly higher than that of F_LDL-C (r = 0.601).
Fig. 1.

Scatter plots and regression lines with 95% CIs for comparisons of sdLDL-C and lipid parameters in subjects with TG levels <400 mg/dL
Pearson's correlation coefficient with 95% CIs is indicated on the graph.
sdLDL-C, small-dense low-density lipoprotein cholesterol; TG, triglyceride; F_LDL-C, low-density lipoprotein cholesterol calculated using the Friedewald formula; non-HDL-C, non-high-density lipoprotein cholesterol; CIs, confidence intervals
Fig. 2 illustrates the ROC curve to evaluate the discriminatory ability for more than fourth quartile value of sdLDL-C (46 mg/dL). The AUC (95% CI) was 0.771 (0.731, 0.811) for F_LDL-C and 0.871 (0.842, 0.901) for non-HDL-C, which showed a significantly higher predictive value for fourth quartile of sdLDL-C. The optimal cut-off point of non-HDL-C yielding the minimum value of the square root of [(1 − sensitivity)2 + (1 − specificity)2] was 158 mg/dL. The optimal cut-off point was also the point that maximized the product of sensitivity and specificity, with sensitivity and specificity of 0.772 and 0.793, respectively. The prevalence was 78.8%, and the positive predictive value was 54.9%.
Fig. 2.
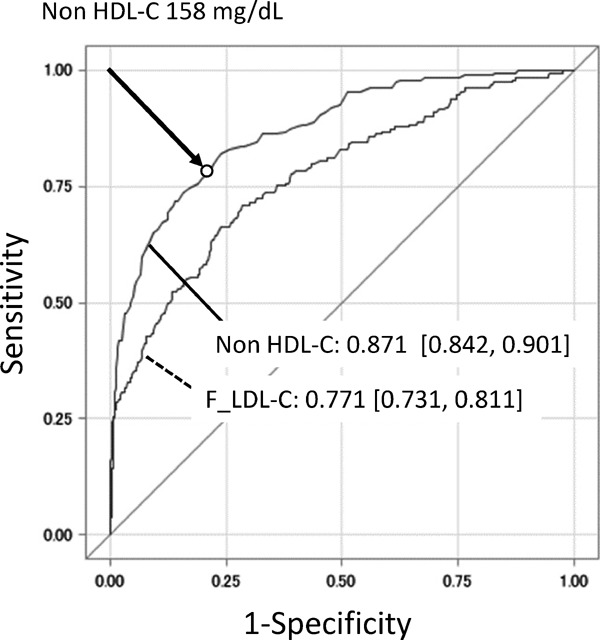
The ROC curves of F_LDL-C and non-HDL-C for predicting high sdLDL-C level (≥46.0 mg/dL)
AUCs with its 95% CI for F_LDL-C and non-HDL-C, and optimal cut-off point of non-HDL-C (circle) are shown in the graph.
ROC, receiver operator characteristic; F_LDL-C, low-density lipoprotein cholesterol calculated using the Friedewald formula; non-HDL-C, non-high-density lipoprotein cholesterol; sdLDL-C, small-dense low-density lipoprotein cholesterol; AUC, area under the curve; CI, confidence interval
Fig. 3 shows scatter plots and regression lines with 95% CIs for comparisons of sdLDL-C with F_LDL-C and non-HDL-C when subjects were stratified by WC levels. The correlation coefficient of F_LDL-C for sdLDL-C decreases as WC increases. On the contrary, the correlation coefficients of non-HDLC for sdLDL-C were higher than those of F_LDL-C in all classes and remain high even in subjects with WC ≥ 90 cm.
Fig. 3.
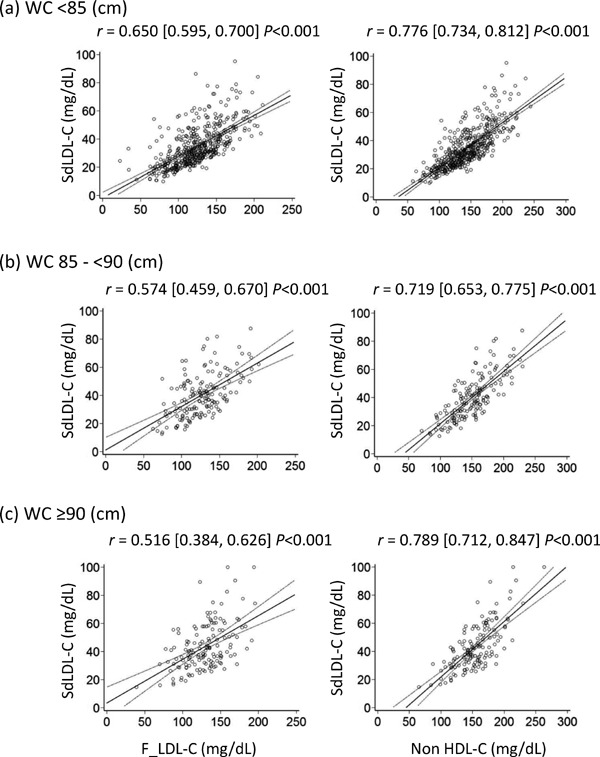
Scatter plots and regression lines with 95% CIs for comparisons of sdLDL-C and lipid parameters when subjects were stratified by WC
Pearson's correlation coefficient with 95% CIs is indicated on the graph.
sdLDL-C, small-dense low-density lipoprotein cholesterol; WC, waist circumference; F_LDL-C, low-density lipoprotein cholesterol calculated using the Friedewald formula; non-HDL-C, non-high-density lipoprotein cholesterol; CIs, confidence intervals
Fig. 4 shows scatter plots and regression lines with 95% CIs for comparisons of sdLDL-C with F_LDL-C and non-HDL-C when subjects were stratified by HOMA-IR. The correlation coefficient of F_LDL-C for sdLDL-C decreases as HOMA-IR increases. On the contrary, the correlation coefficients of non-HDL-C for sdLDL-C were higher than those of F_LDL-C in all classes and remain high even in subjects with HOMA-IR ≥ 2.5.
Fig. 4.
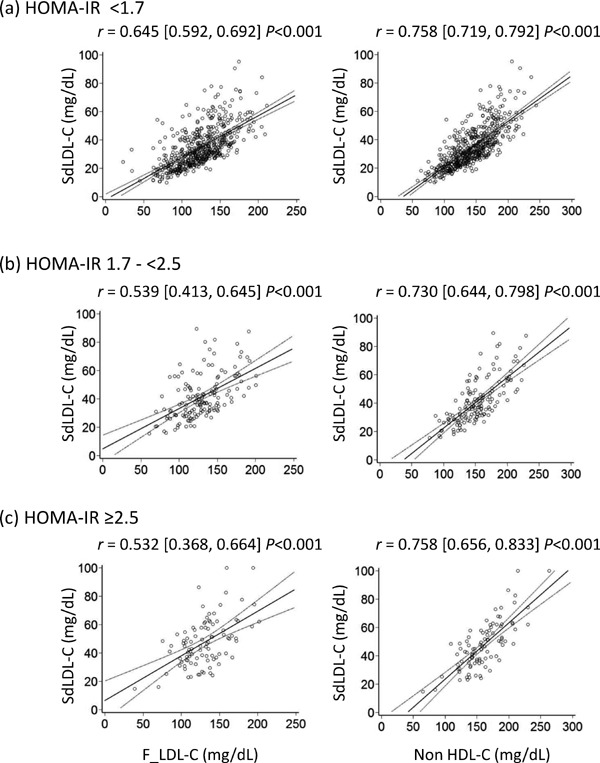
Scatter plots and regression lines with 95% CIs for comparisons of sdLDL-C and lipid parameters when subjects were stratified by HOMA-IR
Pearson's correlation coefficient with 95% CIs is indicated on the graph.
sdLDL-C, small-dense low-density lipoprotein cholesterol; HOMA-IR, homeostasis model assessment of insulin resistance; F_LDL-C, low-density lipoprotein cholesterol calculated using the Friedewald formula; non-HDL-C, non-high-density lipoprotein cholesterol; CIs, confidence intervals
Fig. 5 shows scatter plots and regression lines with 95% CIs for comparisons of sdLDL-C with F_LDL-C and non-HDL-C when subjects were stratified by TG levels. (a) The correlation coefficient of non-HDL-C for sdLDL-C was higher than that of F_LDL-C in normal TG levels (TG <150 mg/dL). (b) The correlation coefficient of non-HDL-C for sdLDL-C was higher than that of F_LDL-C in high TG levels (TG 150–<400 mg/dL).
Fig. 5.
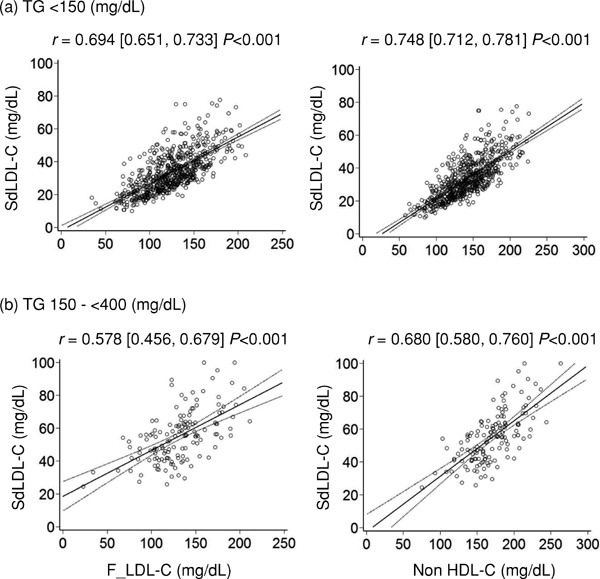
Scatter plots and regression lines with 95% CIs for comparisons of sdLDL-C and lipid parameters when subjects were stratified by TG levels
Pearson's correlation coefficient with 95% CIs is indicated on the graph.
sdLDL-C, small-dense low-density lipoprotein cholesterol; TG, triglyceride; F_LDL-C, low-density lipoprotein cholesterol calculated using the Friedewald formula; non-HDL-C, non-high-density lipoprotein cholesterol; CIs, confidence intervals
Fig. 6 shows scatter plots and regression lines with 95% CIs for comparisons of sdLDL-C with F_LDL-C and non-HDL-C when subjects were stratified by F_LDL-C levels. (a) The correlation coefficient of non-HDL-C for sdLDL-C was higher than that of F_LDL-C in normal F_LDL-C levels (F_LDL-C <140 mg/dL). (ab) The correlation coefficient of non-HDLC for sdLDL-C was higher than that of F_LDL-C in high F_LDL-C levels (F_LDL-C ≥140 mg/dL).
Fig. 6.
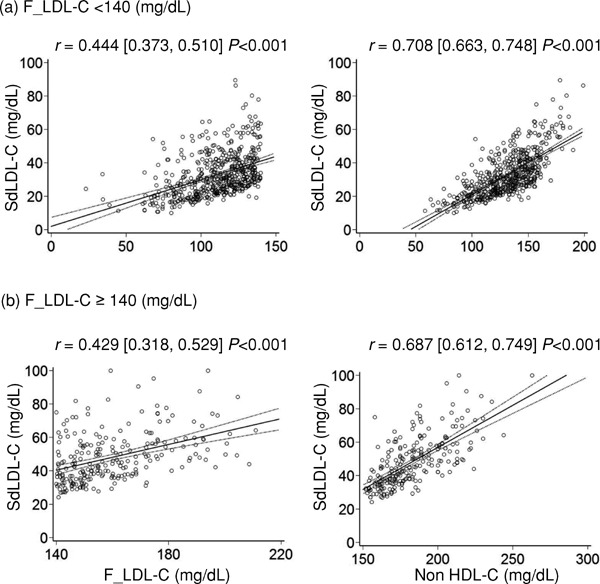
Scatter plots and regression lines with 95% CIs for comparisons of sdLDL-C and lipid parameters when subjects were stratified by F_LDL-C levels
Pearson's correlation coefficient with 95% CIs is indicated on the graph.
sdLDL-C, small-dense low-density lipoprotein cholesterol; F_LDL-C, low-density lipoprotein cholesterol calculated using the Friedewald formula; non-HDL-C, non-high-density lipoprotein cholesterol; CIs, confidence intervals
Fig. 7 shows scatter plots and regression lines with 95% CIs for comparisons of sdLDL-C with TC, TC/HDL-C, and non-HDL-C/HDL-C in subjects with TG levels <400 mg/dL. The ratios of TC, TC/HDL-C, and non-HDL-C/HDL-C were previously proposed lipid markers and were designed to associate higher values with an increased risk of acute myocardial infarction and lower values with a reduced risk24) of myocardial infarction. The TC/HDL-C ratio is identical to the non-HDL-C/HDL-C ratio because they are linier transformations of each other25). The correlation coefficients of TC/HDL-C and non-HDLC/HDL-C were significantly higher than those of TC. However, they were lower than that of non-HDL-C (Fig. 1). In addition, ROC curves to evaluate the discriminatory ability for more than fourth quartile value of sdLDL-C (46 mg/dL) were created (data not shown) and AUCs were calculated. The AUC (95% CI) was 0.868 (0.839, 0.897) for TC/HDL-C and non-HDL-C/HDL-C, which showed a significantly higher predictive value for fourth quartile value of sdLDL-C than that of TC [0.761 (0.721,0.822)], but they were not better than that of non-HDL-C (Fig. 2). Together, although these markers were useful surrogate lipid markers of sdLDL-C in subjects with TG <400 mg/dL, they did not surpass non-HDL-C.
Fig. 7.
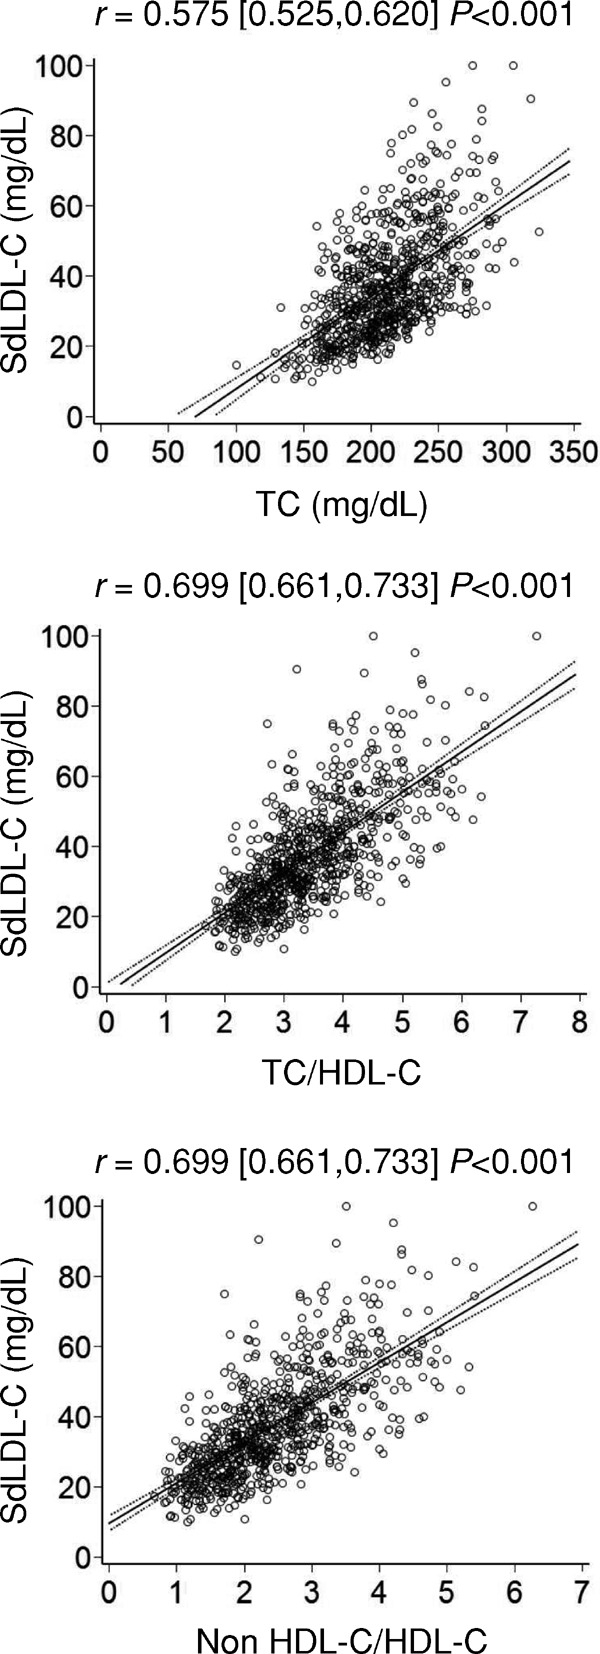
Scatter plots and regression lines with 95% CIs for comparisons of sdLDL-C and lipid parameters in subjects with TG levels <400 mg/dL
Pearson's correlation coefficient with 95% CIs is indicated on the graph.
sdLDL-C, small-dense low-density lipoprotein cholesterol; TC, total cholesterol; HDL-C, high-density lipoprotein cholesterol; non-HDL-C, non-high-density lipoprotein cholesterol; CIs, confidence intervals
Discussion
In this study, we demonstrated that the correlation between sdLDL-C and non-HDL-C was stronger than not only F_LDL-C but also TC, TC/HDL-C, and non-HDL-C/HDL-C. Therefore, we concluded that non-HDL-C was a better surrogate lipid marker of sdLDL-C level than other markers, including F_LDL-C, in Japanese subjects with TG levels <400 mg/dL. Accordingly, we should take advantage of non-HDL-C measurements in subjects with TG levels <400 mg/dL for CHD risk stratification.
Recently, non-HDL-C has emerged as a superior lipid surrogate maker for CHD risk and treatment assessments. More recent study suggested even obese boys with MetS may have a higher risk of development of CHD, since they exhibited elevated non-HDL-C levels26). Non-HDL-C can be directly calculated from values determined through routine lipid panels, and requires no additional measurements or expenses. Therefore, non-HDL-C is readily available for routine clinical use. In addition, non-HDL-C offers the advantage of cluster measurement of all lipoproteins currently believed to contribute to atherosclerosis, such as very low-density lipoprotein, intermediate-density lipoprotein, chylomicron remnants, lipoprotein (a), and LDL, all of which are apolipoprotein B-containing lipoproteins. We are particularly interested in sdLDL-C because it is considered to be more atherogenic than LDL. Several metabolic features, such as small sizes of particles, lower affinity than larger LDL particles for LDL receptors3, 10, 27, 28), and high susceptibility to oxidization24, 29), explain the atherogenic properties of sdLDL particles.
In an 11.7 year prospective study using 2034 Japanese participants (968 men and 1066 women) aged 30-79 without a history of cardiovascular disease (CVD), it was revealed that increasing quartiles of sdLDL-C were associated with increased risk of CVD30). The hazard ratio of fourth quartile in men was 3.53 (95% CI: 1.31-9.86) in a multivariable-adjusted model. The range (mean) sdLDL-C of fourth quartile was 53.5–119.6 (67.3) mg/dL, indicating that subjects with more than 53.5 mg/dL of sdLDL-C were 3.53 times susceptible to CVD. In 481 Japanese-American studies, average sdLDL-C in subjects with impaired glucose tolerance and diabetes mellitus was 43.7 and 47.5 mg/dL, respectively, both of which were significantly higher than that of normal glucose tolerance (33.7 mg/dL)31). Moreover, according to JAS recommendation, the serum lipid management goal of non-HDL-C for subjects in Category III was <150 mg/dL16). In agreement with this recommendation, we showed the optimal cut-off point of non-HDL-C was 158 mg/dL for the fourth quartile of sdLDL-C. Together, the fourth quartile of sdLDL-C (46 mg/dL) in this study was slightly lower than that of the result by Arai et al.30), however, it might be sufficient to include the subjects with high insulin resistance31).
Another advantage of non-HDL-C measurements is they do not require fasting. In practical clinical situations, blood samples are not always collected under fasting conditions. Non-HDL-C can be accurately evaluated from specimens, regardless of collection time, and no special patient preparation is required.
Recent studies on the relationship between non-HDL-C levels and MetS suggested that measurement of non-HDL-C serves as a useful way to identify subjects at high risk of MetS32, 33). Insulin resistance may be a linking factor for the cluster of abnormalities that comprise MetS34). However, the relationship between non-HDL-C versus MetS and insulin resistance is still in debate33, 34). The ability of non-HDL-C thresholds to identify adolescents at increased risk for MetS has been reported37). On the contrary, more recent study did not support the measurement of non-HDL-C concentration as an effective means to predict MetS or the presence of insulin resistance35). It is difficult to compare these results due to the absence of a standardized pediatric MetS diagnostic criterion and disparities in lipid measurements between children and adults. The subjects with high LDL-C levels may have high non-HDL-C levels. Because diagnostic criteria for MetS do not include LDL-C levels, the existence of subjects with high non-HDL-C levels because of high LDL-C levels may explain why non-HDL-C is an effective predictor of CHD but it is less effective in identifying subjects with the MetS or insulin resistance36). Although we did not conduct detailed study on this issue, the relationships between sdLDL-C and non-HDL-C levels remained strong regardless of HOMA-IR levels. We were not able to conclude the relationships between non-HDL-C versus MetS and insulin resistance, but the following differences might be considered. Comparing the study subjects35) with our subjects, they are mixed ethnic groups and approximately 40% were diagnosed as MetS (less than 7% of our subjects who met MetS criteria), and included more obese subjects. Differences for the evaluation of insulin resistance (measurements of insulin-mediated glucose uptake using the insulin suppression test35) versus HOMA-IR in this study) might also be considered. However, given the importance of the MetS as a risk factor for type 2 diabetes mellitus and CHD34), the ability of a non-fasting measurement to identify individuals at increased risk would be of considerable clinical benefit. Another study reported a close association between non-HDL-C levels and MetS in adults with and without diabetes mellitus, but information about use of lipid-lowering therapy was missing32). Therefore, more detailed study on the relationship between non-HDL-C, MetS and insulin resistance may be necessary in various groups of ethnic, age, and metabolic abnormalities.
WC is a simple marker of abdominal obesity and a strong predictor of morbidity and mortality that is independent of BMI. Studies have shown that fat accumulation leads to the dysregulation of adipocytokines, which participate in the pathogenesis of obesity and insulin resistance37–40). Additionally, visceral adiposity appears to confer increased insulin resistance risk, compared to that conferred by subcutaneous fat41). Therefore, we chose WC in addition to HOMAIR for stratification of our subjects.
Non-HDL-C will likely increase in the subjects with obesity, insulin resistance, and hyperglycemia, with their accompanying increases in TG-rich lipoproteins42). To exclude the possibility that TG-rich lipoproteins affect the relationship between non-HDL-C and sdLDL-C, we compared their relationship with that of F_LDL-C and sdLDL-C in the subjects stratified by TG levels. Because it is also known that non-HDL-C serves as an indirect marker for increased LDL42), LDL-C levels might affect the relationship between non-HDL-C and sdLDL-C. Thus, we compared their relationship with that of F_LDL-C and sdLDL-C in the subjects stratified by F_LDL-C levels. Non-HDL-C always showed better relationships with sdLDL-C than F_LDL-C in the subjects stratified by WC, HOMA-IR, TG, and F_LDL-C levels, as judged by correlation coefficients.
We could compare the correlation of sdLDL-C and non-HDL-C or LDL-C in various types of glucose metabolism and evaluate the accumulation of sdLDL in not only the status of lipoprotein disorders but also in glucose or metabolic disorders. However, the numbers of subjects with FPG ≥126 mg/dL or HbA1c ≥6.5% were only 36 and 21, respectively, in our study subjects. Thus, our study subjects may not be suitable for the analysis on the relationship between sdLDL-C and F_LDL-C or non-HDL-C in various glycemic conditions. The relationship between sdLDL-C and F_LDL-C or non-HDL-C with or without existence of MetS may be important. However, only 54 subjects who met Japanese criteria for MetS were found in our study subjects. Again, our study subjects may not be suitable for this analysis. It will be interesting to analyze these important issues in a different population.
Limitation of our study was its cross-sectional nature, which prevented the establishment of a causal relationship. Association between the F_LDL-C or non-HDL-C and sdLDL-C may possibly have been confounded by factors such as diet, alcohol consumption, and exercise. In addition, information regarding mutations in lipid-related genes that may have confounded these relationships was not available. The subjects of this study were middle-aged Japanese individuals, and it is possible that the relationships between F_LDL-C or non-HDL-C and sdLDL-C are affected by age and ethnicity. Moreover, detailed information regarding hypertension was omitted from this study. Finally, our results were calculated from data of only a fraction of the subjects who underwent annual health examinations, and therefore they may not be generalized to all Japanese subjects.
Conclusion
Non-HDL-C is one of the useful surrogate lipid markers for atherogenic sdLDL, at least in Japanese subjects with TG levels <400 mg/dL. Our data suggest that non-HDL-C levels should be reported in all routine lipid profiles and used regularly in dyslipidemia management for the optimal prevention of atherosclerosis and cardiovascular disease.
COI Statement
There are no conflicts of interest to declare.
References
- 1). Randomised trial of cholesterol lowering in 4444 patients with coronary heart disease: The Scandinavian Simvastatin Survival Study (4S). Lancet, 1994; 344: 1383-1389 [PubMed] [Google Scholar]
- 2). Influence of pravastatin and plasma lipids on clinical events in the West of Scotland Coronary Prevention Study (WOSCOPS). Circulation, 1998; 97: 1440-1445 [DOI] [PubMed] [Google Scholar]
- 3). Prevention of cardiovascular events and death with pravastatin in patients with coronary heart disease and a broad range of initial cholesterol levels. The Long-Term Intervention with Pravastatin in Ischemic Disease (LIPID) Study Group. N Engl J Med, 1998; 339: 1349-1357 [DOI] [PubMed] [Google Scholar]
- 4). Downs JR, Clearfield M, Weis S, Whitney E, Shapiro DR, Beere PA, Langendorfer A, Stein EA, Kruyer W, Gotto AM, Jr: Primary prevention of acute coronary events with lovastatin in men and women with average cholesterol levels: results of AFCAPS/TexCAPS: Air Force/Texas Coronary Atherosclerosis Prevention Study. JAMA, 1998; 279: 1615-1622 [DOI] [PubMed] [Google Scholar]
- 5). Nakamura H, Arakawa K, Itakura H, Kitabatake A, Goto Y, Toyota T, Nakaya N, Nishimoto S, Muranaka M, Yamamoto A, Mizuno K, Ohashi Y: MEGA Study Group: Primary prevention of cardiovascular disease with pravastatin in Japan (MEGA Study): a prospective randomised controlled trial. Lancet, 2006; 368: 1155-1163 [DOI] [PubMed] [Google Scholar]
- 6). Rizzo M, Berneis K: Small, dense low-density-lipoproteins and the metabolic syndrome. Diabetes Metab Res Rev, 2007; 23: 14-20 [DOI] [PubMed] [Google Scholar]
- 7). Cohen JC, Boerwinkle E, Mosley TH, Jr, Hobbs HH: Sequence variations in PCSK9, low LDL, and protection against coronary heart disease. N Engl J Med, 2006; 354: 1264-1272 [DOI] [PubMed] [Google Scholar]
- 8). Ai M, Otokozawa S, Asztalos BF, Ito Y, Nakajima K, White CC, Cupples LA, Wilson PW, Schaefer EJ: Small dense LDL cholesterol and coronary heart disease: results from the Framingham Offspring Study. Clin Chem, 2010; 56: 967-976 [DOI] [PMC free article] [PubMed] [Google Scholar]
- 9). Rizzo M, Berneis K: Low-density lipoprotein size and cardiovascular risk assessment. QJM, 2006; 99: 1-14 [DOI] [PubMed] [Google Scholar]
- 10). Packard C, Caslake M, Shepherd J: The role of small, dense low density lipoprotein (LDL): a new look. Int J Cardiol, 2000; 74 (Suppl 1): S17-22 [DOI] [PubMed] [Google Scholar]
- 11). Austin MA, Breslow JL, Hennekens CH, Buring JE, Willett WC, Krauss RM: Low-density lipoprotein subclass patterns and risk of myocardial infarction. JAMA, 1988; 260: 1917-1921 [PubMed] [Google Scholar]
- 12). Nishikura T, Koba S, Yokota Y, Hirano T, Tsunoda F, Shoji M, Hamazaki Y, Suzuki H, Itoh Y, Katagiri T, Kobayashi Y: Elevated small dense low-density lipoprotein cholesterol as a predictor for future cardiovascular events in patients with stable coronary artery disease. J Atheroscler Thromb, 2014; 21: 755-767 [DOI] [PubMed] [Google Scholar]
- 13). Hata Y, Mabuchi H, Saito Y, Itakura H, Egusa G, Ito H, Teramoto T, Tsushima M, Tada N, Oikawa S, Yamada N, Yamashita S, Sakuma N, Sasaki J: Guideline for diagnosis and treatment of hyperlipidemia in adults. Domyakukoka, 1997; 25: 1-34, (in Japanese) [DOI] [PubMed] [Google Scholar]
- 14). Hata Y, Mabuchi H, Saito Y, Itakura H, Egusa G, Ito H, Teramoto T, Tsushima M, Tada N, Oikawa S, Yamada N, Yamashita S, Sakuma N, Sasaki J, Working Committee on JAS Guideline for Diagnosis and Treatment of Hyperlipidemias : Report of the Japan Atherosclerosis Society (JAS) Guideline for Diagnosis and Treatment of Hyperlipidemia in Japanese Adults. J Atheroscler Thromb, 2002; 9: 1-27 [DOI] [PubMed] [Google Scholar]
- 15). Teramoto T, Sasaki J, Ueshima H, Egusa G, Kinoshita M, Shimamoto K, Daida H, Biro S, Hirobe K, Funahashi T, Yokote K, Yokode M: Executive summary of Japan Atherosclerosis Society (JAS) guideline for diagnosis and prevention of atherosclerotic cardiovascular diseases for Japanese. J Atheroscler Thromb, 2007; 14: 45-50 [DOI] [PubMed] [Google Scholar]
- 16). JAS Guidelines for Prevention of Atherosclerotic Cardiovascular Diseases 2012, Japan Atherosclerosis Society, Tokyo, Japan, 2012. (in Japanese) [Google Scholar]
- 17). Martin SS, Michos ED: Are we moving towards concordance on the principle that lipid discordance matters? Circulation, 2014; 129: 539-541 [DOI] [PMC free article] [PubMed] [Google Scholar]
- 18). Brunzell JD, Davidson M, Furberg CD, Goldberg RB, Howard BV, Stein JH, Witztum JL: Lipoprotein management in patients with cardiometabolic risk: consensus conference report from the American Diabetes Association and the American College of Cardiology Foundation. J Am Coll Cardiol, 2008; 51: 1512-1524 [DOI] [PubMed] [Google Scholar]
- 19). Scharnagl H, Nauck M, Wieland H, Marz W: The Friedewald formula underestimates LDL cholesterol at low concentrations. Clin Chem Lab Med, 2001; 39: 426-431 [DOI] [PubMed] [Google Scholar]
- 20). Hirano T, Ito Y, Koba S, Toyoda M, Ikejiri A, Saegusa H, Yamazaki J, Yoshino G: Clinical significance of small dense low-density lipoprotein cholesterol levels determined by the simple precipitation method. Arterioscler Thromb Vasc Biol, 2004; 24: 558-563 [DOI] [PubMed] [Google Scholar]
- 21). St-Pierre AC, Cantin B, Dagenais GR, Mauriège P, Bernard PM, Després JP, Lamarche B: Low-density lipoprotein subfractions and the long-term risk of ischemic heart disease in men: 13-year follow-up data from the Québec Cardiovascular Study. Arterioscler Thromb Vasc Biol, 2005; 25: 553-559 [DOI] [PubMed] [Google Scholar]
- 22). Matthews DR, Hosker JP, Rudenski AS, Naylor BA, Treacher DF, Turner RC: Homeostasis model assessment: insulin resistance and beta-cell function from fasting plasma glucose and insulin concentrations in man. Diabetologia, 1985; 28: 412-419 [DOI] [PubMed] [Google Scholar]
- 23). Friedewald WT, Levy RI, Fredrickson DS: Estimation of the concentration of low-density lipoprotein cholesterol in plasma, without use of the preparative ultracentrifuge. Clin Chem, 1972; 18: 499-502 [PubMed] [Google Scholar]
- 24). Tribble DL, Rizzo M, Chait A, Lewis DM, Blanche PJ, Krauss RM: Enhanced oxidative susceptibility and reduced antioxidant content of metabolic precursors of small, dense low-density lipoproteins. Am J Med, 2001; 110: 103-110 [DOI] [PubMed] [Google Scholar]
- 25). McQueen MJ, Hawken S, Wang X, Ounpuu S, Sniderman A, Probstfield J, Steyn K, Sanderson JE, Hasani M, Volkova E, Kazmi K, Yusuf S: INTERHEART study investigators. Lipids, lipoproteins, and apolipoproteins as risk markers of myocardial infarction in 52 countries (the INTERHEART study): a case-control study. Lancet, 2008; 372: 224-233 [DOI] [PubMed] [Google Scholar]
- 26). Saito E, Okada T, Abe Y, Kazama M, Yonezawa R, Kuromori Y, Iwata F, Hara M: Non-high-density lipoprotein cholesterol levels in Japanese obese boys with metabolic syndrome. J Atheroscler Thromb, 2015; September 25. [Epub ahead of print] [DOI] [PubMed] [Google Scholar]
- 27). Berneis KK, Krauss RM: Metabolic origins and clinical significance of LDL heterogeneity. J Lipid Res, 2002; 43: 1363-1379 [DOI] [PubMed] [Google Scholar]
- 28). Griffin BA: Lipoprotein atherogenicity: an overview of current mechanisms. Proc Nutr Soc, 1999; 58: 163-169 [DOI] [PubMed] [Google Scholar]
- 29). Goulinet S, Chapman MJ: Plasma LDL and HDL subspecies are heterogenous in particle content of tocopherols and oxygenated and hydrocarbon carotenoids. Relevance to oxidative resistance and atherogenesis. Arterioscler Thromb Vasc Biol, 1997; 17: 786-796 [DOI] [PubMed] [Google Scholar]
- 30). Arai H, Kokubo Y, Watanabe M, Sawamura T, Ito Y, Minagawa A, Okamura T, Miyamato Y: Small dense lowdensity lipoproteins cholesterol can predict incident cardiovascular disease in an urban Japanese cohort: the Suita study. J Atheroscler Thromb, 2013; 20: 195-203 [DOI] [PubMed] [Google Scholar]
- 31). Maeda S, Nakanishi S, Yoneda M, Awaya T, Yamane K, Hirano T, Kohno N: Associations between small dense LDL, HDL subfractions (HDL2, HDL3) and risk of atherosclerosis in Japanese-Americans. J Atheroscler Thromb, 2012; 19: 444-452 [DOI] [PubMed] [Google Scholar]
- 32). Huang J, Parish R, Mansi I, Yu H, Kennen EM, Davis T, Carden D: Non-high-density lipoprotein cholesterol in patients with metabolic syndrome. J Investig Med, 2008; 56: 931-936 [DOI] [PubMed] [Google Scholar]
- 33). Li C, Ford ES, McBride PE, Kwiterovich PO, McCrindle BW, Gidding SS. Non-high-density lipoprotein cholesterol concentration is associated with the metabolic syndrome among US youth aged 12-19 years. J Pediatr, 2011; 158: 201-207 [DOI] [PubMed] [Google Scholar]
- 34). Alberti KG, Eckel RH, Grundy SM, Zimmet PZ, Cleeman JI, Donato KA, Fruchart JC, James WP, Loria CM, Smith SC, Jr, International Diabetes Federation Task Force on Epidemiology and Prevention; Hational Heart, Lung, and Blood Institute; American Heart Association; World Heart Federation; International Atherosclerosis Society; International Association for the Study of Obesity : Harmonizing the metabolic syndrome: a joint interim statement of the International Diabetes Federation Task Force on Epidemiology and Prevention; National Heart, Lung, and Blood Institute; American Heart Association; World Heart Federation; International Atherosclerosis Society; and International Association for the Study of Obesity. Circulation, 2009; 120: 1640-1645 [DOI] [PubMed] [Google Scholar]
- 35). Liu A, Reaven GM. Is measurement of non-HDL cholesterol an effective way to identify the metabolic syndrome? Nutr Metab Cardiovasc Dis, 2013; 23: 1122-1127 [DOI] [PMC free article] [PubMed] [Google Scholar]
- 36). Pischon T, Girman CJ, Sacks FM, Rifai N, Stampfer MJ, Rimm EB. Non-high-density lipoprotein cholesterol and apolipoprotein B in the prediction of coronary heart disease in men. Circulation, 2005; 112: 3375-3383 [DOI] [PubMed] [Google Scholar]
- 37). Hotamisligil GS, Shargill NS, Spiegelman BM. Adipose expression of tumor necrosis factor-alpha: direct role in obesity-linked insulin resistance. Science, 1993; 259: 87-91 [DOI] [PubMed] [Google Scholar]
- 38). Friedman JM, Halaas JL. Leptin and the regulation of body weight in mammals. Nature, 1998; 395: 763-770 [DOI] [PubMed] [Google Scholar]
- 39). Okamoto Y, Kihara S, Funahashi T, Matsuzawa Y, Libby P. Adiponectin: a key adipocytokine in metabolic syndrome. Clin Sci, 2006; 110: 267-278 [DOI] [PubMed] [Google Scholar]
- 40). Fried SK, Bunkin DA, Greenberg AS: Omental and subcutaneous adipose tissues of obese subjects release interleukin-6: depot difference and regulation by glucocorticoid. J Clin Endocrinol Metab 1998; 83: 847-850 [DOI] [PubMed] [Google Scholar]
- 41). Wajchenberg BL: Subcutaneous and visceral adipose tissue: their relation to the metabolic syndrome. Endocr Rev, 2000; 21: 697-738 [DOI] [PubMed] [Google Scholar]
- 42). Blaha MJ, Blumenthal RS, Brinton EA, Jacobson TA, National Lipid Association Taskforce on Non-HDL Cholesterol : The importance of non-HDL cholesterol reporting in lipid management. J Clin Lipidol, 2008; 2: 267-273 [DOI] [PubMed] [Google Scholar]


