Abstract
Exposure to cigarette smoke during development is linked to neurodevelopmental delays and cognitive impairment including impulsivity, attention deficit disorder, and lower IQ. Utilizing a murine experimental model of "active" inhalation exposure to cigarette smoke spanning the entirety of gestation and through human third trimester equivalent hippocampal development [gestation day 1 (GD1) through postnatal day 21 (PD21)], we examined hippocampus proteome and metabolome alterations present at a time during which developmental cigarette smoke exposure (CSE)-induced behavioral and cognitive impairments are evident in adult animals from this model system. At six month of age, carbohydrate metabolism and lipid content in the hippocampus of adult offspring remained impacted by prior exposure to cigarette smoke during the critical period of hippocampal ontogenesis indicating limited glycolysis. These findings indicate developmental CSE-induced systemic glucose availability may limit both organism growth and developmental trajectory, including the capacity for learning and memory.
Keywords: Cigarette smoke, hippocampus, proteome, metabolome, murine, developmental, tobacco
1. INTRODUCTION
Approximately 44 million adults in the US smoke cigarettes [1]. Tobacco smoke includes nicotine, carbon monoxide, acetone, heavy metals such as Cd, Hg, and Pb, polycyclic aromatic hydrocarbons, and over 8000 other substances many of which are toxic [2, 3]. Despite extensive US public health initiatives describing widespread adverse reproductive and developmental outcomes associated with in utero tobacco smoke exposure of the embryo/fetus, approximately twenty percent of pregnant women continue to smoke cigarettes during their pregnancy [4]. Low birth weight is one of the most recognized and well documented outcomes resulting from prenatal exposure to maternal cigarette smoke consumption [5–7]. Children exposed to cigarette smoke during development exhibit aberrant behavioral and cognitive development including hyperactivity and impulsivity in childhood [8–10], impaired learning and memory [11, 12], perception deficits [13, 14], and delayed intellectual development [15–19]. The hippocampus plays an important role in orchestrating learning and memory processing [20–25] including declarative memory, spatial cognition, memory consolidation, multimodal sensory integration, habituation and novelty detection, as well as temporal information processing and sequencing [26–36].
Exposure to nicotine, the primary addictive component of cigarette smoke, during development elicits alterations in the expression of neurotransmitters as well as nicotinic cholinergic receptor development [37–41]. Nicotine also induces excessive cellular apoptosis in the embryonic brain during neurulation [42, 43]. Though studies of inhalation exposure to actual cigarette smoke in animal models during development are limited, isolated exposure to nicotine impacts hippocampus development via decreasing cell proliferation and enhancing apoptosis [44], altering cell size, cell density and layer thickness [45–47], and interfering with neuronal synaptic connectivity [48, 49]. Exposure to cigarette smoke and components such as nicotine during the critical period of pre- and postnatal neurodevelopment alters offspring neurodevelopmental maturation and behavioral outcomes – effects which have been documented in the murine model of developmental CSE utilized within the current study with identical offspring [50]. Specifically, adult mice that were previously exposed to CSE throughout gestation and the critical postnatal period of neurodevelopment (GD1-PD21) exhibited less than normal anxiety in the elevated zero maze, impaired hidden platform learning during acquisition in the Morris water maze, and transient hypoactivity during a 1 h locomotor activity test. These mice also demonstrated a sexually dimorphic response in central zone locomotion to methamphetamine challenge [50].
The main objective of the current study was to determine the impact of developmental CSE on the hippocampus biomolecular phenotype in adult animals 5 months after the cessation of exposure. Hippocampus proteome and metabolome profiles were previously examined in juvenile offspring on PD21, at the time of weaning and cessation of exposure, in this mouse model of 'active' maternal cigarette smoke inhalation exposure [51]. This animal model is characterized by attendant low birth weight in CSE offspring with continuation of CSE and the reduction in offspring weights during the postnatal period of neurodevelopment through PD21. Attendant altered neurobehavioral phenotypes in adult offspring at age 6 months were evident [50]. Exposure throughout development to cigarette smoke in our murine model resulted in alterations in the biomolecular phenotype of the hippocampus that were detectable at weaning. These changes included suppression of glycolysis, oxidative phosphorylation, and fatty acid metabolism [52]. In proteome analyses conducted in parallel with our neurobehavioral phenotyping studies, juvenile CSE offspring (aged PD21) from litters identical to those used in the neurobehavioral studies demonstrated altered liver and kidney proteome profiles [53, 54] with sustained impact into adulthood approximately 5 months after cessation of exposure [55, 56]. The current study reports attendant alterations in the hippocampus biomolecular phenotype in these offspring – i.e. 5 months after the cessation of developmental CSE.
2. MATERIALS AND METHODS
2.1. Animal Exposures
Detailed descriptions of the experimental methodology can be found within the lead manuscript ([55], liver proteome profiles) for the present series of reports of sustained toxicity of developmental exposure to cigarette smoke. An abbreviated methodology section follows.
The inhalation exposure chamber conditions for the current study were identical to the conditions reported previously [51, 53, 54]. Adult C57BL/6J mice were housed and maintained in the University of Louisville Research Resources Center, an Association for Assessment and Accreditation of Laboratory Animal Care accredited facility. Dams were randomly assigned to either the control (Sham) or cigarette smoke exposure (CSE) group. Animals were exposed to ambient air or cigarette smoke for 6 hours per day, 7 days per week, from gestation day one (GD1) through postnatal day twenty-one (PD21). A Teague TE-10C whole body smoke inhalation exposure system (Teague Enterprises; Davis, CA)[57] was utilized to generate, dilute, and deliver mixed mainstream/sidestream cigarette smoke at the rate of 40 cigarettes smoked per 6 hour period. Mice were exposed to a portion of the total smoke generated prior to dilution sufficient to raise serum cotinine levels above 50 ng/mL, within for an 'active' exposure paradigm. Cigarette smoke was generated from Philip Morris Marlboro Red brand cigarettes™ (Philip Morris; Richmond, VA; 15mg of tar/cigarette; 1.1mg nicotine/cigarette; additives), selected since it represents the most popular brand of cigarettes consumed among 18–25 year olds - the age group containing the majority of maternal smokers [58–61]. Cigarettes were smoked using the standard Federal Trade Commission method: a two second, 35 cm3 puff, once a minute for a total of 9 min [57]. Cotinine levels were assayed by electrospray tandem mass spectrometry (ESI-MS/MS) utilizing a direct inject platform (Nanomate) coupled to a 7T LTQ-FT-ICR-MS [62–65].
At 6 months of age, following behavioral and cognitive assessments [50], offspring were euthanized by asphyxiation with carbon dioxide followed by thoracotomy and cardiac puncture. Tissues were harvested and stored at −80°C until analysis. Proteome profiling of hippocampus and other tissues was conducted on identically exposed littermates at the time of weaning (juveniles; PD21) [52–54] and at adulthood (6 months of age) [55, 56].
2.2.1. 2D-SDS-PAGE and Image Analysis
The hippocampus samples (n=9 per group; single horn) were homogenized with the protein concentration for each of the samples determined using the Bradford Assay [66] as in [55]. Four hundred micrograms of protein in rehydration buffer was separated by isoelectric focusing at 22,000 Volt hours (Vhrs) then followed by sequential equilibration in reducing buffer and alkylating buffer. Second dimension SDS-PAGE separation (25cm × 20.5cm 15% polyacrylamide gels) was performed overnight (18 hrs; 100V). Protein spots were visualized by Colloidal Coomassie Blue G-250. Gels were scanned using an Epson Expression 10000 XL scanner with transparency attachment. Densitometric analysis of gel images was performed with Progenesis SameSpots software (Nonlinear Dynamics; New Castle-on-Tyne, UK). Protein spots were detected automatically and manually adjusted where necessary for accuracy. Spots with average normalized pixel depth of ≤1000 relative abundance units and non-normalized areas with pixel depth below 100 were removed as noise. The averaged normalized spot abundance was compared between groups to determine fold differences in abundance.
2.2.2. Mass Spectrometry Based Protein Identification
Protein spots were excised and destained with 50% ethanol in 50 mM ammonium bicarbonate for a minimum of 5 washes. Excised gel spots were then dehydrated in acetonitrile (ACN), dried, and rehydrated with 10 ng/µl trypsin and 40mM ammonium bicarbonate. Proteins were digested at room temperature for approximately 18 hrs. Peptides were eluted in acidified acetonitrile and stored at −20°C until analysis. The mass to charge ratio of peptides was determined by direct inject LTQ/FT-ICR-MS/MS (or HPLC interface on occasion) with collision induced dissociation for structural feature identification. Peptide identification was performed with the Mascot (Matrix Sciences v 2.2.2) search algorithm utilizing the NCBInr (with decoy) database (updated June 1, 2010). Search parameters included: mammalian class, 2 missed cleavages, carbamidomethyl C variable modification, enzyme trypsin/P, and an allowed peptide charge of 1+, 2+, or 3+. Positive protein identification required a total MOWSE (MOlecular Weight SEarch) absolute probability protein score of ≥100 composed of a minimum of two peptides with individual MOWSE absolute probability scores ≥50 [52–54]. Proteins that represent the predominant contribution to the spot intensity, as determined by a minimum of 200% of the MOWSE score of the next ranked protein identified, are listed (Table 1).
Table 1.
Protein spots with altered abundances that were ranked of greatest import within the PLS-DA model, VIP values (≥1.7).
| Spot Number |
GI Number |
Abbreviation1 | Protein Identification | VIP | Percent Change |
|---|---|---|---|---|---|
| 1 | 55217 | VCP | Valosin-containing protein | 1.94 | −30 |
| 2 | 1915913 | Ulip2 protein | 2.04 | −30 | |
| 3 | 148702256 | NSF | N-ethylmaleimide sensitive fusion protein, isoform CRA_a | 1.90 | −34 |
| 4 | 6755995 | WD repeat domain 1 | 1.82 | −27 | |
| 5 | 40254595 | DPYSL2 | Dihydropyrimidinase-like 2 | 1.73 | −25 |
| 6 | 14389431 | Stress-induced phosphoprotein 1 | 1.71 | −22 | |
| 7 | 6753324 | CCT6A | Chaperonin containing Tcp1, subunit 6a | 2.00 | −19 |
| 8 | 1405933 | PKM | M2-type pyruvate kinase | 1.74 | −26 |
| 9 | 52353955 | PCK1 | Phosphoglycerate dehydrogenase | 1.99 | −23 |
| 10 | 38649320 | ENO1 | Eno1 protein | 1.72 | −23 |
| 11 | 31982332 | GLUL | Glutamine synthetase | 2.71 | −59 |
| 12 | 202423 | Phosphoglycerate kinase | 2.10 | −24 | |
| 13 | 6754012 | GNAO | Guanine nucleotide binding protein, alpha o isoform A | 2.21 | −29 |
| 14 | 6678674 | LDHB | L-lactate dehydrogenase B | 1.72 | −20 |
| 15 | 1864018 | TPI1 | Triosephosphate isomerase | 1.80 | −13 |
| 16 | 224839 | Tubulin complex |
Tubulin T beta15 | 2.15 | +26 |
| 17 | 7305027 | ENO2 | Enolase 2, gamma neuronal | 1.83 | +15 |
| 18 | 226005 | Protein 40kD | 2.14 | +26 | |
| 19 | 16905129 | Neuronal calcium-binding protein 2 | 2.67 | +35 | |
| 20 | 13435888 | TUBA1B | Tuba1b protein | 1.85 | +40 |
| 21 | 2690302 | Aspartate aminotransferase precursor | 1.94 | +28 | |
| 22 | 18250284 | Isocitrate dehydrogenase 3 (NAD+) alpha | 1.94 | +47 | |
| 23 | 13529599 | LDHA | Ldha protein | 1.73 | +29 |
| 24 | 1200100 | MDH2 | Malate dehydrogenase | 1.79 | +22 |
| 25 | 29789104 | NAPB | N-ethylmaleimide sensitive fusion attachment protein beta | 1.76 | +21 |
| 26 | 6755965 | VDAC2 | Voltage-dependent anion channel 2 | 2.02 | +19 |
| 27 | 1526539 | 14-3-3 zeta | 1.91 | +27 | |
| 28 | 114326546 | Bisphosphoglycerate mutase 1 | 1.76 | +25 | |
| 29 | 21312520 | Quinoid dihydropteridine reductase | 2.53 | +23 | |
| 30 | 12805413 | ECHS1 | Echs1 protein | 2.02 | +13 |
| 31 | 53450 | Manganese superoxide dismutase | 2.05 | +20 | |
| 32 | 6678047 | SNCA | Synuclein, alpha | 1.95 | +35 |
| 33 | 13435888 | TUBA1B | Tuba1b protein | 2.22 | +42 |
| 34 | 6679439 | PPIA | Peptidylprolyl isomerase A | 2.26 | +26 |
2.2.3. Statistical Analysis
Partial Least Squares-Discriminant Analysis (PLS-DA): modeling of variance between groups with Variable Importance in Projection (VIP) rankings was used to identify protein spot features whose normalized abundance determined the differences between groups [67]. Sequential removal of top ranked protein spots was performed until the variance between groups was eliminated (VIP≥1.7). Due to the number of biological replicates per group (n=9 for Sham group and n=9 for CSE group without technical replicates), the dataset was not split into a test and validation set.
2.3. Ingenuity® Pathway Analysis
Proteins of interest as determined by PLS-DA modeling and VIP ranking were loaded into the Ingenuity® Pathway Analysis search algorithm to determine metabolic pathways impacted (Ingenuity Systems, 2010). Networks of interactions between the proteins and their respective genes were generated by the program.
2.4.1. Global Metabolome Profiling
Hippocampus tissue (single horn from same animal as for the proteome profiling) was weighed and homogenized with 5 volumes of ice-cold HPLC-grade 1:2 chloroform/methanol with subsequent collection of organic phases. The samples were dried under vacuum and stored at −80°C until analysis. At time of spectral collection, positive polarity spectral features were collected with chip-based nanoelectrospray (Advion TriVersa Nanomate) for direct infusion positive ion LTQ-FT-ICR-MS. The sample spray characteristics were stable (greater than 5 minutes) with ion current falling between 10–90 nA (2.1 kV spray voltage and 0.05 psi head pressure). A spectral range of 50–1000 m/z was recorded for 0.5 min with 100,000 as the resolution. Biological and technical replicates were injected in alternating group order.
2.4.2. Spectra Processing and Feature Validation
The raw spectra were filtered to remove background noise (threshold of 3000 arbitrary intensity units) prior to peak detection and shaping followed by spectra deisotoping and removal of blank mass features. Isotopic clusters were identified using an m/z tolerance of 0.0010 Da, a minimum/maximum charge of 5, and the first allowed gap at position 3. The isotopic clustered peaks were then excluded from analysis.
2.4.3. Statistical Analysis
Statistical analysis was performed using the R package caret [68]. The data (610 m/z features) containing all non-noise, non-adduct features from the two phases collected in positive polarity were normalized by mean centering and unit variance scaling prior to analysis. The PLS-DA was performed on normalized CSE/Sham hippocampus samples to select an optimal subset (number) of m/z features with respect to classification accuracy from the original 610 m/z features using a double cross-validation scheme to optimize both the number of PLS components and number of peaks used for classification. The variable importance measure is based on weighted sums of the absolute PLS loadings, where the weights are based on the relative percentage of explained variation associated with each component. The PLS-DA classifier with the optimal number of components using the optimal subset of peaks was used to construct the final classifier.
2.4.4. Putative Feature Identification
The neutral monoisotopic masses of the putative features of interest generated from the above statistical analyses were calculated. The tentative identification of the features of interest was based on the accurate mass obtained from a search of the Human Metabolome Database (HMDB) and Lipid MAPS [69]. Preliminary identification was dependent on agreement of predicted and observed isotopic distribution. The results were combined and the preliminary redundant identifications were deleted. Though not positively identified by standard compound fragment comparison, the putative feature list includes several previously described hippocampus lipid species. The putative chemical class identification and the possibility of inclusion of sodium and potassium adducts for these peaks were also checked by MS/MS fragmentation pattern (Table 2). Unannotated features of interest are also listed and maintain importance in differentiating the two groups (Figures 8 and 9).
Table 2.
Putative identification of metabolite features contributing to the separation of groups in the hippocampus metabolome profiles of 6 month old offspring previously exposed to cigarette smoke on GD1- PD21.
| Mass adduct M + H+ |
Mass deviation | Structure | Putative ID |
|---|---|---|---|
| 279.0711 | 0.0042 | C10H15O9 | FA (10:0) |
| 305.2475 | 0.0001 | C20H33O2 | FA (20:4) |
| 359.2428 | 0.0049 | C19H35O6 | FA (19:0), FA (19:1), FA (19:2) |
| 729.5905 | 0.0056 | C41H82N2O6P | SM(d36:2), TG (43:4) |
| 731.6184 | 0.0048 | C46H83O6 C41H84N2O6P |
TG(43:3) SM(d36:1) |
| 744.5984 | 0.0033 0.0049 |
C42H82NO9 C42H83NO7P |
HexCer(t36:1) PC(O-34:2), PC(P-34:1), PE(O-37:2) or PE(P-37:1) |
| 754.5745 | 0.0060 | C43H81NO7P | PE(O-38:4) or PE(P-38:3) |
| 756.5538 | 0.0030 | C42H79NO8P | PC(34:3) or PE(37:3) |
| 759.6375 | 0.0053 | C43H88N2O6P C48H87O6 |
SM(d38:1) TG(45:3) |
| 762.6008 | 0.0026 | C42H85NO8P | PC(34:0) or PE(37:0) |
| 766.5745 | 0.0040 | C44H81NO7P | PC(O-36:5) or PC(P-36:4) |
| 784.5851 | 0.0070 | C44H83NO8P | PC(36:3) or PE(39:3) |
| 787.6688 | 0.0026 | C45H92N2O6P C50H91O6 |
SM(d40:1) or TG(47:3) |
| 790.5593 | 0.0066 | C42H81NO10P C46H81NO7P |
PS(36:1) PC(P-38:6) |
| 812.5436 | 0.0054 | C44H79NO10P | PS(38:4) |
| 814.6321 | 0.0067 | C46H89NO8P | PC(38:2) or PE(41:2) |
| 838.5593 | 0.0038 | C46H81NO10P | PS(40:5) |
| 842.6634 | 0.0061 | C48H93NO8P | PC(40:2) or PE(43:2) |
| 887.5727 | 0.0007 | C47H83O15 | DGDG(32:3) |
Putative identifications of structures do not include MS/MS validation of identification.
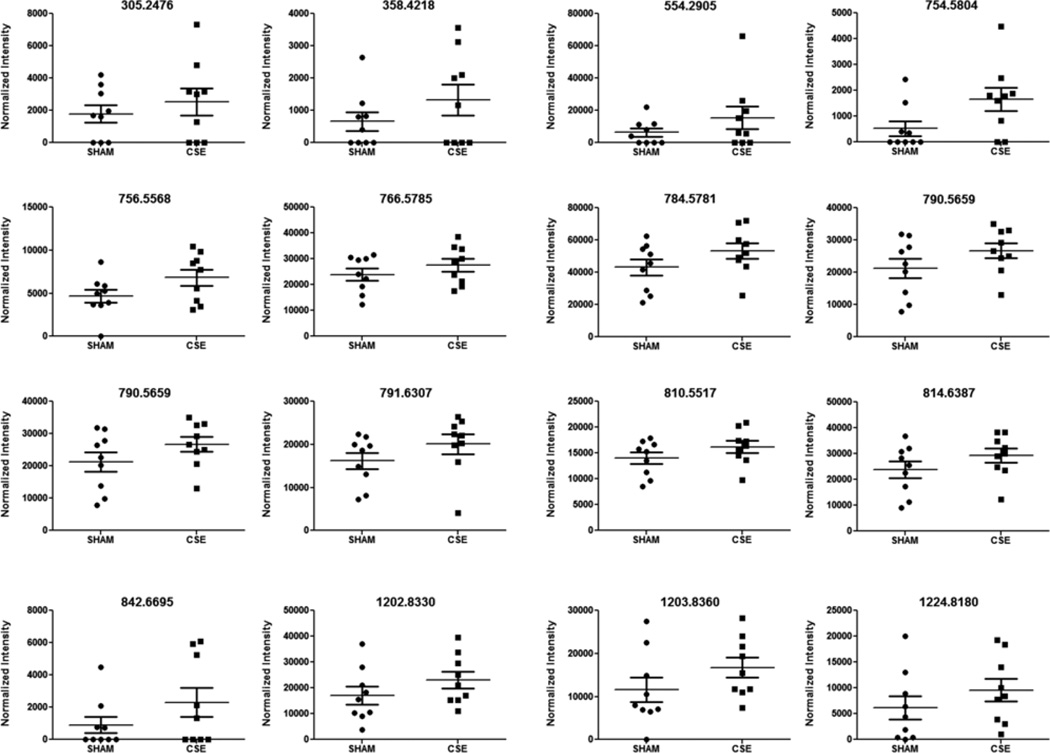
Figure 8. Spectral intensities of 6 month old offspring hippocampus metabolite features of interest that were increased between the developmental CSE and Sham groups based on the described PLS-DA model.
The features represent positively charged adducts (M+H+ and possibly M+Na+) that were ranked at VIP>1.5 or above for the first two vectors of the PLS-DA model.
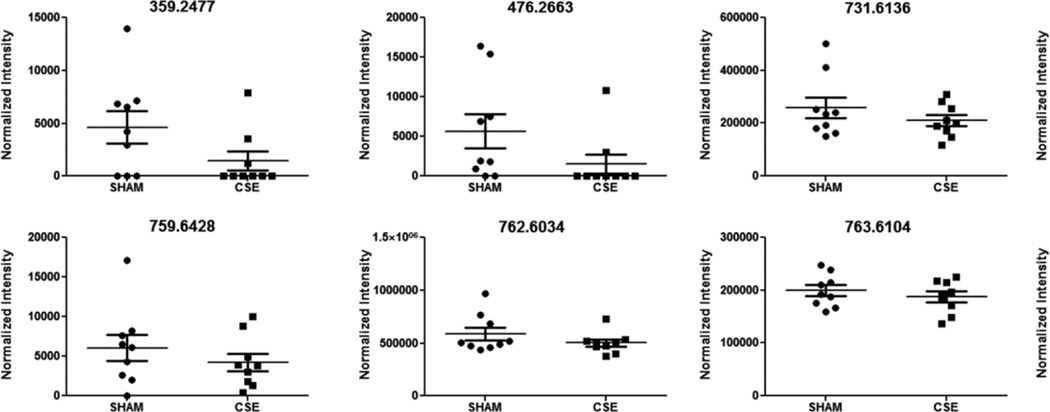
Figure 9. Spectral intensities of 6 month old offspring hippocampus metabolite features of interest that were decreased between the developmental CSE and Sham groups based on the described PLS-DA model.
The features represent positively charged adducts (M+H+ and possibly M+Na+) that were ranked at VIP>1.5 or above for the first two vectors of the PLS-DA model.
2.5. Glutathione (GSH and GSSG) Assay
The ratio of reduced/oxidized glutathione (GSH/GSSG) was utilized as an indicator of oxidative stress. To measure total glutathione (GSH + 2GSSG), GSH standards (or sample homogenate) was combined with 50mM phosphate buffer (pH=7.2) containing 2mM EDTA with the addition of 2µUnits of glutathione reductase, and incubated in the presence of DNTB for 30 minutes in the dark followed by spectral acquisition at 405nm [70, 71]. A separate GSSG standard curve was constructed for GSSG measurement with the modification of a pre-incubation of samples or standards with 100mM 2-vinylpyridine for 60 minutes followed by addition of glutathione reductase and subsequent incubation in the presence of DNTB as described for total glutathione measurements. All glutathione measurements were normalized to total protein as measured by the Bradford assay [66]. The amount of free GSH was calculated from the total glutathione minus the GSSG levels in each sample. The ratio of GSH/GSSG was then calculated.
2.6. Glutathione-S-Transferase (GST) and Glutathione Reductase (GR) Assay
Hippocampus GST activity was measured as an indicator of detoxification activity [72]. The total GST activity in the hippocampus was measured using the enzyme driven conjugation of 1-chloro-2,4-dinitrobenzene (CDNB) to reduced glutathione (absorbance read at 340 nm each minute for 15 minutes; Cayman Chemical Company). The absorbance per minute was divided by amount of protein (mg) to determine the specific activity for each sample [73]. Glutathione reductase activity was measured spectrophotometrically by mixing an aliquot of tissue homogenate with GSSG and measuring the GST enzyme driven conjugation to 1-chloro-2,4-dinitrobenzene (CDNB) to reduced glutathione (absorbance read at 340 nm each minute for 15 minutes; Cayman Chemical Company) [74].
2.7. Western Blot
Hippocampus protein homogenates from the 2D-SDS-PAGE preparations were mixed 1:1 with Laemmli buffer (0.25M Tris pH 6.8, glycerol, 10% SDS, bromophenol blue trace) then heated at 70° C for 10 minutes. Twenty-five µg total protein was separated by 10% PAGE for 2 hours at a 100V in Tris-glycine run buffer (0.025 M Tris Base, 0.192 M glycine, 0.1% SDS) followed by electrophoretic transfer to PVDF membrane at 90V for 1 hour in transfer buffer (0.025M Tris base, 0.192M glycine, 10% ethanol). Following blocking in 4% non-fat dry milk, the blots were incubated overnight at 4°C with primary antibody diluted 1:500 in non-fat dry milk (SIRT1, sc-19857, Santa Cruz Biotechnology, Dallas, TX; NAMPT, PA5-23198, Thermo Scientific, Rockford, IL). After three washes of 15 minutes in cold PBS-Tween, blots were incubated with secondary antibody complexed to horse radish peroxidase (1:1000, Santa Cruz Biotechnology, Dallas, TX) diluted in non-fat dry milk at room temperature for 1 hour. After three washes in cold PBS-Tween, blots were developed with chemiluminescence substrate and visualized with an ImageQuant LAS 4000 (G.E. Healthcare Life Sciences, Pittsburg, PA). Following visualization, blots were washed three times with PBS-Tween, incubated in 2M glycine for 30 minutes followed by another three washes in PBS-Tween and subsequent incubation with β-actin primary antibody (1:1000 dilution; sc-81173, Santa Cruz Biotechnology, Dallas TX) and secondary antibody and visualization as described above [75].
3. RESULTS
3.1. Exposure Conditions and Outcomes
The inhalation exposure chamber conditions for the current study were identical to the conditions reported previously [51, 53, 54]. Average levels of carbon monoxide and TSP in CSE chamber during GD1-PD21 were 138 ± 19.8 ppm and 25.4 ± 6.5 mg/m3, respectively, while those in Sham exposure chamber were lower than detection limit [53, 55]. At birth, the offspring exhibited low birth weight with a persistence of impact of CSE on offspring weight evident throughout the postnatal exposure period. The average weight deficit of the CSE versus the Sham offspring was 13.2% (p<0.05) which was reflected in organ weights suggesting that the weight deficit is a proportional decrease in mass across all organs [53]. Offspring weights were collected 1 week prior to tissue collections for the current study. Adult offspring aged 6 months, who were exposed throughout development to cigarette smoke, exhibited deficits in weight (~15%, p<0.05; [50]) indicating that 'catch-up' growth had not occurred. The weight of the whole brain or of the hippocampus was not determined in the current study.
3.2. Hippocampus Proteome Profile
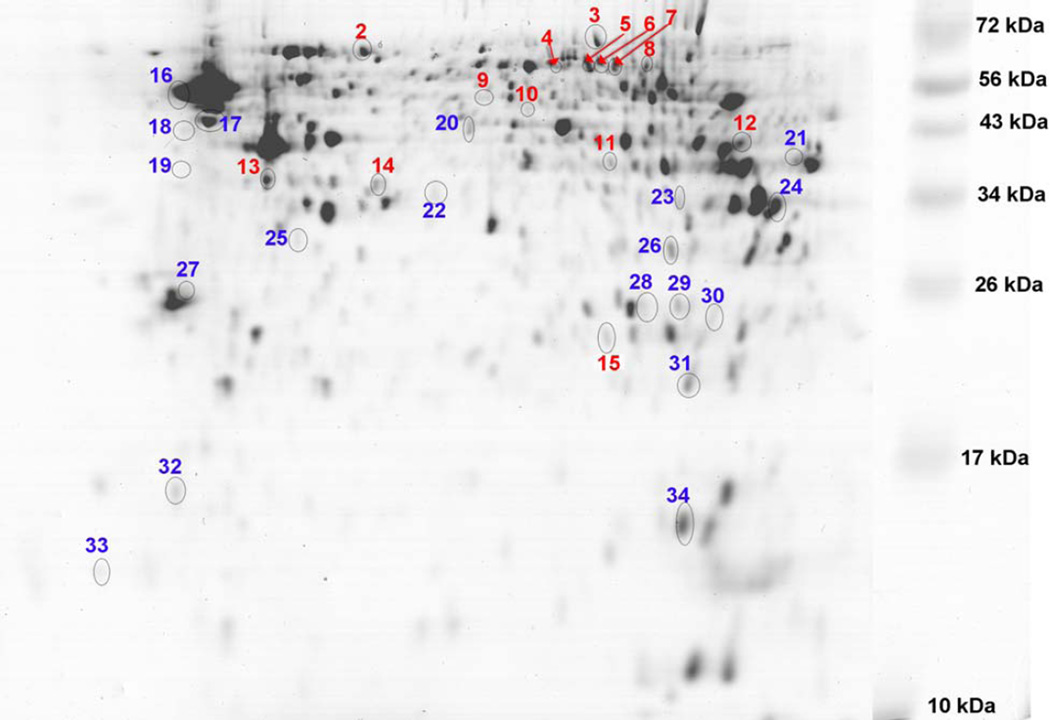
A 2D-SDS-PAGE protein spot map is shown with color coded numbers labeling the top VIP1 ranked proteins (VIP1>1.7) with increased and decreased normalized abundances (Figure 1). The proteins identified as present in these spots are listed in Table 1 (blue, increased abundance; red, decreased abundance). The molecular weight of the proteins ranged from greater than 100kDa to 10 kDa; molecular weight descended from the top to the bottom of the gel image. The isoelectric focusing point spanned a pH of 3–10, with the acidic proteins on the left and the basic proteins on the right of the gel image. The predominant variance between groups was the intensity of protein spot abundances rather than the appearance/disappearance of protein spots. Average normalized gel protein spot pixel density was 2602762716 ± 75727318 for the Sham and 2725382290 ± 96260169 for the CSE.
Figure 1. Hippocampus proteome profiles of 6 months old offspring previously developmentally exposed to cigarette smoke.
The proteins with altered abundance that contributed to the separation of the groups within the PLS-DA model and possessed the highest VIP values (≥1.7) are numbered. Numbers in blue represent increased abundance and the numbers in red represent decreased abundance. The gel image is highly contrasted to enable visualization of low abundant protein spots. Refer to Table 1 for protein identifications.
3.3. Proteome Partial Least Squares-Discriminant Analyses
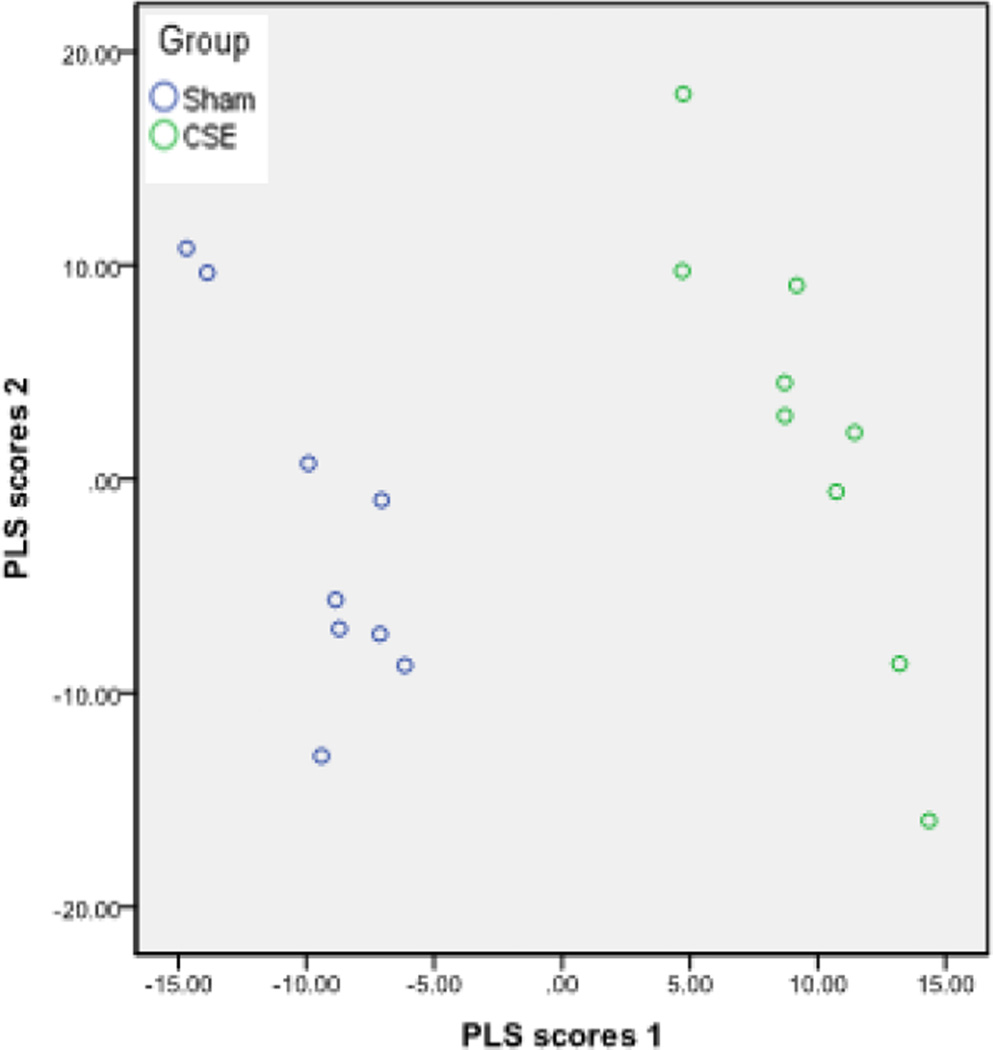
A total of ~500 protein spots remained after the noise pixels were excluded. The normalized spot abundance (pixel depth) of each protein spot, present on all gels, was utilized for Partial Least Squares-Discriminant Analysis (PLS-DA; IBM SPSS Statistics 20). When all non-noise protein spots were included in the analysis, the first two latent factors accounted for 89% of the variance between groups. In Figure 2, the separation between the Sham and CSE groups based on the top two latent factors were plotted.
Figure 2. The PLS-DA model effectively describes the differences between the hippocampus proteome profiles of Sham and developmental CSE offspring at 6 months of age.
Plotting the first two vectors within the PLS-DA model visualizes the variance in hippocampus proteome profiles between the developmental CSE and Sham groups. Each circle represents a single sample subjected to 2D-SDS-PAGE.
3.4. Canonical Pathways Impacted by CSE
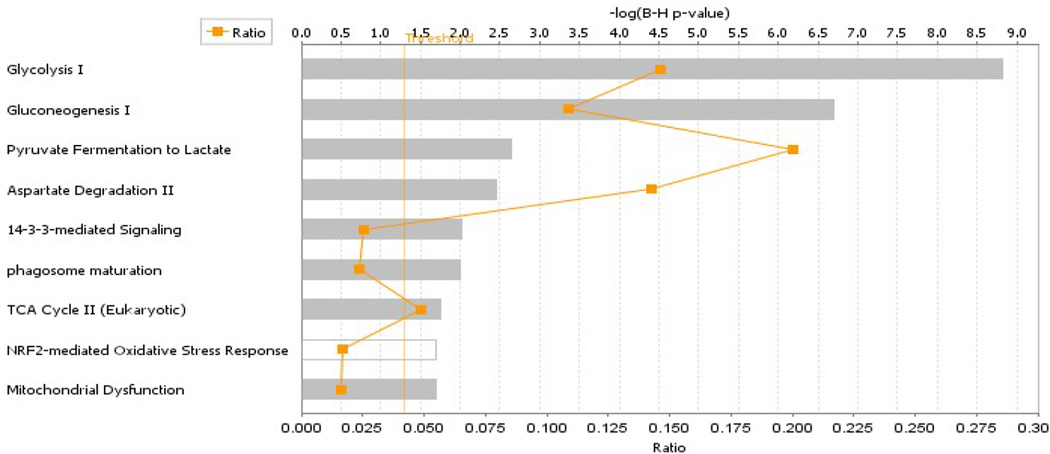
Thirty-four proteins of interest were identified by proteolytic digestion and ESI-MS/MS. These proteins represented all spots of sufficient intensity for clarity of boundaries and all spots that included p-values within 0.05. Identification of the remaining protein spots was not attempted although though they did not represent background noise. All of the 34 protein spots whose identification was attempted were identified unambiguously (see Table 1). Proteins with altered abundances in hippocampus of CSE mice when compared to that of Sham-exposed mice were grouped by membership in metabolic networks via IPA analysis. As shown in Figure 3, proteins with altered abundances in the hippocampus of adult mice previously developmentally exposed to cigarette smoke belonged to the Glycolysis I, Gluconeogenesis I, Pyruvate Fermentation to Lactate, Aspartate Degradation II, 14-3-3 mediated Signaling, Phagasome Maturation, TCS Cycle II, NRF2-mediated Oxidative Stress Response, and Mitochondrial Dysfunction pathways. Selected pathways are more fully described below.
Figure 3. The top nine ranked protein interaction networks and pathways impacted within the hippocampus of 6 month old offspring who were previously developmentally exposed to cigarette smoke.
The distance from the threshold value (vertical orange line) depicts the intensity of change between CSE and Sham groups.
3.4.1. Carbohydrate Metabolism Impacted by CSE
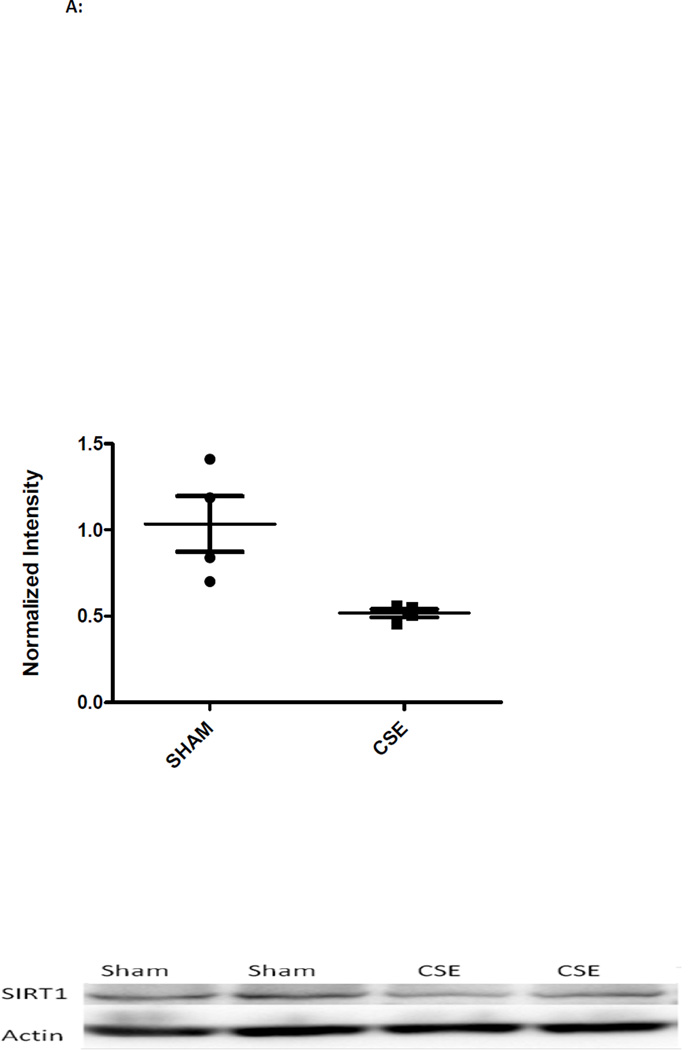
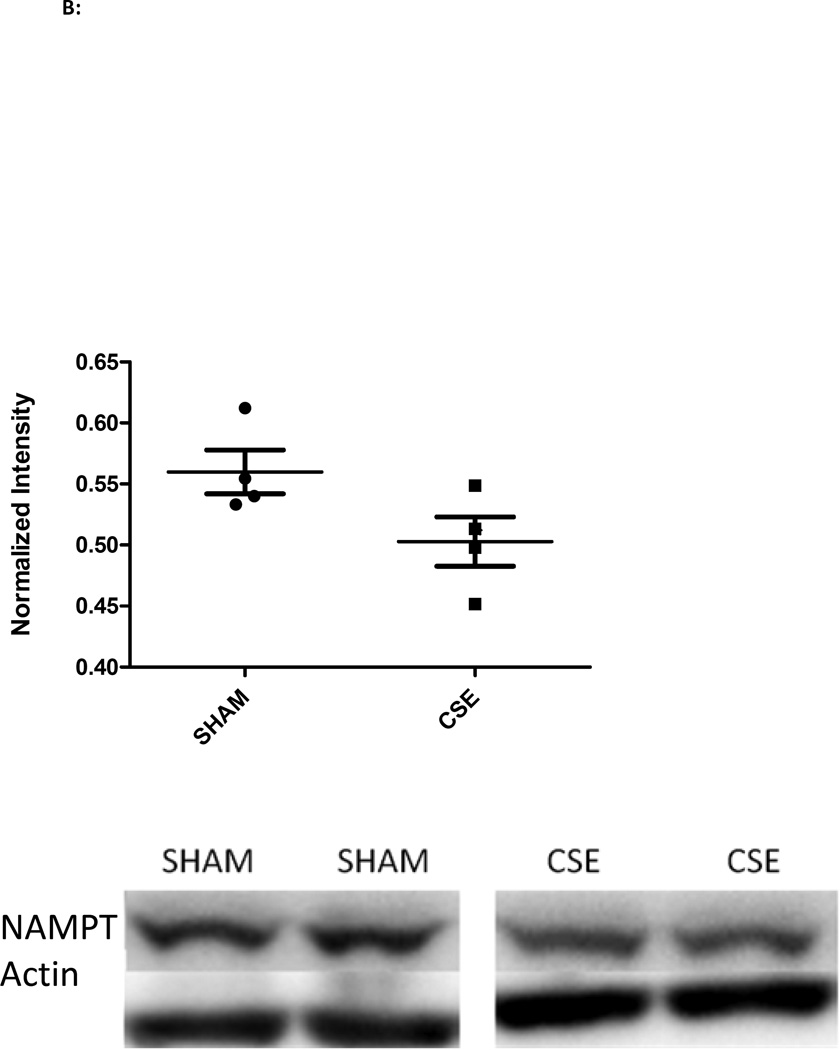
The abundances of a number of hippocampus proteins operative in the Glycolysis and Gluconeogenesis pathway (Figure 3) were impacted by developmental CSE: for the Glycolysis pathway (5/46 members or 10% coverage), enolase 1 (Spot 10; decreased), enolase 2 (Spot 17; increased 15%), bisphosphoglycerate mutase (Spot 28; increased 25%), phosphoglycerate kinase 1 (Spot 12; decreased 24%), pyruvate kinase (Spot 8; decreased 26%) and triosephosphate isomerase 1 (Spot 15; decreased 13%). The majority of proteins were decreased in abundance with only the brain specific forms of two glycolytic proteins, enolase and bisphosphoglycerate mutase, being increased. In concurrence with studies of depression, the prolonged stress of developmental exposure to cigarette smoke resulted in sustained suppression of Sirtuin 1 (SIRT1) and Nicotinamide phosphoribosyltransferase (NAMPT) expression (Figure 4) [76]. Suppression of SIRT1 expression, an NAD dependent deacetylase, stimulates glycolysis within liver, muscle, and adipose tissue though its impact on energy response pathways within the hippocampus has not been elucidated. A suppression of brain SIRT1 decreases food intake and metabolic rate of peripheral tissues [77]. NAMPT, a rate limiting NAD biosynthetic enzyme, and SIRT1, are coordinately regulated in response to cellular energy availability [78]. A decrease in SIRT1 accompanied by decreased NAMPT expression likely indicates an increase in acetylation of target proteins that control energetic processes.
Figure 4.
A: Western blot analysis of SIRT1 expression in whole hippocampus homogenates from 6 month old offspring previously exposed GD1-PD21 to cigarette smoke. Hippocampus homogenates from CSE offspring at age 6 months exhibited a decrease of approximately 50% in expression of the metabolic regulatory protein SIRT1 when compared to Sham exposed (*p<0.05; n=4 per group). Long horizontal lines indicate mean signal intensity, with the standard deviation represented by the shorter horizontal bars.
B: Western blot analysis of NAMPT expression in whole hippocampus homogenates from 6 month old offspring previously exposed GD1-PD21 to cigarette smoke. Hippocampus homogenates from CSE offspring at age 6 months exhibited a decrease of approximately 11% in expression of the metabolic regulatory protein NAMPT when compared to Sham exposed (p<0.07; n=4 per group). Long horizontal lines indicate mean signal intensity, with the standard deviation represented by the shorter horizontal bars.
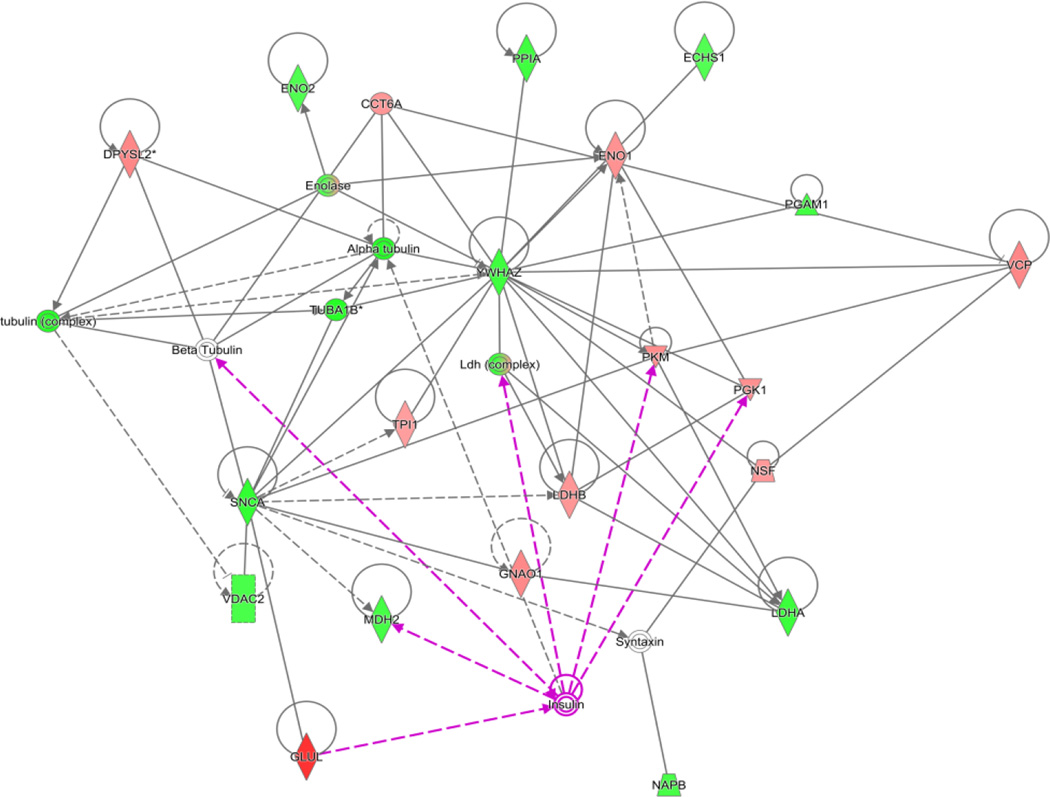
Within the Gluconeogenic pathway (6/41 members for a coverage of 15%), which does not occur to an appreciable extent within the brain, malate dehydrogenase 2 (Spot 24; increased 22%) transports pyruvate out of the mitochondria. As previously mentioned, reversible glycolytic enzymes were impacted in the hippocampus of juvenile offspring (PD21) exposed throughout development to cigarette smoke. As shown in Figure 5, the network of proteins in the adult (aged 6 months) hippocampus affected by developmental CSE included established insulin signaling pathways.
Figure 5. The carbohydrate metabolism pathway in the hippocampus of 6 month old offspring is impacted by previous developmental CSE.
As shown below, insulin signaling is a central node that regulates an abundance of metabolic proteins found to be altered in the hippocampus of offspring exposed throughout development to cigarette smoke.
3.4.2. Pyruvate Fermentation to Lactate Impacted by Developmental Exposure to Cigarette Smoke
Two out of 10 molecules within the Pyruvate Fermentation to Lactate pathway (20% coverage) exhibited mixed impact in CSE offspring. Altered abundances of lactate dehydrogenase B (Spot 14; decreased 20%) and lactate dehydrogenase A (Spot 23; increased 29%), two proteins that convert lactate to pyruvate while generating NADH also were detected in the adult (aged 6 months) hippocampus following exposure throughout the key period of neurodevelopment (GD1-PD21) to cigarette smoke.
3.4.3. 14-3-3 Mediated Signaling and Phagosome Maturation Pathways Impacted by Developmental Exposure to Cigarette Smoke
Synuclein alpha (Spot 32; increased 35%); tubulin (Spot 16 and 20; increased 26 and 40% respectively) and 14-3-3 zeta (Spot 27; increased 27%) influence neuronal maturation, are part of the 14-3-3-signaling network (3/115, 2.5% coverage), and are impacted CSE [79, 80]. NSF attachment protein beta (Spot 25, increased 21%), N-ethylmaleimide sensitive factor (Spot 3, decreased 34%), and alpha tubulin 1B (Spot 20, increased 40%) are part of the Phagosome Maturation Pathway (3/127/ 2.4% coverage) which mediates microglial dependent neuronal remodeling within neurodegeneration [81].
3.4.4. TCA Cycle II and NADH Synthesis/Hydrolysis and Mitochondrial Dysfunction: Impacted by Developmental CSE
Proteins involved in the metabolism of NADH were impacted within the CSE group. The Mitochondrial Dysfunction pathway (3/188, 1.6% coverage) included isocitrate dehydrogenase 3 (Spot 22, increased 47%) and malate dehydrogenase 2 (Spot 24, increased 22%) enzymes as increased in abundance in the CSE group likely indicating an increased synthesis of NADPH possibly through increased numbers of mitochondria. Additional proteins involved in ATP/NADH metabolism include: N-ethylmaleimide sensitive fusion protein (Spot 25; increased 21%) and murine valosin-containing protein (Spot 1; decreased 30%).
3.4.5. NRF2-mediated Oxidative Stress Response Proteins Impacted by Developmental CSE
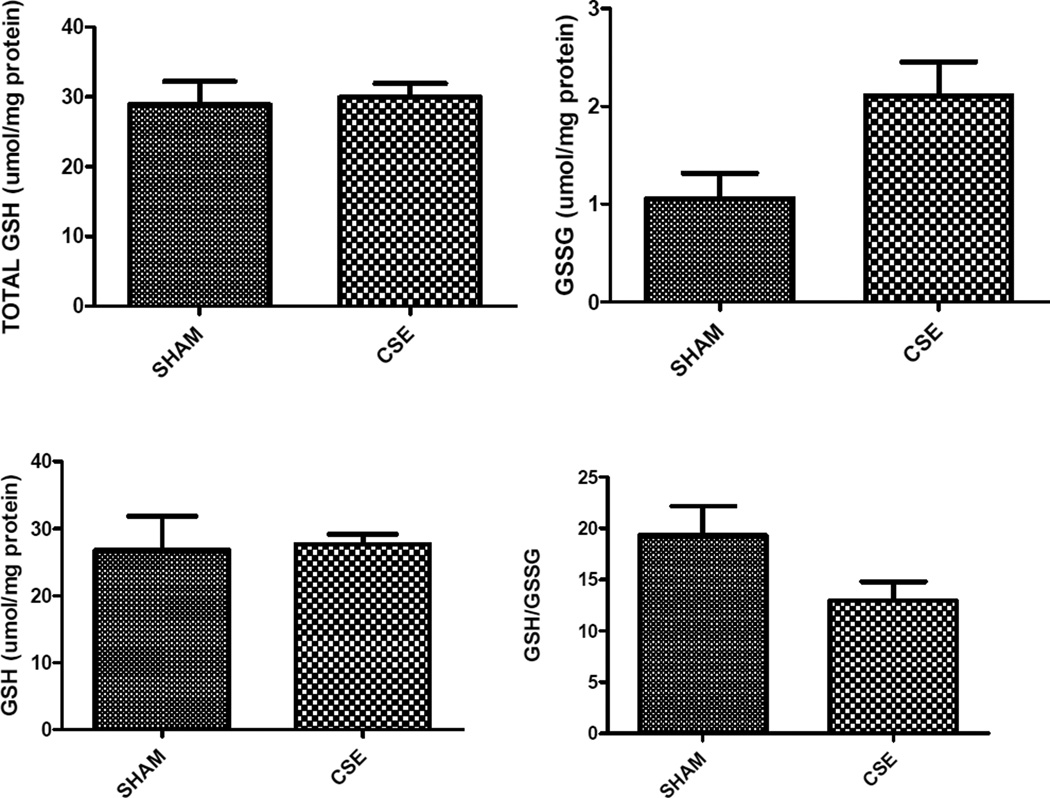
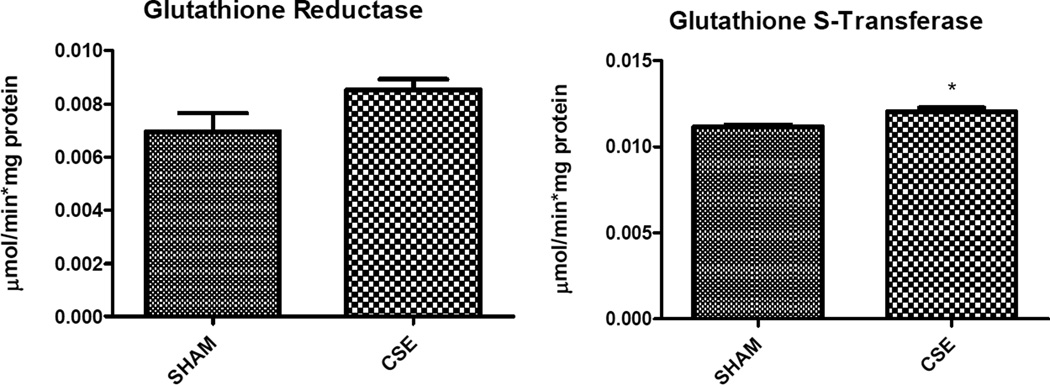
Abundances of three cellular oxidative stress responsive proteins including manganese superoxide dismutase (Spot 31; increased 20%), stress-induced phosphoprotein 1 (Spot 6; decreased 22%), and valosin containing protein (Spot 1, decreased 30%) were impacted within the CSE group for NRF2-mediated Oxidative Stress Response Pathway coverage of 3/180 or 1.7% coverage. Additional response proteins including peptidylprolyl isomerase A (Spot 34; increased 26%), and chaperonin containing TCP1 (Spot 7; decreased 19%) that were not part of the NRF2 pathway were altered in the adult aged 6 months hippocampus by developmental cigarette smoke exposure. Total glutathione (GSH + 2GSSG), reduced glutathione (GSH), oxidized glutathione (GSSG), the ratio of GSH/GSSG, and the specific activities of glutathione reductase and glutathione-S-transferase were assayed. An increase in glutathione-S-transferase was detected (p<0.05), while a trend towards increased glutathione reductase activity, increased GSSG, and decreased GSH/GSSG ratio were also noted (p≤0.10) (Figure 6).
Figure 6. Glutathione levels in hippocampus of 6 month old offspring that were Sham exposed or exposed to cigarette smoke on GD1-PD21.
Developmental CSE reduces hippocampus glutathione levels at maturity. A trend toward increased oxidized glutathione (GSSG, p=0.09) and impairment of the ratio of reduced to oxidized glutathione (GSH/GSSG; *p=0.10) in the hippocampus at maturity in offspring developmentally exposed to cigarette smoke, without an impact on the overall total glutathione pool (n=3 per group). The specific activity of glutathione-S-transferase was increased in the CSE group (*p=0.03) while a trend toward stimulation of glutathione reductase activity also was noted (*p=0.10).
3.5. Metabolome Partial Least Squares-Discriminant Analysis
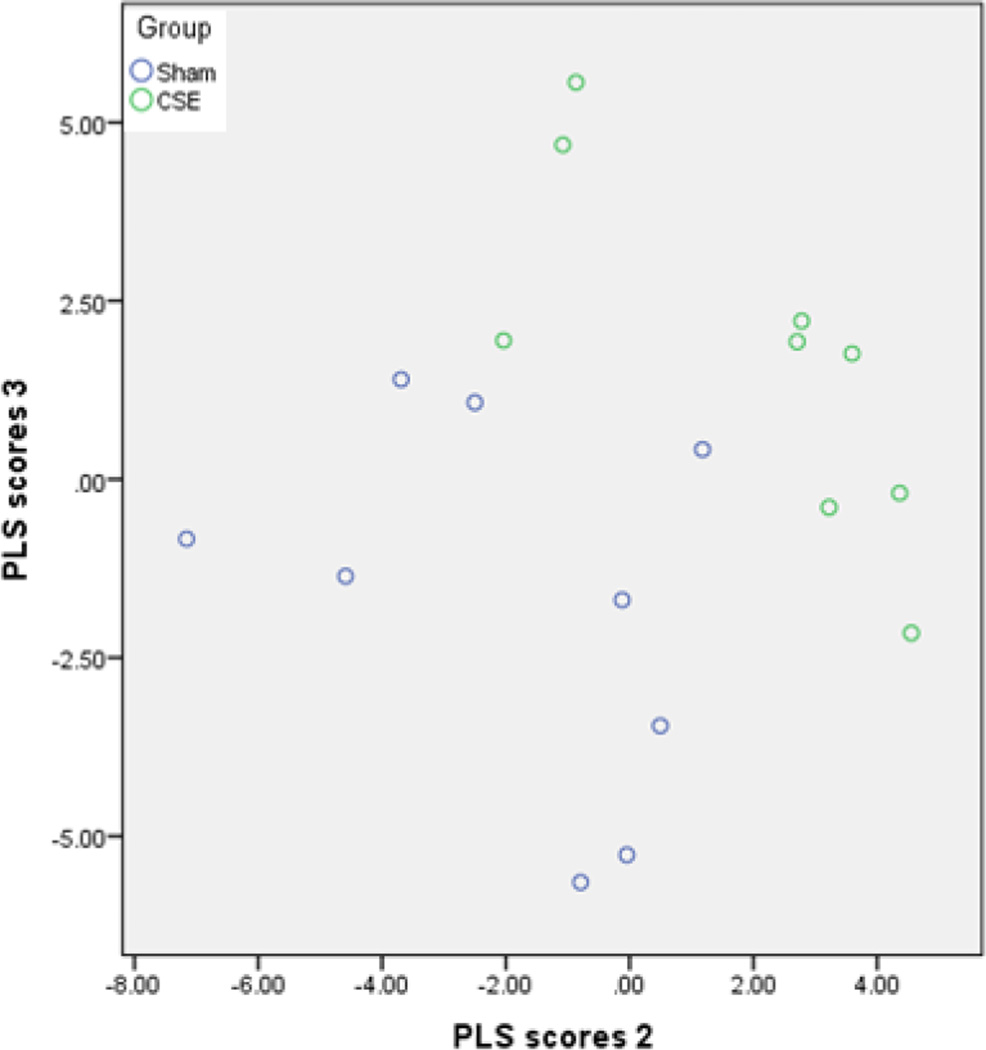
Partial Least Squares-Discriminant Analysis (PLS-DA) is a supervised clustering methodology that is used to identify features of interest within complex multidimensional datasets. The total number of spectral features was 1264 which included all aligned m/z including isotope variants which were removed from the final 573 components for PLS-DA. As such, to describe the separation between the Sham and CSE groups, three latent factors (also known as vectors) explained a total variance of 81% of the separation between the groups. The first latent factor explained 12.9% of variance while the second and third latent factors explained 36.9% and 34.1% of the variance between the Sham and CSE groups respectively. When the second and third latent factors representing over 70% of the variance between groups are plotted, the separation between groups is evident (Figure 7). The data set includes few new m/z features indicating that the differences in metabolite profiles are dominated by normalized intensity differences.
Figure 7. Plotting the second and third vectors within the PLS-DA model visualizes the variance of 6 month old offspring hippocampus metabolome profiles between developmental CSE and Sham groups.
Each circle represents an averaged value of a single hippocampus dichloromethane extract (duplicate analyses) that was subjected to FT-ICR-MS for metabolite profiling.
3.6. Hippocampus Metabolome Features of Interest Impacted by Developmental CSE
The current study utilized a non-targeted metabolomics workflow to examine whether exposure to cigarette smoke throughout neurodevelopment (GD1-PD21) induced persistent alterations in hippocampus lipid species. In Figures 8 and 9, plots visualizing the differences in normalized intensity values are shown for the 28 m/z features of interest found to be significantly altered in the CSE group hippocampus. The features of interest are ordered according to increased and decreased intensities. Tentative identification of 19 of these features of interest based on accurate mass and isotopic abundance agreement with predicted values are listed in Table 2. A clear effect of developmental CSE on glycerolipid containing metabolites in the adult hippocampus aged 6 months was found.
4. DISCUSSION
The present study assessed the impact of developmental CSE on the biomolecular phenotype of the 6 month old adult murine hippocampus – 5 month post cessation of exposure – a time at which these offspring exhibit neurobehavioral alterations including subnormal anxiety in a novel environment and impaired spatial learning and reference memory [50]. The model system includes inhalation exposure of an inbred mouse strain and spans a period throughout gestation and the critical postnatal period of murine neurodevelopment (GD1-PD21) that is functionally equivalent to hippocampal development achieved by the end of the third-trimester in humans. The current study is the culmination of multiple investigations into the systems biology impact of cigarette smoke on the biomolecular phenotype of the three main glucose metabolic tissues – the brain, liver, and kidney [52–54].
In our prior studies examining the impact of developmental cigarette smoke on systemic glucose availability at the cessation of exposure in (PD21) animals, we found suppressed gluconeogenic activity in the liver with an ~13% decrease in fed state blood glucose levels at weaning [53] coupled to suppression of the glycolysis pathway within the hippocampus [52]. In the current report concerning the impact of developmental cigarette smoke exposure in adult animals aged 6 months we conclude that a generalized decrease in glycolysis is present within the hippocampus of offspring exposed throughout the critical period of neurodevelopment to cigarette smoke. The expression level of the key regulatory enzyme pyruvate kinase, as well as several reversible enzymes mediating both glycolysis and gluconeogenesis, was decreased by 26%. The brain is heavily dependent on external glucose availability. In light of a ~15% decrease in fed-state serum glucose levels in the CSE offspring at maturity (data not shown) [55], we propose that an attempt to stimulate energetic precursor availability occurs. It is possible that insulin responsiveness is decreased in these offspring since glycolytic proteins are negatively impacted.
Proteins involved in ATP synthesis/hydrolysis exhibited decreased abundances in the proteome profile of the hippocampus of offspring (at age 6 months) who had undergone prior exposure to cigarette smoke from GD1-PD2.1. The generalized decrease in glycolytic/gluconeogenic enzymes limits ATP synthesis and would necessarily result in pyruvate to lactate conversion to support energetic precursor production. The mixed impact on lactate dehydrogenase isoforms likely reflects the more specialized function of lactate dehydrogenase A in support of anaerobic glycolysis, though enzymatic activities were not measured within these pathways. Coupled with the impact on glucose availability, these findings indicate that in adult animals at a time 5 months past the initial insult, CSE (GD1-PD21) impacts hippocampus energy supply pathways. In the prior study examining the impact of developmental cigarette smoke exposure on the hippocampus proteome of weanling (juvenile; PD21) animals, a mixed impact on proteins participating in oxidative phosphorylation was noted; a sustained impact on this pathway was not observed in adult animals aged 6 months.
Cytoskeletal organization supports cell morphology, migration, and tissue repair. In the current study, numerous tubulin protein spots were found to be increased in abundance though the dominant tubulin spot was not impacted. This likely indicates alterations in post-translational modifications and cleavage products of a key neuronal cytoskeletal protein. Membrane fluidity is influenced by the composition of the lipid species within the bilayer: both glycero- and sphingolipids were altered in the hippocampus of adult offspring at 6 months following exposure to cigarette smoke that spanned pre-/post-natal development (GD1-PD21). Three of the lipid mass features of interest (m/z=478.2663, 732.6154, and 763.6104) were impacted in both weaning juvenile (PD21) and adult (6 months of age) animals, though the directionality of impact was reversed. These data suggest that hippocampus cell morphology and membrane fluidity remain altered well after the cessation of exposure to cigarette smoke though compositional changes in membrane lipids are variable across time.
Our prior study documented oxidative stress in the hippocampus of juvenile (PD21) offspring at weaning that were previously exposed throughout development and the critical postnatal period of neurodevelopment to cigarette smoke. Herein, we report a suppression of chaperoning/stress response proteins in the adult hippocampus at age 6 months from identically exposed animals that was coupled to an increase in one form of superoxide dismutase and an impact on the NRF2 mediated oxidative stress response pathway. Similar findings of sustained oxidative stress were noted in offspring experiencing restraint stress during pregnancy [82], [83, 84], prenatal hypoxia [85, 86], heavy metal exposure [87, 88], and malnutrition [89–91]. Though a trend toward impaired GSH/GSSG ratio and antioxidant enzyme activities within the hippocampus of adult offspring with prior CSE was evident, the cerebral cortex of offspring with prior CSE did exhibit a loss of total glutathione. Together, these findings indicate an ongoing (from pre-/postnatal exposure into adulthood) hypo-responsiveness of the stress response pathways as well as oxidative stress within the brain of the offspring developmentally exposed to cigarette smoke.
In summary, the current study examined the impact of developmental CSE spanning GD1 through PD21 on the global proteome and metabolome profiles of hippocampus tissue at adulthood, roughly 5 months past the cessation of exposure in juveniles (PD21). Developmental CSE-induced systemic glucose availability was compromised in the hippocampus at the time of CSE cessation and remained so into adulthood in offspring aged 6 months. In concert, hippocampus energetic pathways were compromised at the cessation of exposure at PD21 as well as in the adult offspring at maturity at age 6 months. In conjunction with our other studies of the impact of developmental CSE on the kidney and liver proteome profiles in adult animals at maturity [55, 56], as well as the prior studies of the impact of developmental CSE in juveniles (PD21) animals at cessation of exposure [52–54], we propose that ongoing suppression of glucose availability is insufficient to support the normal level of energetic processes within the hippocampus into adulthood. We further propose that the deficits in memory and behavior observed in these identical offspring following extensive behavioral phenotyping [50] reflect energetic precursor scarcity in the hippocampus.
The current study does not differentiate impact based on single components of cigarette smoke such as heavy metals, combustion products, or particulate matter. The model described herein is unique in that the most commonly smoked cigarette by pregnant women, Marlboro Reds™, was utilized for inhalation exposure of the animals (dams/pups) without restraint stress, but with exposure to the complexity of tobacco smoke as experienced in human maternal smoking during pregnancy. Future studies will include the examination of 'passive' smoke exposure spanning the entirety of gestation and through human third trimester equivalent hippocampal development (GD1-PD21) as well as the impact of alternative nicotine delivery systems such as hooka and e-cigarettes to identify if method of maternal consumption influences child health outcomes.
Highlights.
Developmental CSE alters proteome and metabolome in adult offspring.
Glycolysis is suppressed in hippocampus of CSE offspring.
Impairment of systemic glucose availability and carbohydrate metabolism.
Limited energetic pathway activity may limit capacity for learning and memory.
Acknowledgments
Research described in this article was supported in part by PHS grants NIH P20 RR/DE-17702, NIH R21 DA027466 and by the University of Louisville CREAM Center from NSF EPSCoR grant EPS-0447479 (MS).
Footnotes
Publisher's Disclaimer: This is a PDF file of an unedited manuscript that has been accepted for publication. As a service to our customers we are providing this early version of the manuscript. The manuscript will undergo copyediting, typesetting, and review of the resulting proof before it is published in its final citable form. Please note that during the production process errors may be discovered which could affect the content, and all legal disclaimers that apply to the journal pertain.
LITERATURE CITED
- 1.CDC. Women and smoking. Surgeon General's Report. U.S. Department of Health and Human Services Coordinating Center for Health Promotion National Center for Chronic Disease Prevention and Health Promotion Office of Smoking and Health. 2001 [Google Scholar]
- 2.Borgerding M, Klus H. Analysis of complex mixtures--cigarette smoke. Exp Toxicol Pathol. 2005;57(Suppl 1):43–73. doi: 10.1016/j.etp.2005.05.010. [DOI] [PubMed] [Google Scholar]
- 3.Rodgman A, Perfetti TA. The Chemical Components of Tobacco and Tobacco Smoke. 2nd. Boca Rattan, FL: CRC Press; 2013. Summary; pp. 1471–1474. [Google Scholar]
- 4.Health. NCfCDPaHPUOoSa. The Health Consequences of Smoking—50 Years of Progress: A Report of the Surgeon General. Reports of the Surgeon General. 2014 [Google Scholar]
- 5.Abel EL. Smoking during pregnancy: a review of effects on growth and development of offspring. Hum Biol. 1980;52:593–625. [PubMed] [Google Scholar]
- 6.Cooke RW. Smoking, intra-uterine growth retardation and sudden infant death syndrome. Int J Epidemiol. 1998;27:238–241. doi: 10.1093/ije/27.2.238. [DOI] [PubMed] [Google Scholar]
- 7.Mitchell EA, Thompson JM, Robinson E, Wild CJ, Becroft DM, Clark PM, et al. Smoking, nicotine and tar and risk of small for gestational age babies. Acta Paediatr. 2002;91:323–328. doi: 10.1080/08035250252834003. [DOI] [PubMed] [Google Scholar]
- 8.Fried PA, Makin JE. Neonatal behavioural correlates of prenatal exposure to marihuana, cigarettes and alcohol in a low risk population. Neurotoxicol Teratol. 1987;9:1–7. doi: 10.1016/0892-0362(87)90062-6. [DOI] [PubMed] [Google Scholar]
- 9.Slotkin TA, Pinkerton KE, Auman JT, Qiao D, Seidler FJ. Perinatal exposure to environmental tobacco smoke upregulates nicotinic cholinergic receptors in monkey brain. Brain Res Dev Brain Res. 2002;133:175–179. doi: 10.1016/s0165-3806(02)00281-x. [DOI] [PubMed] [Google Scholar]
- 10.Roy TS, Seidler FJ, Slotkin TA. Prenatal nicotine exposure evokes alterations of cell structure in hippocampus and somatosensory cortex. J Pharmacol Exp Ther. 2002;300:124–133. doi: 10.1124/jpet.300.1.124. [DOI] [PubMed] [Google Scholar]
- 11.Batstra L, Hadders-Algra M, Neeleman J. Effect of antenatal exposure to maternal smoking on behavioural problems and academic achievement in childhood: prospective evidence from a Dutch birth cohort. Early Hum Dev. 2003;75:21–33. doi: 10.1016/j.earlhumdev.2003.09.001. [DOI] [PubMed] [Google Scholar]
- 12.Sexton M, Fox NL, Hebel JR. Prenatal exposure to tobacco: II. Effects on cognitive functioning at age three. Int J Epidemiol. 1990;19:72–77. doi: 10.1093/ije/19.1.72. [DOI] [PubMed] [Google Scholar]
- 13.McCartney JS, Fried PA, Watkinson B. Central auditory processing in school-age children prenatally exposed to cigarette smoke. Neurotoxicol Teratol. 1994;16:269–276. doi: 10.1016/0892-0362(94)90048-5. [DOI] [PubMed] [Google Scholar]
- 14.Fried PA, Watkinson B. Visuoperceptual functioning differs in 9- to 12-year olds prenatally exposed to cigarettes and marihuana. Neurotoxicol Teratol. 2000;22:11–20. doi: 10.1016/s0892-0362(99)00046-x. [DOI] [PubMed] [Google Scholar]
- 15.Butler NR, Goldstein H. Smoking in pregnancy and subsequent child development. Br Med J. 1973;4:573–575. doi: 10.1136/bmj.4.5892.573. [DOI] [PMC free article] [PubMed] [Google Scholar]
- 16.Olds DL, Henderson CR, Jr, Tatelbaum R. Intellectual impairment in children of women who smoke cigarettes during pregnancy. Pediatrics. 1994;93:221–227. [PubMed] [Google Scholar]
- 17.Olds DL, Henderson CR, Jr, Tatelbaum R. Prevention of intellectual impairment in children of women who smoke cigarettes during pregnancy. Pediatrics. 1994;93:228–233. [PubMed] [Google Scholar]
- 18.Olds DL, Henderson CR, Tatelbaum R. Intellectual Impairment in Children of Women Who Smoke Cigarettes during Pregnancy. Pediatrics. 1994;93:221–227. [PubMed] [Google Scholar]
- 19.Butler NR, Goldstei H. Smoking in Pregnancy and Subsequent Child Development. Br Med J. 1973;4:573–575. doi: 10.1136/bmj.4.5892.573. [DOI] [PMC free article] [PubMed] [Google Scholar]
- 20.Romijn HJ, Hofman MA, Gramsbergen A. At what age is the developing cerebral cortex of the rat comparable to that of the full-term newborn human baby? Early Hum Dev. 1991;26:61–67. doi: 10.1016/0378-3782(91)90044-4. [DOI] [PubMed] [Google Scholar]
- 21.Olton DS, Feustle WA. Hippocampal function required for nonspatial working memory. Exp Brain Res. 1981;41:380–389. doi: 10.1007/BF00238896. [DOI] [PubMed] [Google Scholar]
- 22.Olton DS, Papas BC. Spatial memory and hippocampal function. Neuropsychologia. 1979;17:669–682. doi: 10.1016/0028-3932(79)90042-3. [DOI] [PubMed] [Google Scholar]
- 23.Nishitani N, Ikeda A, Nagamine T, Honda M, Mikuni N, Taki W, et al. The role of the hippocampus in auditory processing studied by event-related electric potentials and magnetic fields in epilepsy patients before and after temporal lobectomy. Brain. 1999;122(Pt 4):687–707. doi: 10.1093/brain/122.4.687. [DOI] [PubMed] [Google Scholar]
- 24.Nishitani N, Nagamine T, Fujiwara N, Yazawa S, Shibasaki H. Cortical-hippocampal auditory processing identified by magnetoencephalography. J Cogn Neurosci. 1998;10:231–247. doi: 10.1162/089892998562672. [DOI] [PubMed] [Google Scholar]
- 25.Nishitani N. Dynamics of cognitive processing in the human hippocampus by neuromagnetic and neurochemical assessments. Neuroimage. 2003;20:561–571. doi: 10.1016/s1053-8119(03)00280-5. [DOI] [PubMed] [Google Scholar]
- 26.d'Hellencourt CL, Harry GJ. Molecular profiles of mRNA levels in laser capture microdissected murine hippocampal regions differentially responsive to TMT-induced cell death. Journal of Neurochemistry. 2005;93:206–220. doi: 10.1111/j.1471-4159.2004.03017.x. [DOI] [PubMed] [Google Scholar]
- 27.Eichenbaum H. The hippocampus and mechanisms of declarative memory. Behavioural Brain Research. 1999;103:123–133. doi: 10.1016/s0166-4328(99)00044-3. [DOI] [PubMed] [Google Scholar]
- 28.Shapiro ML, Eichenbaum H. Hippocampus as a memory map: Synaptic plasticity and memory encoding by hippocampal neurons. Hippocampus. 1999;9:365–384. doi: 10.1002/(SICI)1098-1063(1999)9:4<365::AID-HIPO4>3.0.CO;2-T. [DOI] [PubMed] [Google Scholar]
- 29.Eichenbaum H. Hippocampus: Cognitive processes and neural representations that underlie declarative memory. Neuron. 2004;44:109–120. doi: 10.1016/j.neuron.2004.08.028. [DOI] [PubMed] [Google Scholar]
- 30.Fortin NJ, Wright SP, Eichenbaum H. Recollection-like memory retrieval in rats is dependent on the hippocampus. Nature. 2004;431:188–191. doi: 10.1038/nature02853. [DOI] [PMC free article] [PubMed] [Google Scholar]
- 31.Eichenbaum H. An Information Processing Framework for Memory Representation by the Hippocampus. Cognitive Neurosciences Iii, Third Edition. 2004:679–690. [Google Scholar]
- 32.Hammond RS, Tull LE, Stackman RW. On the delay-dependent involvement of the hippocampus in object recognition memory. Neurobiol Learn Mem. 2004;82:26–34. doi: 10.1016/j.nlm.2004.03.005. [DOI] [PubMed] [Google Scholar]
- 33.Levenson JM, Sweatt JD. Epigenetic mechanisms in memory formation. Nat Rev Neurosci. 2005;6:108–118. doi: 10.1038/nrn1604. [DOI] [PubMed] [Google Scholar]
- 34.Sweatt JD. Hippocampal function in cognition. Psychopharmacology. 2004;174:99–110. doi: 10.1007/s00213-004-1795-9. [DOI] [PubMed] [Google Scholar]
- 35.Whishaw IQ, Jarrard LE. Evidence for extrahippocampal involvement in place learning and hippocampal involvement in path integration. Hippocampus. 1996;6:513–524. doi: 10.1002/(SICI)1098-1063(1996)6:5<513::AID-HIPO4>3.0.CO;2-J. [DOI] [PubMed] [Google Scholar]
- 36.Yamaguchi S, Hale LA, D'Esposito M, Knight RT. Rapid prefrontal-hippocampal habituation to novel events. Journal of Neuroscience. 2004;24:5356–5363. doi: 10.1523/JNEUROSCI.4587-03.2004. [DOI] [PMC free article] [PubMed] [Google Scholar]
- 37.Slikker W, Xu ZA, Levin ED, Slotkin TA. Mode of action: Disruption of brain cell replication, second messenger, and neurotransmitter systems during development leading to cognitive dysfunction - Developmental neurotoxicity of nicotine. Critical Reviews in Toxicology. 2005;35:703–711. doi: 10.1080/10408440591007421. [DOI] [PubMed] [Google Scholar]
- 38.Trauth JA, Seidler FJ, Ali SF, Slotkin TA. Adolescent nicotine exposure produces immediate and long-term changes in CNS noradrenergic and dopaminergic function. Brain Research. 2001;892:269–280. doi: 10.1016/s0006-8993(00)03227-3. [DOI] [PubMed] [Google Scholar]
- 39.Trauth JA, Seidler FJ, McCook EC, Slotkin TA. Adolescent nicotine exposure causes persistent upregulation of nicotinic cholinergic receptors in rat brain regions. Brain Research. 1999;851:9–19. doi: 10.1016/s0006-8993(99)01994-0. [DOI] [PubMed] [Google Scholar]
- 40.Vandekamp JL, Collins AC. Prenatal Nicotine Alters Nicotinic Receptor Development in the Mouse-Brain. Pharmacol Biochem Be. 1994;47:889–900. doi: 10.1016/0091-3057(94)90293-3. [DOI] [PubMed] [Google Scholar]
- 41.Li SP, Park MS, Bahk JY, Kim MO. Chronic nicotine and smoking exposure decreases GABA(B1) receptor expression in the rat hippocampus. Neuroscience Letters. 2002;334:135–139. doi: 10.1016/s0304-3940(02)01065-0. [DOI] [PubMed] [Google Scholar]
- 42.Roy TS, Andrews JE, Seidler FJ, Slotkin TA. Nicotine evokes cell death in embryonic rat brain during neurulation. Journal of Pharmacology and Experimental Therapeutics. 1998;287:1136–1144. [PubMed] [Google Scholar]
- 43.Roy TS, Sabherwal U. Effects of gestational nicotine exposure on hippocampal morphology. Neurotoxicology and Teratology. 1998;20:465–473. doi: 10.1016/s0892-0362(97)00137-2. [DOI] [PubMed] [Google Scholar]
- 44.Jang MH, Shin MC, Jung SB, Lee TH, Bahn GH, Kwon YK, et al. Alcohol and nicotine reduce cell proliferation and enhance apoptosis in dentate gyrus. Neuroreport. 2002;13:1509–1513. doi: 10.1097/00001756-200208270-00004. [DOI] [PubMed] [Google Scholar]
- 45.Gospe SM, Zhou SS, Pinkerton KE. Effects of environmental tobacco smoke exposure in utero and/or postnatally on brain development. Pediatric Research. 1996;39:494–498. doi: 10.1203/00006450-199603000-00018. [DOI] [PubMed] [Google Scholar]
- 46.Oliveira-da-Silva A, Vieira FB, Cristina-Rodrigues F, Filgueiras CC, Manhaes AC, Abreu-Villaca Y. Increased apoptosis and reduced neuronal and glial densities in the hippocampus due to nicotine and ethanol exposure in adolescent mice. Int J Dev Neurosci. 2009;27:539–548. doi: 10.1016/j.ijdevneu.2009.06.009. [DOI] [PubMed] [Google Scholar]
- 47.Roy TS, Seidler FJ, Slotkin TA. Prenatal nicotine exposure evokes alterations of cell structure in hippocampus and somatosensory cortex. Journal of Pharmacology and Experimental Therapeutics. 2002;300:124–133. doi: 10.1124/jpet.300.1.124. [DOI] [PubMed] [Google Scholar]
- 48.Slawecki CJ, Thomas JD, Riley EP, Ehlers CL. Neonatal nicotine exposure alters hippocampal EEG and event-related potentials (ERPs) in rats. Pharmacol Biochem Be. 2000;65:711–718. doi: 10.1016/s0091-3057(99)00258-0. [DOI] [PubMed] [Google Scholar]
- 49.Slawecki CJ, Ehlers CL. Lasting effects of adolescent nicotine exposure on the electroencephalogram, event related potentials, and locomotor activity in the rat. Dev Brain Res. 2002;138:15–25. doi: 10.1016/s0165-3806(02)00455-8. [DOI] [PubMed] [Google Scholar]
- 50.Amos-Kroohs RM, Williams MT, Braun AA, Graham DL, Webb CL, Birtles TS, et al. Neurobehavioral phenotype of C57BL/6J mice prenatally and neonatally exposed to cigarette smoke. Neurotoxicol Teratol. 2013;35:34–45. doi: 10.1016/j.ntt.2013.01.001. [DOI] [PMC free article] [PubMed] [Google Scholar]
- 51.Esposito ER, Horn KH, Greene RM, Pisano MM. An animal model of cigarette smoke-induced in utero growth retardation. Toxicology. 2008;246:193–202. doi: 10.1016/j.tox.2008.01.014. [DOI] [PMC free article] [PubMed] [Google Scholar]
- 52.Neal RE, Chen J, Jagadapillai R, Jang H, Abomoelak B, Brock G, et al. Developmental cigarette smoke exposure: hippocampus proteome and metabolome profiles in low birth weight pups. Toxicology. 2014;317:40–49. doi: 10.1016/j.tox.2014.01.006. [DOI] [PMC free article] [PubMed] [Google Scholar]
- 53.Canales L, Chen J, Kelty E, Musah S, Webb C, Pisano MM, et al. Developmental cigarette smoke exposure: liver proteome profile alterations in low birth weight pups. Toxicology. 2012;300:1–11. doi: 10.1016/j.tox.2012.04.016. [DOI] [PMC free article] [PubMed] [Google Scholar]
- 54.Jagadapillai R, Chen J, Canales L, Birtles T, Pisano MM, Neal RE. Developmental cigarette smoke exposure: kidney proteome profile alterations in low birth weight pups. Toxicology. 2012;299:80–89. doi: 10.1016/j.tox.2012.04.015. [DOI] [PMC free article] [PubMed] [Google Scholar]
- 55.Neal RE, Chen J, Stocke K, Webb C, Gambrell C, Greene RM, Pisano MM. Developmental Cigarette Smoke Exposure II: Hepatic Proteome Profiles in Adult Offspring. Reprod Toxicol. 2016;x:x. doi: 10.1016/j.reprotox.2016.06.009. [DOI] [PMC free article] [PubMed] [Google Scholar]
- 56.Neal R, Jagadapillai R, Chen J, Stocke K, Gambrell C, Greene RM, Pisano MM. Developmental Cigarette Smoke Exposure II: Kidney Proteome Profile Alterations in Adult Offspring. Reprod Toxicol. 2016;X:X. doi: 10.1016/j.reprotox.2016.05.008. [DOI] [PMC free article] [PubMed] [Google Scholar]
- 57.Teague SV, Pinkerton KE, Goldsmith M, Gebremichael A, Chang S, Jenkins RA, Moneyhun JH. Sidestream cigarette smoke generation and exposure system for environmental tobacco smoke studies. Inhalation Toxicology. 1994;6:79–93. [Google Scholar]
- 58.CDC. Incidence of initiation of cigarette smoking--United States, 1965–1996. MMWR Morb Mortal Wkly Rep. 1998;47:837–840. [PubMed] [Google Scholar]
- 59.Husten CG, Chrismon JH, Reddy MN. Trends and effects of cigarette smoking among girls and women in the United States, 1965–1993. J Am Med Womens Assoc. 1996;51:11–18. [PubMed] [Google Scholar]
- 60.Nelson DE, Giovino GA, Shopland DR, Mowery PD, Mills SL, Eriksen MP. Trends in cigarette smoking among US adolescents, 1974 through 1991. Am J Public Health. 1995;85:34–40. doi: 10.2105/ajph.85.1.34. [DOI] [PMC free article] [PubMed] [Google Scholar]
- 61.CDC. Comparison of the cigarette brand preferences of adult and teenaged smokers--United States, 1989, and 10 U.S. communities, 1988 and 1990. MMWR Morb Mortal Wkly Rep. 1992;41:169–173. 79–81. [PubMed] [Google Scholar]
- 62.Seccareccia F, Zuccaro P, Pacifici R, Meli P, Pannozzo F, Freeman KM, et al. Serum cotinine as a marker of environmental tobacco smoke exposure in epidemiological studies: the experience of the MATISS project. Eur J Epidemiol. 2003;18:487–492. doi: 10.1023/a:1024672522802. [DOI] [PubMed] [Google Scholar]
- 63.Pichini S, Basagana XB, Pacifici R, Garcia O, Puig C, Vall O, et al. Cord serum cotinine as a biomarker of fetal exposure to cigarette smoke at the end of pregnancy. Environ Health Perspect. 2000;108:1079–1083. doi: 10.1289/ehp.001081079. [DOI] [PMC free article] [PubMed] [Google Scholar]
- 64.Scherer G, Richter E. Biomonitoring exposure to environmental tobacco smoke (ETS): a critical reappraisal. Hum Exp Toxicol. 1997;16:449–459. doi: 10.1177/096032719701600806. [DOI] [PubMed] [Google Scholar]
- 65.Granella M, Priante E, Nardini B, Bono R, Clonfero E. Excretion of mutagens, nicotine and its metabolites in urine of cigarette smokers. Mutagenesis. 1996;11:207–211. doi: 10.1093/mutage/11.2.207. [DOI] [PubMed] [Google Scholar]
- 66.Bradford MM. A rapid and sensitive method for the quantitation of microgram quantities of protein utilizing the principle of protein-dye binding. Anal Biochem. 1976;72:248–254. doi: 10.1016/0003-2697(76)90527-3. [DOI] [PubMed] [Google Scholar]
- 67.Karp NA, Griffin JL, Lilley KS. Application of partial least squares discriminant analysis to two-dimensional difference gel studies in expression proteomics. Proteomics. 2005;5:81–90. doi: 10.1002/pmic.200400881. [DOI] [PubMed] [Google Scholar]
- 68.Kuhn M. Building Predictive Models in R Using the caret Package. J Stat Softw. 2008;28:1–26. [Google Scholar]
- 69.Xia J, Mandal R, Sinelnikov IV, Broadhurst D, Wishart DS. MetaboAnalyst 2.0--a comprehensive server for metabolomic data analysis. Nucleic Acids Res. 2012;40:W127–W133. doi: 10.1093/nar/gks374. [DOI] [PMC free article] [PubMed] [Google Scholar]
- 70.Baker MA, Cerniglia GJ, Zaman A. Microtiter plate assay for the measurement of glutathione and glutathione disulfide in large numbers of biological samples. Anal Biochem. 1990;190:360–365. doi: 10.1016/0003-2697(90)90208-q. [DOI] [PubMed] [Google Scholar]
- 71.Tietze F. Enzymic method for quantitative determination of nanogram amounts of total and oxidized glutathione: applications to mammalian blood and other tissues. Anal Biochem. 1969;27:502–522. doi: 10.1016/0003-2697(69)90064-5. [DOI] [PubMed] [Google Scholar]
- 72.Boyland E, Chasseaud LF. Glutathione S-aralkyltransferase. Biochem J. 1969;115:985–991. doi: 10.1042/bj1150985. [DOI] [PMC free article] [PubMed] [Google Scholar]
- 73.Jakoby WB. The glutathione S-transferases: a group of multifunctional detoxification proteins. Adv Enzymol Relat Areas Mol Biol. 1978;46:383–414. doi: 10.1002/9780470122914.ch6. [DOI] [PubMed] [Google Scholar]
- 74.Staal GE, Visser J, Veeger C. Purification and properties of glutathione reductase of human erythrocytes. Biochim Biophys Acta. 1969;185:39–48. doi: 10.1016/0005-2744(69)90280-0. [DOI] [PubMed] [Google Scholar]
- 75.Gershoni JM. Protein blotting: a manual. Methods Biochem Anal. 1988;33:1–58. doi: 10.1002/9780470110546.ch1. [DOI] [PubMed] [Google Scholar]
- 76.Abe-Higuchi N, Uchida S, Yamagata H, Higuchi F, Hobara T, Hara K, et al. Hippocampal Sirtuin 1 Signaling Mediates Depression-like Behavior. Biol Psychiatry. 2016 doi: 10.1016/j.biopsych.2016.01.009. [DOI] [PubMed] [Google Scholar]
- 77.Boutant M, Canto C. SIRT1 metabolic actions: Integrating recent advances from mouse models. Mol Metab. 2014;3:5–18. doi: 10.1016/j.molmet.2013.10.006. [DOI] [PMC free article] [PubMed] [Google Scholar]
- 78.Imai S, Yoshino J. The importance of NAMPT/NAD/SIRT1 in the systemic regulation of metabolism and ageing. Diabetes Obes Metab. 2013;15(Suppl 3):26–33. doi: 10.1111/dom.12171. [DOI] [PMC free article] [PubMed] [Google Scholar]
- 79.Caughey B, Lansbury PT. Protofibrils, pores, fibrils, and neurodegeneration: Separating the responsible protein aggregates from the innocent bystanders. Annu Rev Neurosci. 2003;26:267–298. doi: 10.1146/annurev.neuro.26.010302.081142. [DOI] [PubMed] [Google Scholar]
- 80.Rong JA, Li SH, Sheng GQ, Wu M, Coblitz B, Li M, et al. 14-3-3 protein interacts with Huntingtin-associated protein 1 and regulates its trafficking. Journal of Biological Chemistry. 2007;282:4748–4756. doi: 10.1074/jbc.M609057200. [DOI] [PubMed] [Google Scholar]
- 81.Bodea LG, Wang Y, Linnartz-Gerlach B, Kopatz J, Sinkkonen L, Musgrove R, et al. Neurodegeneration by activation of the microglial complement-phagosome pathway. J Neurosci. 2014;34:8546–8556. doi: 10.1523/JNEUROSCI.5002-13.2014. [DOI] [PMC free article] [PubMed] [Google Scholar]
- 82.Zhu Z, Li X, Chen W, Zhao Y, Li H, Qing C, et al. Prenatal stress causes gender-dependent neuronal loss and oxidative stress in rat hippocampus. J Neurosci Res. 2004;78:837–844. doi: 10.1002/jnr.20338. [DOI] [PubMed] [Google Scholar]
- 83.Madhyastha S, Sahu SS, Rao G. Resveratrol for prenatal-stress-induced oxidative damage in growing brain and its consequences on survival of neurons. J Basic Clin Physiol Pharmacol. 2014;25:63–72. doi: 10.1515/jbcpp-2013-0011. [DOI] [PubMed] [Google Scholar]
- 84.Cao K, Zheng A, Xu J, Li H, Liu J, Peng Y, et al. AMPK activation prevents prenatal stress-induced cognitive impairment: modulation of mitochondrial content and oxidative stress. Free Radic Biol Med. 2014;75:156–166. doi: 10.1016/j.freeradbiomed.2014.07.029. [DOI] [PubMed] [Google Scholar]
- 85.Fedorova TN, Macletsova MG, Kulikov AV, Stepanova MS, Boldyrev AA. Carnosine protects from the oxidative stress induced by prenatal hypoxia. Dokl Biol Sci. 2006;408:207–210. doi: 10.1134/s001249660603001x. [DOI] [PubMed] [Google Scholar]
- 86.Sab IM, Ferraz MM, Amaral TA, Resende AC, Ferraz MR, Matsuura C, et al. Prenatal hypoxia, habituation memory and oxidative stress. Pharmacol Biochem Behav. 2013;107:24–28. doi: 10.1016/j.pbb.2013.04.004. [DOI] [PubMed] [Google Scholar]
- 87.Lu X, Jin C, Yang J, Liu Q, Wu S, Li D, et al. Prenatal and lactational lead exposure enhanced oxidative stress and altered apoptosis status in offspring rats' hippocampus. Biol Trace Elem Res. 2013;151:75–84. doi: 10.1007/s12011-012-9531-5. [DOI] [PubMed] [Google Scholar]
- 88.Stringari J, Nunes AK, Franco JL, Bohrer D, Garcia SC, Dafre AL, et al. Prenatal methylmercury exposure hampers glutathione antioxidant system ontogenesis and causes long-lasting oxidative stress in the mouse brain. Toxicol Appl Pharmacol. 2008;227:147–154. doi: 10.1016/j.taap.2007.10.010. [DOI] [PMC free article] [PubMed] [Google Scholar]
- 89.Makhro AV, Mashkina AP, Solenaya OA, Trunova OA, Kozina LS, Arutyunian AV, et al. Prenatal hyperhomocysteinemia as a model of oxidative stress of the brain. Bull Exp Biol Med. 2008;146:33–35. doi: 10.1007/s10517-008-0233-0. [DOI] [PubMed] [Google Scholar]
- 90.Bonatto F, Polydoro M, Andrades ME, da Frota Junior ML, Dal-Pizzol F, Rotta LN, et al. Effect of protein malnutrition on redox state of the hippocampus of rat. Brain Res. 2005;1042:17–22. doi: 10.1016/j.brainres.2005.02.002. [DOI] [PubMed] [Google Scholar]
- 91.Chen JC, Tonkiss J, Galler JR, Volicer L. Prenatal protein malnutrition in rats enhances serotonin release from hippocampus. J Nutr. 1992;122:2138–2143. doi: 10.1093/jn/122.11.2138. [DOI] [PubMed] [Google Scholar]


