Abstract
Fӧrster resonance energy transfer (FRET)-based studies have become increasingly common in the investigation of GPCR signaling. Our research group developed an intra-molecular FRET sensor to detect the interaction between Gα subunits and GPCRs in live cells following agonist stimulation. Here, we detail the protocol for detecting changes in FRET between the β2-adrenergic receptor and the Gαs C-terminus peptide upon treatment with 100 µM isoproterenol hydrochloride as previously characterized1. Our FRET sensor is a single polypeptide consisting serially of a full-length GPCR, a FRET acceptor fluorophore (mCitrine), an ER/K SPASM (systematic protein affinity strength modulation) linker, a FRET donor fluorophore (mCerulean), and a Gα C-terminal peptide. This protocol will detail cell preparation, transfection conditions, equipment setup, assay execution, and data analysis. This experimental design detects small changes in FRET indicative of protein-protein interactions, and can also be used to compare the strength of interaction across ligands and GPCR-G protein pairings. To enhance the signal-to-noise in our measurements, this protocol requires heightened precision in all steps, and is presented here to enable reproducible execution.
Keywords: Molecular Biology, Issue 115, GPCR signaling, FRET, HEK-293, live cell, ER/K SPASM linker, mCerulean, mCitrine, agonist-driven signaling
Introduction
G-protein-coupled receptors (GPCRs) are seven-transmembrane receptors. The human genome alone contains approximately 800 genes coding for GPCRs, which are activated by a variety of ligands including light, odorants, hormones, peptides, drugs and other small molecules. Nearly 30% of all pharmaceuticals currently on the market target GPCRs because they play a large role in many disease states2. Despite decades of extensive work done on this receptor family, there remain significant outstanding questions in the field, particularly with regards to the molecular mechanisms that drive GPCR-effector interactions. To date, only one high-resolution crystal structure has been published, providing insight into the interaction between the β2-adrenergic receptor (β2-AR) and the Gs protein3. Together with extensive research in the last three decades, it reiterates one specific structural component that is critical in this interaction: the Gα subunit C-terminus. This structure is important for both G protein activation by the GPCR4 and G protein selection5-6. Hence, the Gα C-terminus provides a crucial link between ligand stimulation of the GPCR and selective G protein activation.
Research over the last decade suggests that GPCRs populate a broad conformational landscape, with ligand-binding stabilizing subsets of GPCR conformations. While several techniques, including crystallography, NMR and fluorescence spectroscopy, and mass spectrometry are available to examine the GPCR conformational landscape, there is a paucity of approaches to elucidate their functional significance in effector selection7. Here, we outline a Fӧrster resonance energy transfer (FRET)-based approach to detect G protein-selective GPCR conformations. FRET relies on the proximity and parallel orientation of two fluorophores with overlapping emission (donor) and excitation (acceptor) spectra8. As the donor and acceptor fluorophores come closer together as a result of either conformational change in the protein or a protein-protein interaction, the FRET between them increases, and can be measured using a range of methods8. FRET-based biosensors have been employed extensively in the GPCR field9. They have been used to probe conformation changes in the GPCR by inserting donor and acceptor in the third intracellular loop and GPCR C-terminus; sensors have been designed to probe GPCR and effector interactions by separately labeling the GPCR and effector (G protein subunits/arrestins) with a FRET pair10; some sensors also detect conformational changes in the G protein11. These biosensors have enabled the field to ask a multitude of outstanding questions including conformational changes in the GPCR and effector, GPCR-effector interaction kinetics, and allosteric ligands12. Our group was particularly interested in creating a biosensor that could detect G protein-specific GPCR conformations under agonist-driven conditions. This biosensor relies on a recently developed technology named SPASM (systematic protein affinity strength modulation)13. SPASM involves tethering interacting protein domains using an ER/K linker, which controls their effective concentrations. Flanking the linker with a FRET pair of fluorophores creates a tool which can report the state of the interaction between proteins12. Previously1 the SPASM module was used to tether the Gα C-terminus to a GPCR and monitor their interactions with FRET fluorophores, mCitrine (referred to in this protocol by its commonly known variant, Yellow Fluorescent Protein (YFP), excitation/emission peak at 490/525 nm) and mCerulean (referred to in this protocol by its commonly known variant Cyan Fluorescent Protein (CFP), excitation/emission peak 430/475 nm). From N- to C-terminus, this genetically encoded single polypeptide contains: a full length GPCR, FRET acceptor (mCitrine/YFP), 10 nm ER/K linker, FRET donor (mCerulean/CFP), and the Gα C-terminus peptide. In this study, sensors are abbreviated as GPCR-linker length-Gα peptide. All components are separated by an unstructured (Gly-Ser-Gly)4 linker which enables free rotation of each domain. The detailed characterization of such sensors was previously performed using two prototypical GPCRs: β2-AR and opsin1.
This sensor is transiently transfected into HEK-293T cells and fluorometer-based live cell experiments measure fluorescence spectra of the FRET pair in arbitrary units of counts per second (CPS) in the presence or absence of ligand. These measurements are used to calculate a FRET ratio between the fluorophores (YFPmax/CFPmax). A change in FRET (ΔFRET) is then calculated by subtracting the average FRET ratio of untreated samples from the FRET ratio of ligand treated samples. ΔFRET can be compared across constructs (β2-AR-10 nm-Gαs peptide versus β2-AR-10 nm-no peptide). Here, we detail the protocol to express these sensors in live HEK-293T cells, monitor their expression, and the setup, execution, and analysis of the fluorometer-based live cell FRET measurement for untreated versus drug treated conditions. While this protocol is specific for the β2-AR-10 nm-Gαs peptide sensor treated with 100 µM isoproterenol bitartrate, it can be optimized for different GPCR-Gα pairs and ligands.
Protocol
1. DNA Preparation
Design sensor constructs using a modular cloning scheme. Please reference the β2-AR sensor design detailed previously1.
Prepare DNA according to commercial miniprep kit protocol and elute in 2 mM Tris-HCl solution, pH 8, at concentration ≥ 750 ng/µl, A260/A280 of 1.7 - 1.9, A260/A230 of 2.0 - 2.29.
2. Cell Culture Preparation
Culture HEK-293T-Flp-n cells in DMEM containing 4.5 g/L D-glucose, supplemented with 10% FBS (heat inactivated) (v/v), 1% L-glutamine supplement, 20 mM HEPES, pH 7.5 at 37 °C in humidified atmosphere at 5% CO2. Handle cells in biological safety hood for subsequent steps.
Allow cells to grow to a confluent monolayer before passaging into six-well dishes. Time to achieve confluency depends on initial plating density. Use plates that come to confluency within 1 - 2 days of plating for six-well plating. A confluent 10 cm tissue culture-treated dish has cell density of approximately 4 x 10⁶ cells/ml. See Figure 1 for image of cell culture growth.
Wash cells with 10 ml PBS, and trypsinize with 0.25% trypsin (see Discussion, paragraph 2). Plate 8 x 10⁵ cells/well in 2 ml of media in tissue culture-treated six well dishes and allow to adhere for 16 - 20 hr.
3. Transfection Conditions
Stagger transfections for constructs that may require different amounts of time to achieve optimal expression (between 20 - 36 hr). Synchronize conditions for a unified experiment time. Also have an untransfected control well at equivalent cell density to be used for background noise and scattering subtraction during analysis.
Bring transfection reagents to room temperature: reduced serum media, DNA, transfection reagent.
In a biological safety hood combine reagents in a sterile microcentrifuge tube in the following order: mix 2 µg DNA with 100 µl reduced serum media. Spike 6 µl of transfection reagent into media/DNA mix without touching surface of mixture or the side of the tube. Set up one transfection reaction per well. Transfection conditions can be optimized (1 - 4 µg of DNA, 3 - 6 µl of transfection reagent) to achieve consistent expression levels. See Table 1 for more optimized ratios.
Incubate mixture at RT in biological safety hood for 15 - 30 min. Do not use reaction if left to incubate for more than 30 min.
Add reaction to cells in a drop-wise manner across well and gently shake six-well to ensure thorough mixing. Add one reaction per well.
After 20 hr of expression, monitor fluorescence using tissue culture fluorescence microscope. Assess population expression with 10X objective and protein localization in a cell at 40X. Observe for protein expression at plasma membrane (PM). If substantial internalization is noted, monitor transfection until significant expression is detected at PM.
4. Reagent and Equipment Preparation
Prepare 100 mM drug stocks and store at -80 °C: isoproterenol bitartrate (100 mM in dH2O containing 300 mM ascorbic acid). Make on ice/in cold room, and flash-freeze immediately. Aliquots can be made and used up to one year.
Prepare Cell Buffer (~ 2 ml/condition) and store in a 37 °C water bath. Make fresh each day. Reference Table 2 for Cell Buffer constituents.
Prepare Drug Buffer (10 ml) and store at room temperature. Reference Table 2 for Drug Buffer constituents.
Acid wash cuvettes using concentrated HCl. Neutralize with a weak base (1 M KOH), and thoroughly wash cuvettes with dH2O.
Prepare work station around fluorometer with several boxes of 10, 200, and 1,000 µl pipette tips, a timer set with a 10 min countdown, an accessible vacuum line with tips for cuvette cleaning, delicate task wipes, and squirt bottle with ultrapure H2O.
Heat external water bath for fluorometer and heat block to 37 °C.
Turn on fluorometer; set fluorescence collection program for CFP collection to excitation 430 nm, bandpass 8 nm; emission range 450 nm - 600 nm, bandpass 4 nm. For YFP collection only as sensor control (see Discussion) set excitation to 490 nm, bandpass 8 nm, emission range 500 - 600 nm, bandpass 4 nm. CFP collection settings will be used to acquire a FRET spectrum in this experiment.
Place twelve 1.5 ml microcentrifuge tubes in heat block as shown in Figure 2 below. These tubes are holders for cell aliquot tubes (500 µl microcentrifuge tubes.) Place a small piece of tissue in holders 1 and 7 to cushion the cuvettes placed here. Note: Use separate cuvettes for untreated condition and drug condition to prevent cross-contamination.
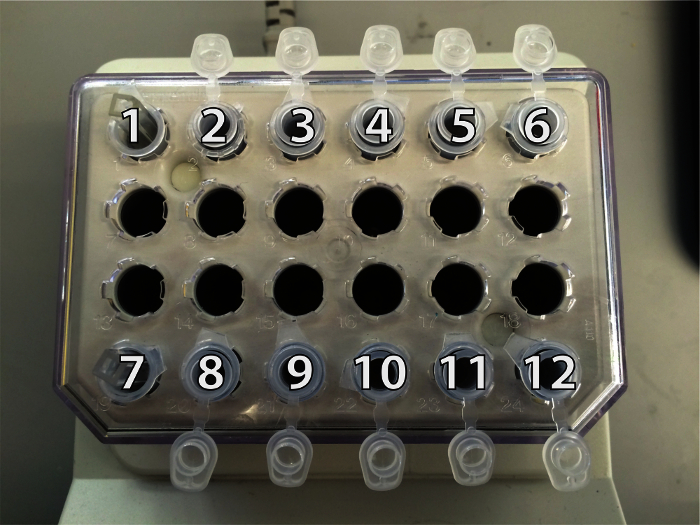 Figure 2. Microcentrifuge Tube Set Up and Position Reference in Heat Block. Cuvette for untreated samples is in position 1; cell aliquot tubes are in positions 2 - 6. Cuvette for drug treated samples is in position 7; cell aliquot tubes are in positions 8 - 12. Please click here to view a larger version of this figure.
Fill holders 2 - 6 and 8 - 12 with ~ 750 µl of water to create a mini 37 °C water bath.
Place ten 500 µl microcentrifuge tubes for cell aliquots into mini-water baths (holders 2 - 6, 8 - 12). Each tube will be an individual repeat of the condition (5 untreated, 5 drug treated).
Monitor cells for expression (see step 3.6).
5. Experiment & Data Collection
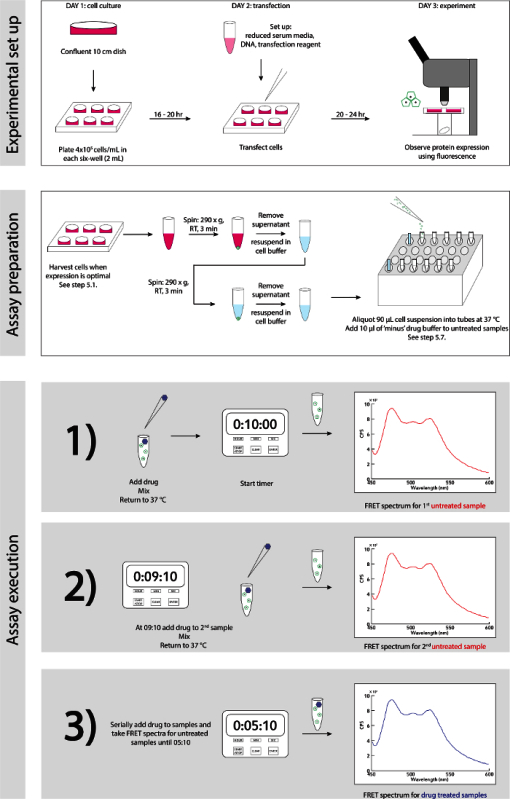 Figure 3. Experimental Schematic. A detailed step-wise guide for experimental set up and execution. Please click here to view a larger version of this figure.
Reference Figure 3 for experimental schematic. When cells are ready to be harvested, based on protein expression detected with fluorescence microscope (see Discussion, paragraph 4): in biological safety hood, gently remove ~1 ml of media, resuspend cells in their culture with a P1,000 and transfer resuspension into a 1.5 ml microcentrifuge tube. Note: Avoid using trypsin as it may digest the N-terminus and/or binding pocket of the GPCR sensor.
Count cells to ensure proper cell density in resuspension. Optimize resuspension volume for 4 x 10⁶ cells/ml.
Spin cells in swinging bucket centrifuge at room temperature, 290 x g for 3 min. Remove supernatant after the centrifugation.
GENTLY resuspend cells in 1 ml Cell Buffer (stored at 37 °C) and repeat step 5.3. During second spin, gather 100 mM drug stock aliquot from -80 °C. Make 1:100 dilution in Drug Buffer for 1 mM working stock and keep at RT.
After the second centrifugation, remove supernatant and gently resuspend cells in 1 ml of Cell Buffer (4 x 10⁶ cells/ml). Measure OD600 of the sample in the spectrophotometer using 1 ml of cells and 1 ml of Cell Buffer as a blank. Dispense cells in a disposable plastic cuvette and transfer back to a microcentrifuge tube immediately following spectrophotometry.
For a control untransfected cell condition spectrum, gently resuspend untransfected cells in 1 ml Cell Buffer with P1,000 pipet, add 90 µl of cells to cuvette and acquire FRET spectrum at excitation 430 nm, bandpass 8 nm, emission 450 - 600 nm, bandpass 4 nm. Collect 3 - 5 repeat spectra with fresh 90 µl of cells. Keep stock of cells at 37 °C between specs, resuspend gently with P1,000 between each sample aliquot, and rinse cuvette with ultrapure H2O between samples.
For experimental conditions, aliquot 90 µl of transfected cells to each of the 500 µl tubes in holders 2 - 6, 8 - 12 in the heat block. Gently resuspend stock of cells with P1,000 pipet between each aliquot.
After cells are aliquoted, add 10 µl of Drug Buffer to tubes 2 - 6 for untreated condition samples.
Begin experiment by adding 10 µl of 1 mM drug solution into tube 8, start the timer to countdown from 10 min, and gently mix tube with P200 pipet. Close tube and return to 37 °C heat block.
Immediately pick up tube 2, mix gently with P200 (use a new tip), add 90 µl of cell suspension to untreated condition cuvette, and place in fluorometer.
Acquire FRET spectrum at excitation 430 nm, bandpass 8 nm, emission 450 - 600 nm, bandpass 4 nm.
At 9 min - 10 sec, spike tube 9 with 10 µl of 1 mM drug solution, gently mix with a P200 (use new tip), and return tube to heat block.
Repeat steps 5.10 - 5.11 with tube 3 and 5.12 with tube 10.
Repeat steps 5.10 - 5.13 at 1 min intervals (08:10, 07:10, etc.) until spectra are collected for all untreated condition samples, and drug has been added to all drug condition samples. Use a fresh tip for each pipet step to prevent cross-contamination.
At 5 min - 10 sec, begin mixing tube 8 (drug condition) gently with P200 pipet, add 90 µl of cell suspension to separate cuvette for drug treated sample and place in fluorometer.
Acquire FRET spectrum (see step 5.11 for settings).
Repeat steps 5.15 - 5.16 at 1 min intervals (04:10, 03:10, etc.) for remaining drug condition samples (tubes 9 - 12).
After experiment ends, save project files, thoroughly wash cuvettes with ultrapure H2O, and re-stock tubes for next condition. Take care to prevent cross-contamination in the wash step. Change the tip on the H2O bottle as well as on the vacuum line in between washes.
6. Data Analysis
Save and export data files in SPC format to be used for analysis. Analysis programs are available for download from the Sivaramakrishnan Lab publication website.
Create path files for analysis software which include the analysis programs (v9, v15), untransfected samples files (see step 5.6 for untransfected cell spectrum collection), OUTPUT data file, and comma separated values (CSV) files for data entry.
Enter following information into CSV file (see sample in Table 3) and designate respective conditions for each sample, including: File name - individual SPC graph files Receptor - designate which GPCR construct was tested (e.g., Β2) Binder - designate which peptide variant of the construct was tested (e.g., S) Agonist - designate untreated (N) or drug treated (D) conditions Directory - the path folder in which SPC files are saved, usually organized by date OD - recorded optical density of sample from spectrophotometer
Enter file names for untransfected samples (step 5.6) to subtract buffer and scattering noise from samples.
Enter conditions into analysis program.
Run programs to analyze samples within individual conditions (v9) and across conditions (v15).
Exclude sample files which are apparent outliers in the data set, or adjust for subtraction by increasing or decreasing OD value of individual files.
Export data to OUTPUT file for access to calculated FRET ratios (525 nm/475 nm).
Calculate ΔFRET by subtracting the average FRET ratio for untreated condition from the individual FRET ratios for treated (drug) conditions.
Representative Results
A generalized schematic of the experiment set up and execution is detailed in Figure 3.
In order to detect a FRET change in the narrow dynamic range of the sensor, it is critical to adhere to the nuances of the system be adhered to. Cell quality is imperative to protein expression as well as consistency in sampling. Figure 1 features images of cultured cells growing in a consistent monolayer (10X) that is optimal for six-well plating and transfection Figure 1 (a) and cells growing in clumped patterns that lead to dendritic shapes Figure 1 (b) which is not recommended for consistent plating. Transfection conditions can also be optimized in order to achieve reproducible expression. Several conditions have been optimized for the recommended transfection reagent used here. Table 1 details these conditions for reduced serum media. DNA, and transfection reagent ratios.
Once all data has been collected and data entered into the CSV file for analysis (see sample in Table 3), the generated results will resemble the Raw FRET spectra data shown in Figure 4 (a) and the normalized, mean FRET spectra shown in Figure 4 (b). In Figure 4 the red spectra are the untreated samples and the blue are the drug treated samples. All of the Raw FRET spectra in Figure 4 (a) have sufficient signal-to-noise range for consistent data analysis (i.e., CPS at 450 nm compared to CPS at 475 nm). With this range, the spectra are smoother and the water peak from the sample (Raman peak is at 500 nm) is also minimal. Low expression levels result in a prominent water peak that interferes with data analysis. Data is normalized at 475 nm, setting the CPS of this value to 1.0 (Figure 4 (b)). In this data set for the β2-AR-10 nm-Gαs peptide sensor, there is a significant change at the 525 nm reading between untreated (red) and treated (blue) samples. The ΔFRET change is calculated from the FRET ratios (525 nm/475 nm) of these data sets and are accessible through the OUTPUT file.
If protein expression is low, there is poor transfection efficiency, or low cell density in the cuvette for fluorescence reading, spectra may appear noisier, as shown in Figure 5. Compared to Figure 4 (a) the signal-to-noise range for this data set is not ideal, at approximately 1.0 - 1.6, with CPSmax of 4 x 10⁵. This low expression level contributes to the jagged spectra seen in the raw data Figure 5 (a), however the data is tight and able to be normalized Figure 5 (b). Though the water peaks (~ 500 nm) does not line up completely between data sets Figure 5 (b) this experiment is still usable for analysis. Figure 6 is representative of an experiment that is inadequate for analysis. While the signal-to-noise of the sample is approximately 2 - 3 for treated (blue) and untreated (red) samples, cell density in the cuvette across samples is too low (450 nm value of 1 x 10⁵) Figure 6 (a). This creates an issue in background subtraction and normalization Figure 6 (b) and the spectra do not align. Subtraction can be adjusted for samples by increasing or decreasing OD in Table 3. However, even with low cell density, the water peak (~ 500 nm) becomes much larger and noisier Figure 6 (c) and inhibits this data set from further analysis.
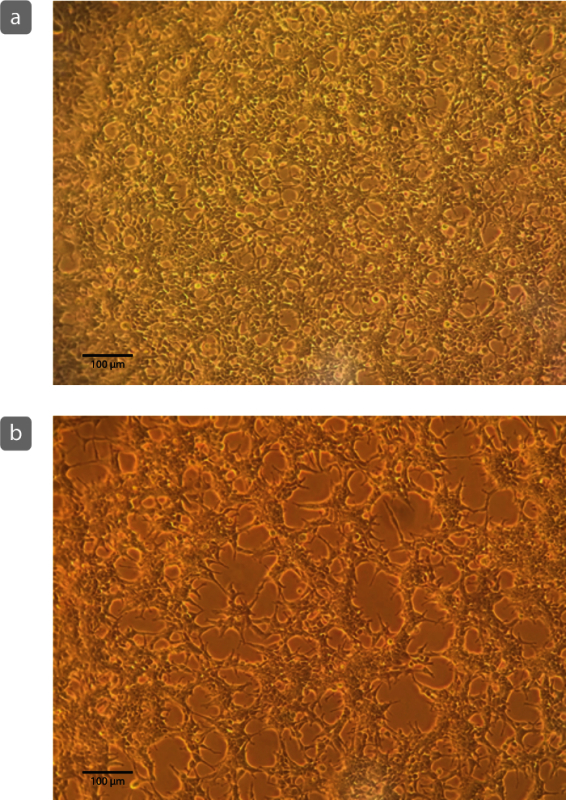 Figure 1. Example of Cultured Cell Growth. Cells growing in a monolayer (a) are ideal for consistent plating and transfection. Cells that appear to grow in clumps or with dendritic patterns (b) may not plate consistently in six-wells, may display poor transfection efficiency, and may create inconsistencies in amplitude of the FRET spectrum. Scale bar = 100 µm. Please click here to view a larger version of this figure.
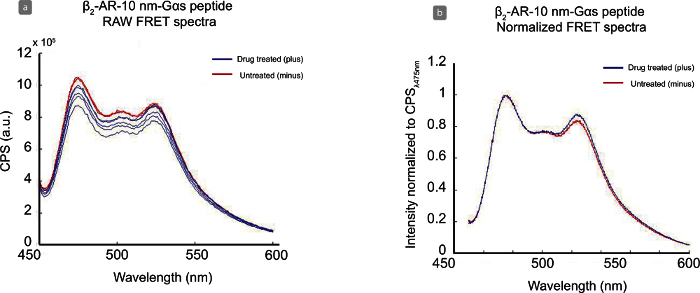 Figure 4. Representative Data Analysis for β2-AR-10 nm-Gαs Peptide ± Drug. Representative image of raw data(a) and normalized, averaged data (b) collected with the β2-AR-10 nm-Gαs peptide sensor with untreated (red) samples and treated (blue) samples after 5-minute incubation with 100 µM isoproterenol bitartrate. CFPmax emission at 475 nm, YFPmax emission at 525 nm. Please click here to view a larger version of this figure.
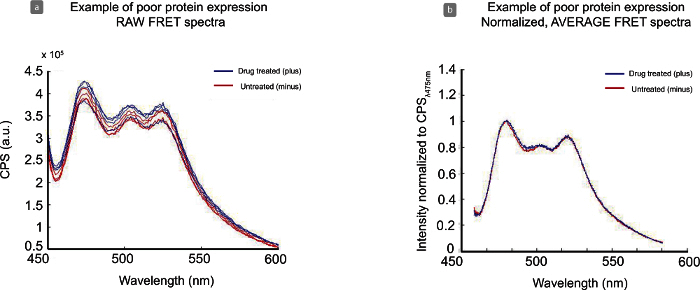 Figure 5. Analysis of Poor Protein Expression with Raw and Normalized Data. Noisy raw data spectra (a) are a result of low expression levels, low cell density per sample, and/or poor transfection efficiency of construct. This data set is still interpretable as normalized (b), although it is not ideal. Please click here to view a larger version of this figure.
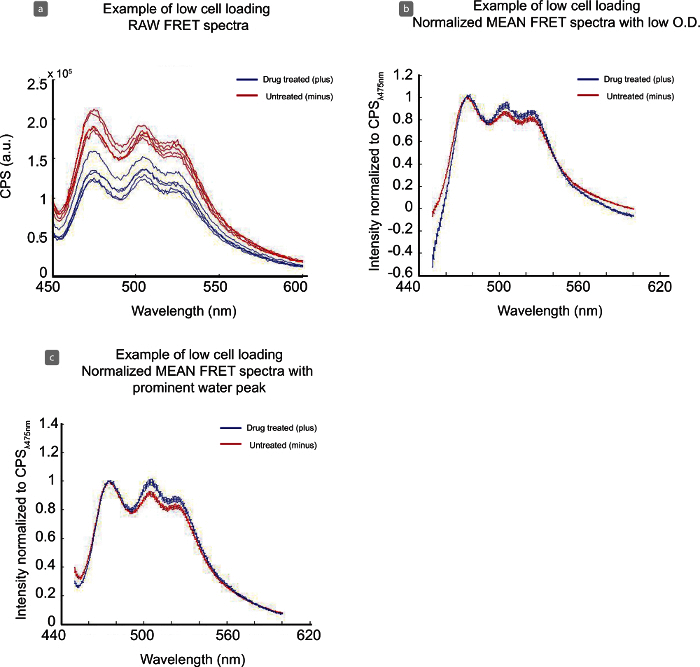 Figure 6. Analysis of Low Cell Density in Fluorometer Cuvette with Raw and Normalized Data Sets. The low cell density per sample, seen in raw data (a) complicates water/background subtraction (b, c) and makes this data set uninterpretable. Please click here to view a larger version of this figure.
| Condition | 0.5x | 0.7x | 1x | 2x | 2x* |
| DNA | 1 μg | 1.4 μg | 2 μg | 4 μg | 4 μg |
| Reduced serum media | 100 μl | 70 μl | 100 μl | 100 μl | 200 μl |
| Transfection reagent | 3 μl | 4.2 μl | 6 μl | 6 μl | 12 μl |
| *Note: Recommended for exceptionally difficult construct. Caution must be taken, as this condition induces high cell death. |
Table 1. Transfection Conditions. This table includes the optimized conditions of reagents for transfections into 2 ml wells of HEK-293T cells using the recommended transfection reagent.
| Cell Buffer | ||
| Volume | Reagent | Comments |
| 9 ml | ultrapure DNase/RNase free water | |
| 1 ml | HBS (10x), pH 7.4, store at 4 °C: | |
| 200 mM HEPES | ||
| 50 mM KCl | ||
| 450 mM NaCl | ||
| 20 mM CaCl2 - H2O | ||
| 10 mM MgCl2 - H2O | ||
| 100 μl | 20% D-glucose | |
| 15 μl | aprotinin (1 mg/ml in dH2O) | prevent degradation |
| 15 μl | leupeptin (1 mg/ml in dH2O) | prevent degradation |
| 100 μl | ascorbic acid (100 mM in dH2O)* | stabilize agonist |
| *add immediately before beginning assay | ||
| Drug Buffer | ||
| Volume | Reagent | Comments |
| 9 ml | ultrapure DNase/RNase free water | |
| 1 ml | HBS (10x), pH 7.4, store at 4 °C: | |
| 200 mM HEPES | ||
| 50 mM KCl | ||
| 450 mM NaCl | ||
| 20 mM CaCl2 - H2O | ||
| 10 mM MgCl2 - H2O | ||
| 100 μl | ascorbic acid (100 mM in dH2O)* | stabilize agonist |
| *add immediately before beginning assay |
Table 2. Buffer Constituents. This table details the reagents used to make both Cell Buffer and Drug Buffer for use in the experiment. Make both buffers fresh each day of the experiment; store Cell Buffer at 37 °C, and Drug Buffer at room temperature.

Table 3. Sample CSV File for Analysis. This sample data file highlights the entry set after one experiment. Multiple experiments can be entered into the same CSV file and can be discerned under the 'Additive' column if necessary. Each row must be filled out with the following information: File name - individual SPC graph files Receptor - designate which GPCR construct was tested (e.g., Β2) Binder - designate which peptide variant of the construct was tested (e.g., S) Agonist - designate untreated (N) or drug treated (D) conditions Directory - the path folder in which SPC files are saved, usually organized by date OD - recorded optical density of sample in spectrophotometer Please click here to view a larger version of this table.
Discussion
The tight dynamic range of FRET measurements in this system reinforces the necessity of sensitive quality control in every step of this protocol. The most important steps to ensure a successful FRET experiment are 1) cell culturing, 2) transfection 3) protein expression and 4) timely, precise coordination during the assay execution.
Cell health and maintenance/plating quality can have a significant impact on the signal-to-noise of the experimental system and poor cell health can make it impossible to detect any consistent change in FRET. Conservatively, cells are healthiest for approximately 20 passages, though this may vary based on cell line, handling, and culture conditions. Once cells have difficulty growing as a confluent monolayer, or begin growing consistently in more dendritic patterns (see Figure 1 (b)), experimental background noise will be adversely affected. Careful cell maintenance, including routine media changes and regularly removing non-adherent cells and debris from maintenance plates, will enhance the quality of cells for six-well plating and transfections. Cell clumps, which adversely affect transfection efficiency, can be effectively separated into individual cells by trypsinization of maintenance plates: treat 10 cm confluent dishes with 10 ml of 0.25% trypsin for 30 sec, remove trypsin but leave approximately 200 μl, place dish in 37 °C incubator for 2 - 3 min. Cells will come off dish very easily and are less susceptible to clumping.
It is critical to optimize the transfection step for this experiment. Six-wells must ideally be 60 - 80% confluent for efficient transfection and optimal expression. If too few cells have adhered (< 60%), wait approximately 2 - 6 hr to transfect, or until at least 70% of cells are adhered. Six-wells that are over-confluent (> 80%) will also reduce transfection efficiency. Transfecting at lower cell confluency increases cell death rate. DNA concentration and purity are also critical (see Step 1.2). Using low concentration and/or poor quality DNA preparations negatively affect transfection efficiency Transfection conditions can be adjusted per construct, refer to Table 1 for more information.
Accurate and consistent monitoring of protein expression using a tissue-culture fluorescence microscope is another crucial step in this process. Though this step is subject to individual judgement, it is possible to use other techniques, such as microscopy, to monitor expression over time quantitatively, though they are not detailed here. For constructs we have tested successfully in our system, expression takes approximately 18-36 hr to reach optimal expression. In our experience, constructs that display poor expression during this time window rarely improve after 40 hr. The constructs we have published with have not shown signs of degradation, however this may be an issue for some GPCRs. In our assays, sensor degradation is possible at transfection times over 30 hr. Sensor integrity can be tested using YFP/CFP ratios: 525 nm reading from the YFP-excited (490 nm) spectrum, and 475 nm reading from CFP-excited (430 nm) spectrum. For settings, see step 4.6. Recommended YFP/CFP ratios are in the range of 1.7 - 2.0, with an ideal ratio of 1.8. This value is dependent on the approximate two-fold greater brightness of YFP relative to CFP14. An integral sensor with minimal degradation will therefore contain both fluorophores and have YFP:CFP ratio of approximately 2:1. After sensor quality has been confirmed it is important to confirm protein localization and expression at the plasma membrane. Significant intracellular expression could be a result of either protein degradation, internalization, or ongoing trafficking of the protein. Monitor constructs over time to see if expression is enhanced at the plasma membrane. The next critical challenge in expression is transfection efficiency. Approximately 70% + transfection efficiency is necessary for adequate signal-to-noise detection in this fluorometer system. If fewer cells are transfected, the amount of signal-to-noise may still be detectable but will be much less consistent between samples in one FRET experiment. This will hinder accurate data analysis within the narrow dynamic range of the system. Expression levels also present a significant hurdle to achieving ample signal-to-noise during the experiment. For expression levels detectable by the fluorometer, the ratio of signal between 475 nm and 450 nm (cell scattering) of 1.5 is sufficient for detecting a change in FRET, however optimal expression will have a ratio of approximately 2.0+. For reference, the β2-AR data is collected in a signal-to-noise range of 4 x 10⁵ CPS (450 nm) to 1 x 10⁶ CPS (475 nm), signal-to-noise ratio of 2.5. This ratio will help reduce the amount of variability between samples, which can also affect data analysis. These expression levels are also subject to the sensitivity and optimal alignment of the fluorometer optics; other systems may require different parameters for adequate signal-to-noise optimization.
Cells are extremely sensitive to time and temperature. Once the experimental procedure has begun, gentle handling is essential to avoid cell death. Specific logistical measures can be taken to expedite the process and avoid timely mistakes including preparing the work station, making sure all equipment is functioning properly, and planning out the goals of the experiment beforehand. It is ideal to use cells within 30 min of harvesting, and in our system, this protocol is executed within 20 min. Once the technique is mastered, specifically transfection optimization and the manual dexterity of the exercise itself, this experiment can be used to compare various constructs against each other, generate dose-response curves, and the sensor can be expanded to the full-length G protein.
Though the FRET sensor used here is a unique development in GPCR FRET sensors, this specific experimental setup is detailed as a well-characterized assay for the implementation of the sensor. The fluorometer-based assay allows a large population of cells to be assessed in each experiment and does not rely on purified protein or membrane preps, therefore maintaining an in vivo environment. This experimental design has also been optimized to detect very small changes seen in the system upon agonist stimulation of the GPCR.
Disclosures
The authors declare that they have no competing interests.
Acknowledgments
R.U.M was funded by the American Heart Association Pre-doctoral Fellowship (14PRE18560010). Research was funded by the American Heart Association Scientist Development Grant (13SDG14270009) & the NIH (1DP2 CA186752-01 & 1-R01-GM-105646-01-A1) to S.S.
References
- Malik RU, et al. Detection of G Protein-selective G Protein-coupled Receptor (GPCR) Conformations in Live Cells. J. Biol. Chem. 2013;288:17167–17178. doi: 10.1074/jbc.M113.464065. [DOI] [PMC free article] [PubMed] [Google Scholar]
- Oldham WM, Hamm HE. Heterotrimeric G protein activation by G-protein-coupled receptors. Nat. Rev. Mol. Cell Bio. 2008;9:60–71. doi: 10.1038/nrm2299. [DOI] [PubMed] [Google Scholar]
- Rasmussen SG, et al. Crystal structure of the β2 adrenergic receptor-Gs protein complex. Nature. 2011;477:549–555. doi: 10.1038/nature10361. [DOI] [PMC free article] [PubMed] [Google Scholar]
- Alexander NS, et al. Energetic analysis of the rhodopsin-G-protein complex links the α5 helix to GDP release. Nat. Struct. Mol. Biol. 2014;21(1):56–63. doi: 10.1038/nsmb.2705. [DOI] [PMC free article] [PubMed] [Google Scholar]
- Conklin BR, Farfel Z, Lustig KD, Julius D, Bourne HR. Substitution of three amino acids switches receptor specificity of Gqα to that of Giα. Nature. 1993;363:274–276. doi: 10.1038/363274a0. [DOI] [PubMed] [Google Scholar]
- Conklin BR, et al. Carboxyl-Terminal Mutations of Gqα and Gsα That Alter the Fidelity of Receptor Activation. Mol. Pharmacol. 1996;50:855–890. [PubMed] [Google Scholar]
- Onaran HO, Costa T. Where have all the active receptor states gone. Nat. Chem. Bio. 2012;8:674–677. doi: 10.1038/nchembio.1024. [DOI] [PubMed] [Google Scholar]
- Jares-Erijman EA, Jovin TM. FRET imaging. Nat Biotechnol. 2003;21(11):1387–1395. doi: 10.1038/nbt896. [DOI] [PubMed] [Google Scholar]
- Lohse MJ, Nuber S, Hoffman C. Fluorescence/bioluminescence resonance energy transfer techniques to study G-protein-coupled receptor activation and signaling. Pharmacol Rev. 2012;64(2):299–336. doi: 10.1124/pr.110.004309. [DOI] [PubMed] [Google Scholar]
- Vilardaga JP, Bünemann M, Krasel C, Castro M, Lohse MJ. Measurement of the millisecond activation switch of G protein-coupled receptors in living cells. Nat. Biotechnol. 2003;21:807–812. doi: 10.1038/nbt838. [DOI] [PubMed] [Google Scholar]
- Bünemann M, Frank M, Lohse MJ. Gi protein activation in intact cells involves subunit rearrangement rather than dissociation. Proc. Natl. Acad. Sci. USA. 2003;100(26):16077–16082. doi: 10.1073/pnas.2536719100. [DOI] [PMC free article] [PubMed] [Google Scholar]
- Stumpf AD, Hoffman C. Optical probes based on G protein-coupled receptors - added work or added value. Brit. J. Pharmacol. 2016;173:255–266. doi: 10.1111/bph.13382. [DOI] [PMC free article] [PubMed] [Google Scholar]
- Sivaramakrishnan S, Spudich JA. Systemic control of protein interaction using a modular ER/K α-helix linker. Proc. Natl. Acad. Sci. USA. 2011;108:20467–20472. doi: 10.1073/pnas.1116066108. [DOI] [PMC free article] [PubMed] [Google Scholar]
- Shaner NC, Steinbach PA, Tsien RY. A guide to choosing fluorescent proteins. Nat. Methods. 2005;2(12):905–909. doi: 10.1038/nmeth819. [DOI] [PubMed] [Google Scholar]


