eLife logoLink to eLife
. 2016 Oct 12;5:e19532. doi: 10.7554/eLife.19532

Eco-HAB as a fully automated and ecologically relevant assessment of social impairments in mouse models of autism

Alicja Puścian 1, Szymon Łęski 1, Grzegorz Kasprowicz 2,3, Maciej Winiarski 1, Joanna Borowska 1, Tomasz Nikolaev 1, Paweł M Boguszewski 1, Hans-Peter Lipp 4,5, Ewelina Knapska 1,*
Editor: Peggy Mason6
PMCID: PMC5092044  PMID: 27731798

Abstract

Eco-HAB is an open source, RFID-based system for automated measurement and analysis of social preference and in-cohort sociability in mice. The system closely follows murine ethology. It requires no contact between a human experimenter and tested animals, overcoming the confounding factors that lead to irreproducible assessment of murine social behavior between laboratories. In Eco-HAB, group-housed animals live in a spacious, four-compartment apparatus with shadowed areas and narrow tunnels, resembling natural burrows. Eco-HAB allows for assessment of the tendency of mice to voluntarily spend time together in ethologically relevant mouse group sizes. Custom-made software for automated tracking, data extraction, and analysis enables quick evaluation of social impairments. The developed protocols and standardized behavioral measures demonstrate high replicability. Unlike classic three-chambered sociability tests, Eco-HAB provides measurements of spontaneous, ecologically relevant social behaviors in group-housed animals. Results are obtained faster, with less manpower, and without confounding factors.

DOI: http://dx.doi.org/10.7554/eLife.19532.001

Research Organism: Mouse

Introduction

Social interactions are complex on any number of levels, from the behavior of individuals to the induced patterns of neuronal activation. They are very difficult to study because even small changes in experimental conditions can produce significant modifications of the behavioral outcome. Experiments must be designed to ensure control over factors affecting these interactions.

Conventional tests of social phenotyping have repeatedly proven inefficient in differentiating certain genotypes and replicating these differences across laboratories and protocol conditions (Chadman et al., 2008; Moy et al., 2004; Pearson et al., 2010; Tabuchi et al., 2007). For example, in most studies of autism and sociability in mice, behavioral effects related to anxiety and susceptibility to stress have been overlooked, even though, in humans, both these factors are co-morbid to autism spectrum disorders (Simonoff et al., 2008). In fact, anxiety is the most common cause of social impairments in humans. Since some people with ASD never develop so-called 'associated' anxiety, we can assume that underlying neural mechanisms are at least partially different. Therefore, it is important to model single symptoms, separating them to the largest possible extent from any confounding factors in order to understand the brain pathology underlying the observed effects. Reliable behavioral tests allowing for differential diagnosis are the first necessary step on the long path to disentangling the complex neural background of specific pathologies.

Social interactions of rodents are often assessed using the three-chambered apparatus social approach test (3ChA), in which lone mice are given the choice between approaching a caged conspecific or an inanimate object. The popularity of 3ChA stems from its simplicity, inexpensive cage construction, and the lack of alternative tests. However, its poor cross-laboratory standardization and reproducibility call for alternative testing. At times, different laboratories have come to opposite conclusions concerning sociability of the same autistic phenotype mouse model (Chadman et al., 2008; Tabuchi et al., 2007, p. 3). Even within a single laboratory, reproducible results can be difficult to obtain (Jamain et al., 2008; El-Kordi et al., 2013).

Irreproducibility of conventional behavioral tests across laboratories (Crabbe et al., 1999) has recently been identified as one of the most important threats to science and its public understanding (Nature, 2015; Morrison, 2014). The known factors that lead to severe behavioral abnormalities in both males and females (Beery and Kaufer, 2015; Heinrichs and Koob, 2006; Sandi and Haller, 2015) and which are particularly difficult to control include: handling by human experimenters with unique scents and variable handling abilities (Chesler et al., 2002; Sorge et al., 2014), levels of animal familiarity with the experimental environment, and housing of animals in social isolation (a practice forbidden by EU ethical standards unless justified by experimental requirements). These confounding factors, all present in published 3ChA results (El-Kordi et al., 2013), can be eliminated by development of automated, ethologically relevant behavioral tests, which measure spontaneous sociability in group-housed, familiar mice without the presence of a human experimenter.

Irreproducibility and high manpower costs of manual testing have led to the development of automated behavioral tests. These allow assessment of individual behavior of group-housed rodents using either radio-frequency-based identification (RFID) (Galsworthy et al., 2005; Knapska et al., 2006; Voikar et al., 2010; Schaefer and Claridge-Chang, 2012; Howerton et al., 2012) or advanced video/image processing (de Chaumont et al., 2012; Pérez-Escudero et al., 2014; Shemesh et al., 2013; Weissbrod et al., 2013). Video-based systems, often employed for tracking social interactions, have serious limitations in ethologically relevant settings containing shadowed areas and narrow corridors. Scientists try to overcome those difficulties i.a. by combining existing systems with additional tracking methods (Weissbrod et al., 2013). Although RFID systems are more invasive than video-tracking solutions due to the necessity of injecting animals with electronic tags, high intra- and inter-laboratory reliability have been confirmed (Codita et al., 2012; Krackow et al., 2010; Puścian et al., 2014). However, their present commercial form is not suitable for measuring sociability.

To meet these challenges, we designed Eco-HAB. This is a fully automated, open-source system based on RFID technology and inspired by the results of ethological field studies in mice (Dell'omo et al., 1998, 2000; Lopucki and Szymroszczyk, 2003; Andrzejewski, 2002; Lewejohann et al., 2004; Lopucki, 2007; Daan et al., 2011; von Merten et al., 2014; Chalfin et al., 2014). Group-housed animals equipped with RFID tags live in a spacious, four-compartment apparatus with shadowed areas and narrow tunnels resembling natural burrows. Eco-HAB reduces stress by tracking the tendency of animals to voluntarily spend time together in an environment to which they have already been accustomed and utilizes novel sociability measures for group-housed mice. The system is equipped with software for automated data extraction and analysis, enabling quick evaluation of social activity.

By comparing Eco-HAB results from several mouse models having different sociability levels, we show that this apparatus provides results comparable to the classic three-chamber test when carried out in stress-reducing conditions for single-housed animals. As a result of the innovative electronic solutions (Figure 1—figure supplement 1) developed for Eco-HAB, data from this system are obtained much faster, with high reliability (Figure 1—figure supplement 2), less manpower (Figure 1—figure supplement 3), and are not confounded by the factors that usually blur results of manual testing. The cost of building an Eco-HAB system, suitable for testing up to 12 animals at the same time (approximately 2000 EUR), is comparable to the cost of one three-chambered apparatus. To illustrate the need for automated testing of social behaviors, we also demonstrate how easily one can obtain apparently opposite conclusions regarding sociability of tested mice when confounding factors are not controlled.

Results and discussion

Eco-HAB – ethologically relevant testing of social behaviors

The Eco-HAB system and its testing protocols take into account the innate murine tendency to avoid open areas and inhabit enclosed spaces, from which they regularly explore large territories, mostly at night (Andrzejewski, 2002; Dell'Omo et al., 2000, 1998). Eco-HAB (Figure 1 and Video 1) consists of four housing compartments, occupying four corners of a larger square, bridged by tube-shaped corridors. These corridors enable mice to travel freely and select preferred areas within the available territory. Two chambers on opposing corners of the square offer access to food and water (ad libitum) and provide shelter and secluded places where mice can sleep and rest. The two other compartments have similar designs except that they contain no food or water and one of the corners is equipped with an impassable, transparent, and perforated partition behind which an olfactory stimulus may be presented. Acknowledging the natural tendency of mice to live in family-based groups having many members (Andrzejewski, 2002), Eco-HAB is designed for testing littermate cohorts of up to 12 subjects. Animals are tracked individually by subcutaneously injected microtransponders that emit a unique identification code when mice pass under RFID antennas placed on both ends of each corridor. As Eco-HAB is a computer-controlled system, it eliminates human handling and allows for continuous data collection lasting for days or even weeks with minimal presence of human observers. Since the position of every mouse in an Eco-HAB system can be tracked, a novel in-cohort measure of sociability, based on the tendency of mice for spending time together, can be assessed. The in-cohort sociability score is calculated as described in the Materials and methods and Figure 1—figure supplements 46. Notably, results show that both Eco-HAB measures--in-cohort sociability and scent-based social approach--allow similar conclusions about mouse behavior to be reached. The latter measure is equivalent to the most natural social exploratory behavior observed in wild populations of mice.

Video 1. Top view of the working Eco-HAB.

Download video file (1MB, mp4)
DOI: 10.7554/eLife.19532.009

Flashing lights indicate activation of RFID antennas – sensors of the individual recognition system. The clip presents a 30 s period at the beginning of the adaptation phase, when animals are eagerly exploring new territory.

DOI: http://dx.doi.org/10.7554/eLife.19532.009

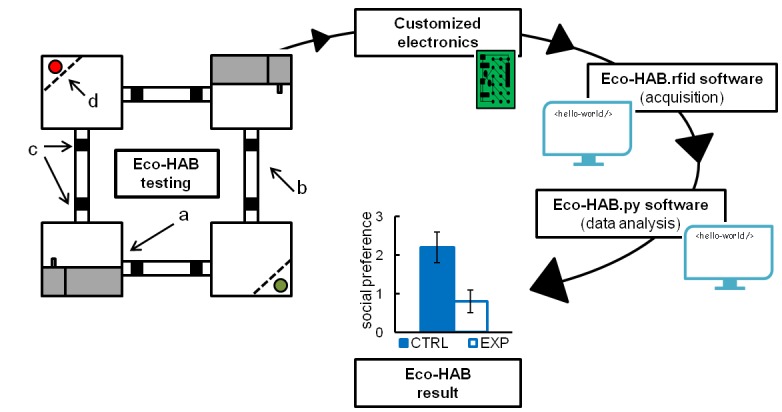
Figure 1. A schematic representation of Eco-HAB system and data processing.

Eco-HAB consists of four housing compartments (a), tube-shaped inter-territorial passages (b), radio-frequency identification antennas (c), and impassable, perforated partitions behind which social and non-social (control) provenance stimuli may be presented (d, red/green dots). Food and water is available in housing compartments adjacent to those containing partitions. Eco-HAB is equipped with customized electronics and two software packages: Eco-HAB.rfid (for data acquisition and collection) and Eco-HAB.py (for filtering corrupted data segments and performing tailored analysis). For a detailed system and software description, see 'Materials and methods'.
DOI: http://dx.doi.org/10.7554/eLife.19532.002

Figure 1.

Figure 1—figure supplement 1. Block schematic diagram of customized electronic system for Eco-HAB.
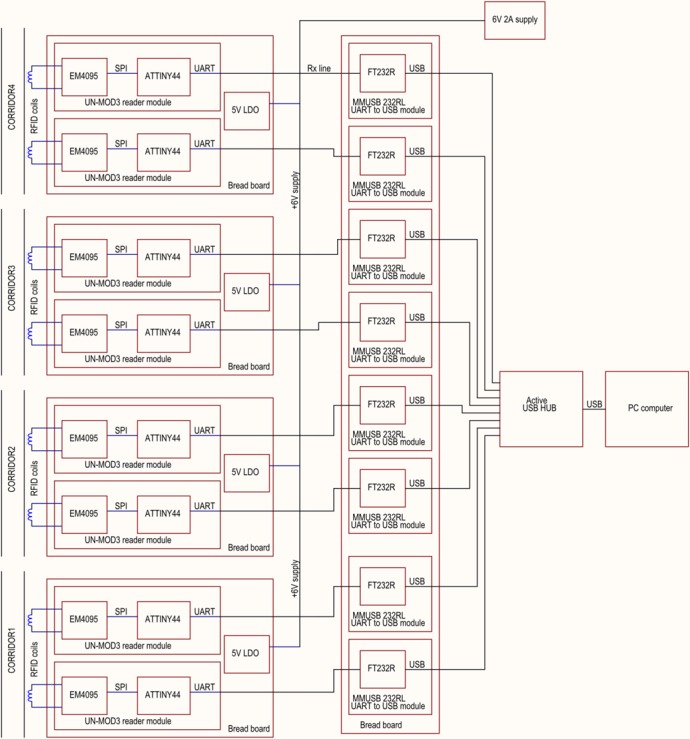
Figure 1—figure supplement 1.

Figure 1—figure supplement 2. RFID antenna efficiency compared to video-based manual scoring.
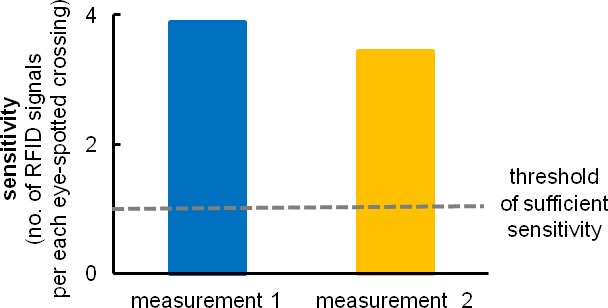
Figure 1—figure supplement 2.

We counted the number of RFID registrations per visually registered crossing under the antenna. The implemented system of coils recognizes subjects at a rate of at least one or more RFID registration per one video-recorded passing, a rate better than needed to record all events. Superfluous RFID readouts are later eliminated by Eco-HAB.py software that contains algorithms recognizing such events (see 'Materials and methods'). Due to the built-in internal synchronization system, RFID antennas run independently and do not disrupt one another. All eight coils may be activated simultaneously for unlimited time, which leads to highly effective animal recognition (less than 0.6% unidentified animals’ positions).
Figure 1—figure supplement 3. Comparison of time (person-hours) needed for Eco-HAB testing versus three-chambered apparatus testing (stress reducing conditions) of a group of 12 mice.
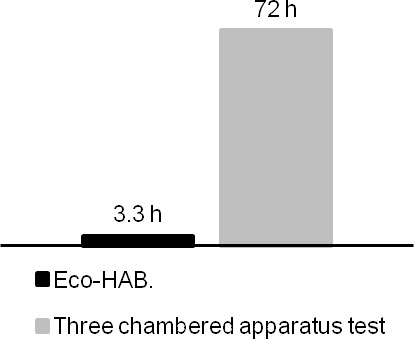
Figure 1—figure supplement 3.

For detailed description of behavioral protocols see 'Materials and methods'.
Figure 1—figure supplement 4. Eco-HAB measures in-cohort sociability in mice.
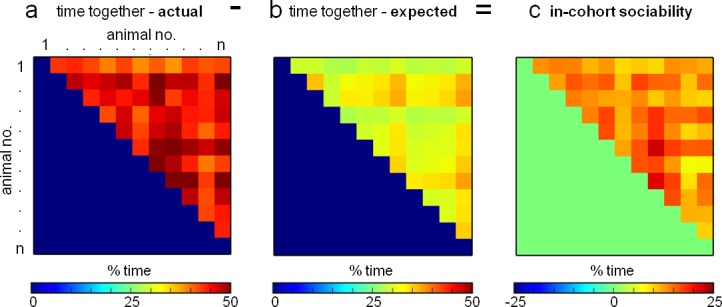
Figure 1—figure supplement 4.

(a) Detailed data regarding quantity of time spent by each mouse with every other animal in the group can be obtained in Eco-HAB. (b) Based on simultaneous territory occupation for each individual, we calculate the minimum time each given pair of subjects must spend together. (c) After subtracting expected time together from the acquired one, we obtained amount of time animals willfully spent together, as it cannot be attributed to the dispersal pattern within the system.
Figure 1—figure supplement 5. Eco-HAB allows for a detailed analysis of subjects' preference to spend time with another mouse from a tested cohort.
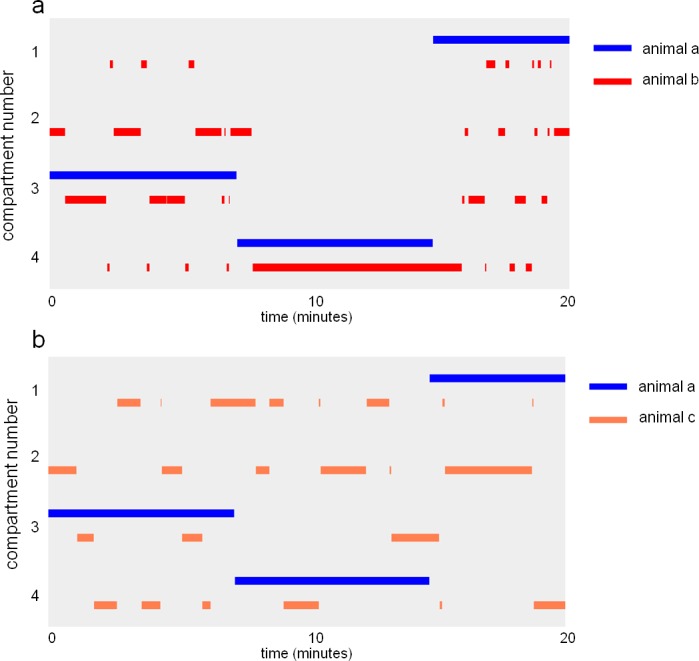
Figure 1—figure supplement 5.

Examples show (a) a pair of mice spending most of their time together, regardless of their position within the territory, and (b) a pair of mice spending time mostly in different areas of Eco-HAB. Bars represent presence of a mouse in one of four Eco-HAB compartments (numbered 1–4).
Figure 1—figure supplement 6. Monitoring of subjects’ dispersal within Eco-HAB territory for exemplary cohorts of (a) C57BL/6 and (b) BALB/c mice.
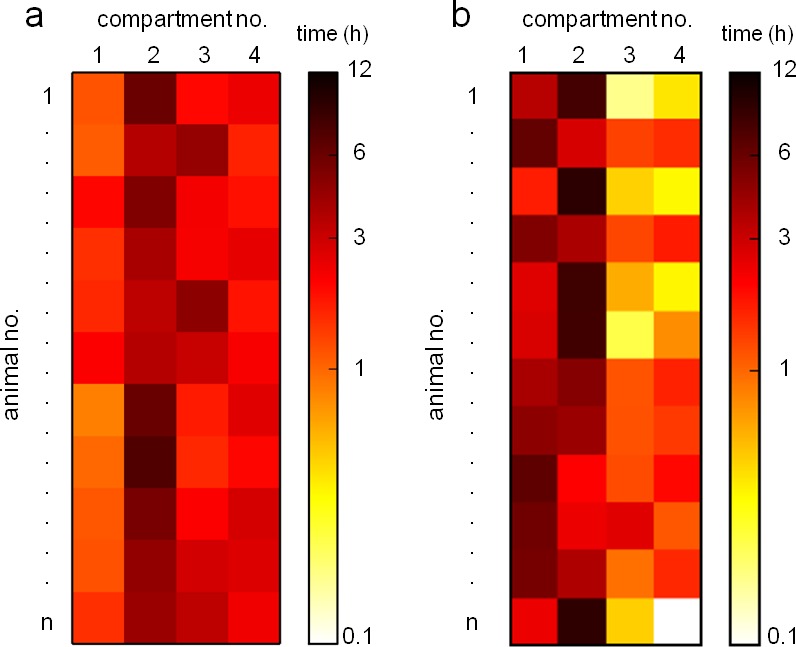
Figure 1—figure supplement 6.

Customized software provides easy access to data on the amount of time spent by a mouse in each Eco-HAB compartment. An example here shows mouse activity distribution in 12-hr dark phase during the adaptation stage.

Odor-mediated communication is crucial for survival and plays a key role in all murine social behaviors: mating and reproduction, territory maintenance, development of stable inter-group hierarchy (Stockley et al., 2013), and integration of populations of mice in the wild (Andrzejewski, 2002). Mice have developed the ability to learn and remember information associated with olfactory cues as effectively as primates recall visually related cues (Schellinck et al., 2008). It has been shown that unfamiliar rodents in their natural habitats tend to avoid each other and, if forced to interact openly, often become aggressive (Lopucki, 2007). Unfamiliar mice, irrespective of their sexes, are attracted by the scent of a conspecific rather than by its presence (Andrzejewski, 2002; Lopucki and Szymroszczyk, 2003). For that reason, scents have been previously employed in the 3ChA test (Ryan et al., 2008) although, more commonly, unfamiliar animals are introduced into the social chamber. Even though the latter can be implemented in Eco-HAB, in the following experiments we used olfactory stimuli as a more ecologically pertinent solution. Presentation of odors behind partitions prevents spreading of scented bedding over the whole territory, but allows mice to freely approach olfactory cues (for a detailed apparatus and applied electronics description see 'Materials and methods' and Figure 1 and its Figure 1—figure supplement 1). We optimized the behavioral protocol with respect to different testing times and measures. We optimized the behavioral protocol, testing times, and measures to fit with mouse preference. Under these optimized conditions, replicable results were obtained. In the final protocol, cohorts of 7 to 12 same-sex mice are subjected to 72-hr testing. During an adaptation phase (first 48 hr) mice can freely explore the whole apparatus. The odor-based social-preference testing phase starts with simultaneous introduction of two different beddings to two testing compartments. One of the beddings comes from a cage housing a mouse of the same sex, age, and strain as the tested animals ('social' scent), while the other is plain, new bedding from stock. These beddings are placed behind the perforated partitions of the testing compartments (for more details, see the 'Materials and methods'). Mice are allowed to explore both stimuli for 24 hr. Social approach is measured as the relative increase in time spent in the compartment containing social scent divided by the time spent in the opposite chamber that contains bedding without the social scent.

Experimental stress interferes with results of manual tests of sociability

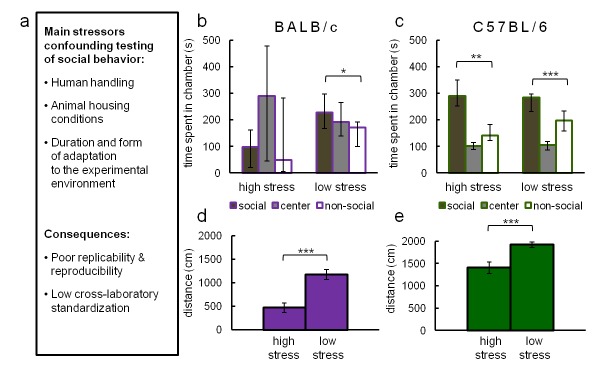
To illustrate the influence of typical confounding factors (listed in Figure 2A) affecting 3ChA social approach testing, we compared the results of 3ChA tests performed in stress-reducing (low stress) and conventional laboratory conditions (high stress). Experiments were performed on two widely used strains of mice displaying different anxiety levels: C57BL/6 and BALB/c. To obtain low-stress conditions, we used mild lighting and extensively habituated both the subjects and mice used as social stimuli to an experimenter and experimental rooms (for a detailed description of the protocol, see 'Materials and methods'). The results of these tests are shown in Figure 2B through Figure 2E. BALB/c mice (Figure 2B) showed social preference only in low-stress conditions (n = 17), and they avoided social interactions when tested in a typical experimental setting (n = 11). In contrast, C57BL/6 mice displayed social preference in both stressful (n = 11) and stress reducing (n = 38) conditions (Figure 2C). Social preference (Figure 2D and E) was measured as time spent in the chamber containing a social object compared to time spent in chamber with a non-social object. These results show that C57BL/6 mice approach a conspecific mouse more than an inanimate object, regardless of the level of experimental stress while BALB/c mice behave this way only when using stress reducing procedures. In both tested strains, conventional experimental treatment (high stress) reduced locomotor activity which may have attenuated the number of social contacts and influenced their propensity for exploration.

Figure 2. Main stressors interfering with reliable measurement of social behavior in rodents (a) and their effects on social preference scores in C57BL/6 and BALB/c mice in the conventional three-chambered test (b–e) under low- and high-stress conditions.

Figure 2.

High-stress conditions differ from low-stress conditions in the intensity of light and subjects' and mouse social objects' habituation to the experimenter and the experimental environment (for a detailed protocol see 'Materials and methods'). (b) BALB/c mice showed social preference only in low-stress conditions (n = 17), and they avoided social interactions when tested in a typical experimental setting (n = 11). (c) In contrast, C57BL/6 mice displayed social preference in both stressful (n = 11) and stress-reducing (n = 38) conditions. Social preference was calculated as the time spent in the chamber containing the social object compared to the time spent in the chamber with a non-social object. (d,e) Under stress, both tested strains of mice showed reduced locomotor activity. Data are median values and error bars represent IQR (interquartile range), *p<0.05, **p<0.01, ***p<0.001 (Mann-Whitney U-test).

DOI: http://dx.doi.org/10.7554/eLife.19532.010

Eco-HAB – validation of the method

In order to explore how Eco-HAB data relate to the most commonly used social approach task, we compared our results with the 3ChA test performed under stress-reducing conditions on both group and single-housed subjects. For these tests, social approach in the Eco-HAB system is calculated as the increase in the proportion of time spent in the compartment with social odor during the first hour after its presentation, divided by the proportion of time spent in the compartment with non-social stimulus. In the three-chambered test, social approach is the increase in the proportion of time spent in the compartment with an unfamiliar mouse, divided by the proportion of time spent in the compartment with an unfamiliar inanimate object. We used animals displaying different levels of social interactions, namely valproate-treated (VPA) mice of C57BL/6 and BALB/c strains. Single prenatal valproate exposure is considered a mouse model of an environmental insult (a potential trigger) contributing to development of autism spectrum disorders (Roullet et al., 2013), albeit some recent results report increased sociability of VPA-treated animals (Štefánik et al., 2015).

Our results are clearly in favor of valproate increasing sociability in both tested strains. Automated Eco-HAB testing (Figure 3A) showed that valproate-treated C57BL/6 mice display increased social approach. Interestingly, 3ChA testing revealed the same result when subjects were single-housed (Figure 3B), but no differences between VPA and control animals when subjects were group-housed (Figure 3—figure supplement 1A). In BALB/c mice, despite significant attempts at reducing experimental stress in 3ChA testing, only Eco-HAB revealed a significant increase in social behavior caused by VPA (Figure 3E). Manual assessment with the use of the 3ChA showed the same trend in single-housed animals; however, differences were blurred by a huge variability in the scores (Figure 3F). Again, no differences were found between VPA and control, group-housed BALB/c subjects (Figure 3—figure supplement 1B).

Figure 3. Sociability measurements in Eco-HAB and three-chambered apparatus social approach test performed under stress reducing conditions.

Figure (ad) depict tests involving C57BL/6 mice and (eh) tests involving BALB/c mice. (a) and (e) show social approach in the Eco-HAB system defined as the increase in proportion of time spent in the compartment with social odor during the first hour after its presentation, divided by the proportion of time spent in the compartment with non-social stimulus. For (a), VPA-treated n = 26 and CTRL n = 35. For (e), VPA-treated n = 18 and CTRL n = 20. (b) and (f) show social approach in the three-chambered test, defined as the increase in proportion of time spent in the compartment with an unfamiliar mouse, divided by the proportion of time spent in the compartment with unfamiliar inanimate object. For (b), VPA-treated n = 18, CTRL n = 27. For (f), VPA-treated n = 23 and CTRL n = 26. (c) and (g) show density plot matrices for Eco-HAB housed control and valproate-treated cohorts. Each small square, for which position in the matrix represents one pair of subjects, shows the total time spent together minus the time animals would spend together assuming independent exploration of the apparatus (see 'Materials and methods'). Histograms (d) and (h) show the distribution of this measure for all pairs of valproate-treated and control animals. Data are mean values and error bars represent SEM, *p<0.05, **p<0.01, ***p<0.001 (Mann-Whitney U-test).

DOI: http://dx.doi.org/10.7554/eLife.19532.011
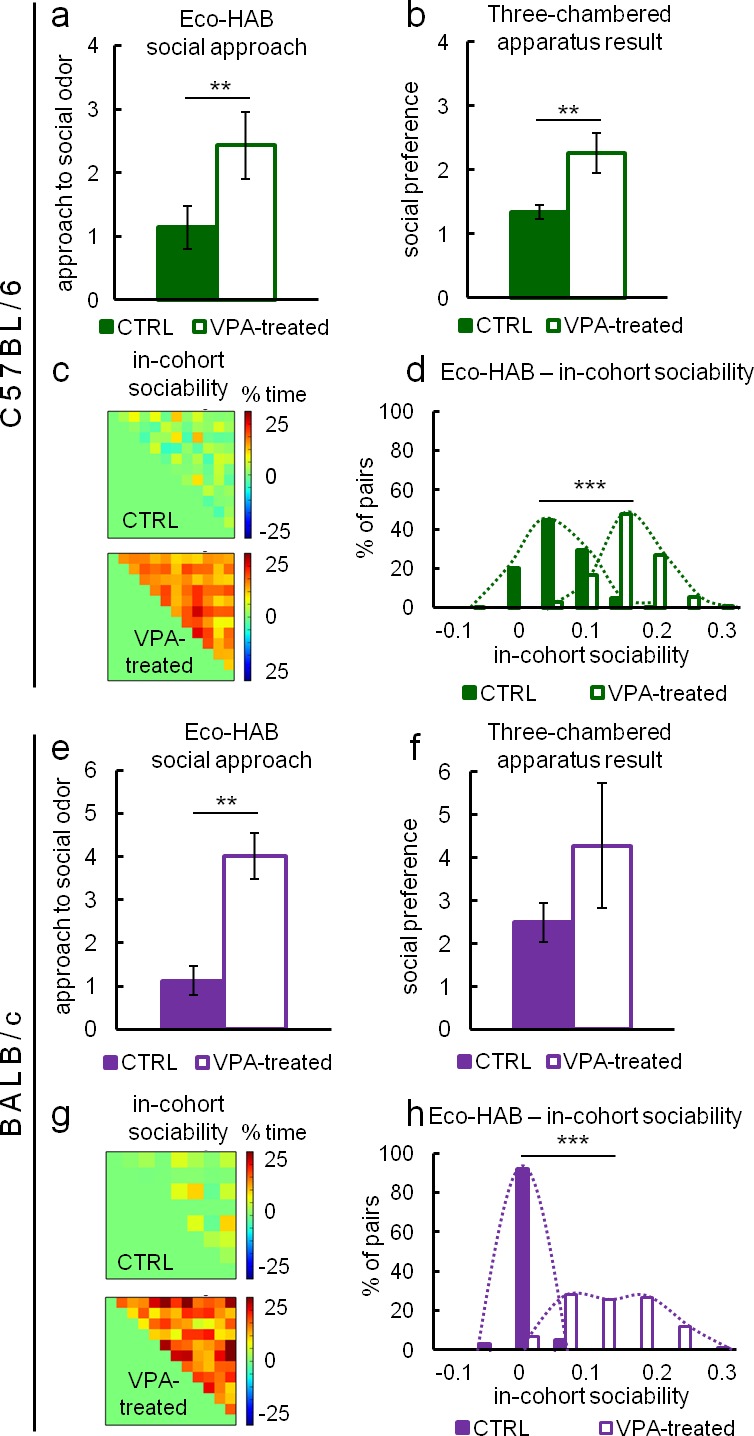
Figure 3—source data 1. Eco-HAB measured social approach and in-cohort sociability of valproate-treated and control C57BL/6 and BALB/c mice.
The names of the Excel sheets refer to corresponding figures and contain data used for analysis of the behavioral measures obtained by the implementation of Eco-HAB.py software (see 'Materials and methods').
DOI: 10.7554/eLife.19532.012
Figure 3—source data 2. Eco-HAB measured social approach and in-cohort sociability of valproate-treated and control C57BL/6 and BALB/c mice.
The names of the Excel sheets refer to corresponding figures and contain data used for analysis of the behavioral measures obtained by the implementation of Eco-HAB.py software (see Materials and methods).
DOI: 10.7554/eLife.19532.013
Figure 3—source data 3. Eco-HAB measured social approach and in-cohort sociability of valproate-treated and control C57BL/6 and BALB/c mice.
The names of the Excel sheets refer to corresponding figures and contain data used for analysis of the behavioral measures obtained by the implementation of Eco-HAB.py software (see Materials and methods).
DOI: 10.7554/eLife.19532.014
Figure 3—source data 4. Eco-HAB measured social approach and in-cohort sociability of valproate-treated and control C57BL/6 and BALB/c mice.
The names of the Excel sheets refer to corresponding figures and contain data used for analysis of the behavioral measures obtained by the implementation of Eco-HAB.py software (see Materials and methods).
DOI: 10.7554/eLife.19532.015

Figure 3.

Figure 3—figure supplement 1. Three-chambered apparatus testing performed on group-housed valproate-treated C57BL/6 (VPA-treated n = 14, CTRL n = 38) (a) and BALB/c (n = VPA-treated n = 15, CTRL n = 17) (b) mice did not reveal any differences in sociability.
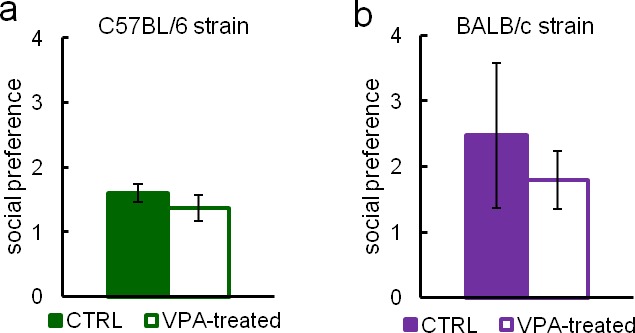
Figure 3—figure supplement 1.

Data are represented as mean ± SEM.
Figure 3—figure supplement 2. Eco-HAB allows for long-term monitoring of responses to social stimuli.
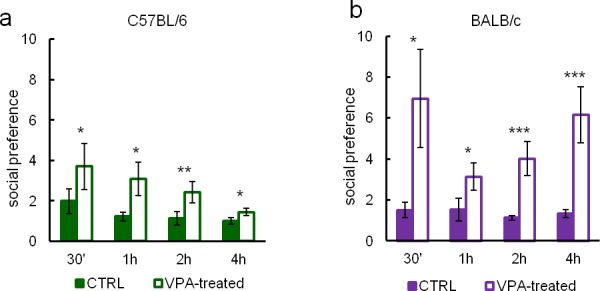
Figure 3—figure supplement 2.

We assessed subjects approach to social odor in four different periods, namely 30’, 1 hr, 2 hr, and 4 hr after the presentation of olfactory stimuli, in order to see how their behavior changes with time. Approach to social odor in (a) valproate-treated C57BL/6 mice (n = 26) gradually decreases during first 4 hr of testing, whereas in (b) valproate-treated BALB/c mice (n = 18) it is high and stable during this time. In control C57BL/6 mice (n = 35) and BALB/c mice (n = 20) approach to social odor gradually decreases with a faster decrease rate in C57BL/6 mice. Data are represented as mean, error bars represent SEM, *p<0.05, **p<0.01, ***p<0.001 (Mann-Whitney U-test).

Even though Eco-HAB data was consistent with the results of manual tests of sociability performed on single-housed animals (see Figure 3A,B and E,F), one must keep in mind that approach behavior or proximity may reflect not only affiliative, but also novelty-seeking, aggressive, or sexual motivation. Thus, a major remaining challenge is to precisely identify the motivation involved in a particular social interaction. This is extremely difficult in one-trial manual experiments, but possible to do in Eco-HAB because of the long monitoring time.

To show that our novel in-cohort measure of sociability agrees with approach to social odor results, we utilized Eco-HAB's capacity to investigate subjects' preferences for spending time together within each cohort (see 'Materials and methods') in VPA animals. Results show that VPA C57BL/6 mice stay together more often than respective controls (Figure 3C,D). The same tendency was found for VPA BALB/c animals (Figure 3G,H).

In view of the conclusions regarding valproate effects, we further used Eco-HAB to test approach to social odor and in-cohort sociability in Fmr1 knockout mice (Figure 4A,B). These mice are a well-established animal model of autism and have repeatedly been reported to display social deficits (Bernardet and Crusio, 2006; Mines et al., 2010; Mineur et al., 2006; Santos et al., 2014; Sidhu et al., 2014). Figure 4A depicts social approach and 4B a histogram of in-cohort sociability as defined previously for Eco-HAB for both Fmr1 knockouts (n = 22) and wild-type controls (n = 18). The Fmr1 knockouts display a lower level of social approach and decreased in-cohort sociability as compared to wild-type. The results clearly confirm the impairment of social behavior in Fmr1 knockouts, as has been observed previously.

Figure 4. Social impairment of Fmr1 knockout mice compared to wild-type control measured in Eco-HAB.
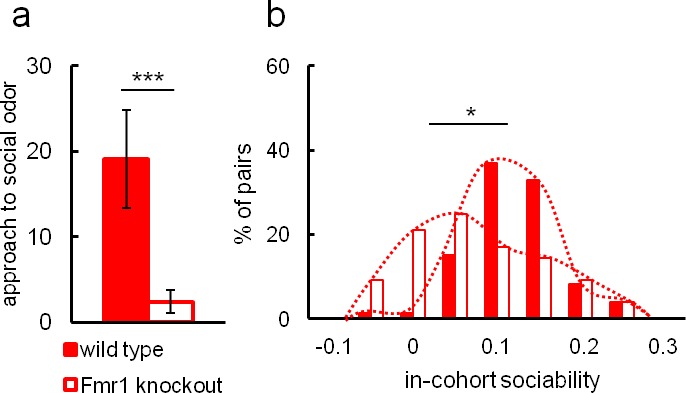
Figure 4.

Fmr1 knockouts, n = 22. Wild-type controls, n = 10. (a) Odor-based social preference in the Eco-HAB system defined as the increase in proportion of time spent in the compartment with social odor during the first hour after its presentation, divided by the proportion of time spent in the compartment with non-social stimulus. Histogram (b) shows the distribution of in-cohort sociability for all pairs of knockout and control animals. Data are mean values and error bars represent SEM, *p<0.05, **p<0.01, ***p<0.001 (Mann-Whitney U-test).

DOI: http://dx.doi.org/10.7554/eLife.19532.018

Figure 4—source data 1. Eco-HAB measured social approach and in-cohort sociability of Fmr1 knockouts and wild-type controls.
The names of the Excel sheets refer to corresponding figures and contain data used for analysis of the behavioral measures obtained by the implementation of Eco-HAB.py software (see 'Materials and methods').
DOI: 10.7554/eLife.19532.019
Figure 4—source data 2. Eco-HAB measured social approach and in-cohort sociability of Fmr1 knockouts and wild-type controls.
The names of the Excel sheetsrefer to corresponding figures and contain data used for analysis of the behavioral measures obtained by the implementation of Eco-HAB.py software (see 'Materials and methods').
DOI: 10.7554/eLife.19532.020

Reproducibility of Eco-HAB data

Since replication failure is one of the main issues in conventional tests of social behavior, to illustrate reproducibility of Eco-HAB’s measures, we compared individual scores of social odor approach for all mice within 10 cohorts of VPA-treated and control BALB/c mice (Figure 5A, 20 VPA-treated and 18 controls), another 10 cohorts of C57BL/6 mice (Figure 5B, 26 VPA-treated and 35 controls), as well as 4 cohorts of Fmr1 knockout (n = 22) and wild-type animals (n = 18, Figure 5C).

Figure 5. Eco-HAB provides reproducible assessment of approach to social odor in group-housed mice.
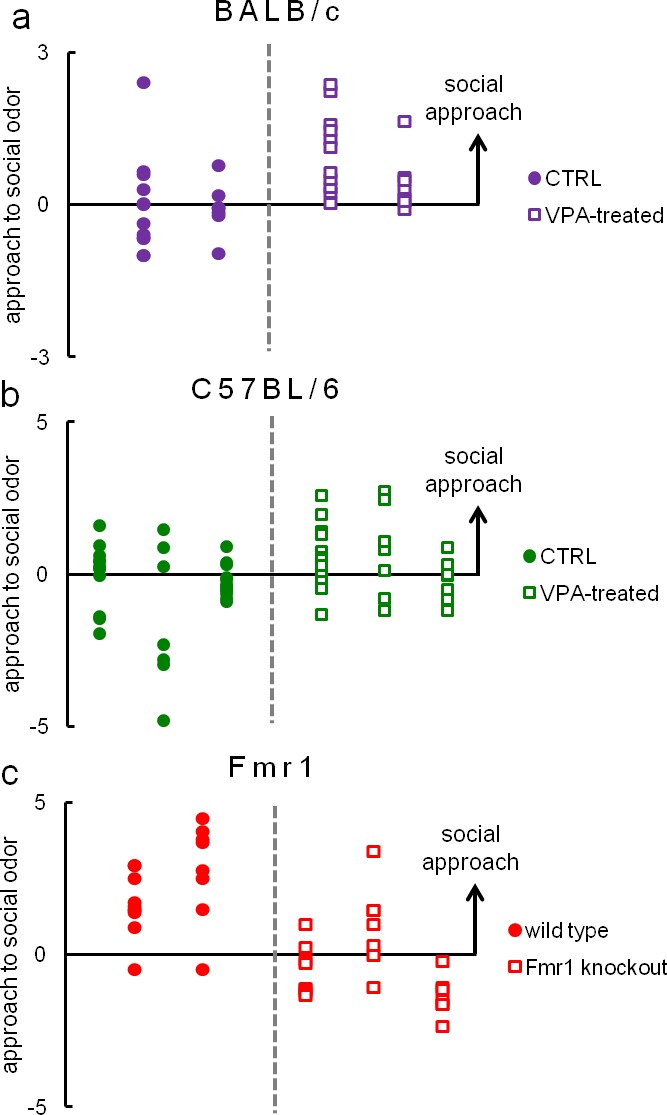
Figure 5.

Individual results of approach to social odor for all cohorts of (a) valproate-treated (n = 20) and control (n = 18) BALB/c subjects (4 cohorts), (b) valproate-treated (n = 26) and control (n = 35) C57BL/6 mice (6 cohorts) and (c) Fmr1 knockouts (n = 22) and wild-type (n = 18) animals (5 cohorts). Each column represents one cohort of animals, while data points (dots and squares) represent scores of particular mice. Since the measure of approach to social odor is a proportion (for detailed description see 'Materials and methods'), which may take values from 0 to +∞, we present logarithmic data to depict reproducibility of social preference and social avoidance in an unbiased manner. All analyses, including statistical testing, were performed on raw data. Average results of these data are presented in Figures 3A,E and 4A, respectively.

DOI: http://dx.doi.org/10.7554/eLife.19532.021

Figure 5—source data 1. Eco-HAB measured social approach score for valproate-treated and control C57BL/6 and BALB/c mice and Fmr1 knockouts and wild-type controls.
These data are identical to Figure 3A—source data 1, Figure 3E—source data 3, Figure 4A—source data 1 with respect to Figures 3A,E and 4A and are available as a separate file for the readers’ convenience.
DOI: 10.7554/eLife.19532.022
Figure 5—source data 2. Eco-HAB measured social approach score for valproate-treated and control C57BL/6 and BALB/c mice and Fmr1 knockouts and wild-type controls.
These data are identical to Figure 3A—source data 1, Figure 3E—source data 3, Figure 4A—source data 1 with respect to Figures 3A,E and 4A and are available as a separate file for the readers’ convenience.
DOI: 10.7554/eLife.19532.023
Figure 5—source data 3. Eco-HAB measured social approach score for valproate-treated and control C57BL/6 and BALB/c mice and Fmr1 knockouts and wild-type controls.
These data are identical to Figure 3A—source data 1, Figure 3E—source data 3, Figure 4A—source data 1 with respect to Figures 3A,E and 4A and are available as a separate file for the readers’ convenience.
DOI: 10.7554/eLife.19532.024

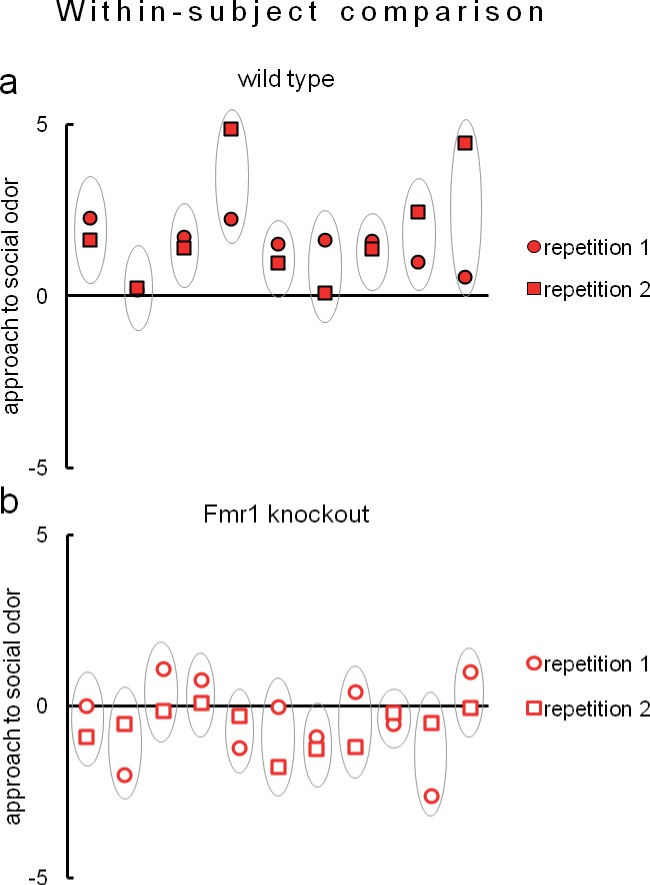
Due to evident deficits of social behavior in Fmr1 knockouts, we chose this model to further investigate predictability of phenotyping performed under different environmental conditions. To that end we repeated evaluation of sociability in Fmr1 knockout animals and respective controls in another laboratory. Results confirm social impairments of Fmr1 knockouts and show that both standardized Eco-HAB measures, approach to social odor (Figure 6) and in-cohort sociability (Figure 7) were highly reproducible in those two independent studies. Further, to test if the individual sociability measure – approach to social odor – is stable in particular subjects, we performed two subsequent replications of Eco-HAB testing in the same cohorts of Fmr1 knockout and wild-type mice. Experiments were separated by a 10-day period of regular housing. Within-subject comparison (Figure 8) reveals high reproducibility of sociability assessment in particular subjects over time. Taken together, these studies show that Eco-HAB is a reliable tool that is reproducible for a number of tasks, from assessment of individual sociability, through phenotyping of subsequent cohorts of mice, to cross-laboratory comparisons.

Figure 6. Assessment of approach to social odor in Fmr1 knockouts and respective littermate controls performed in two different laboratories.
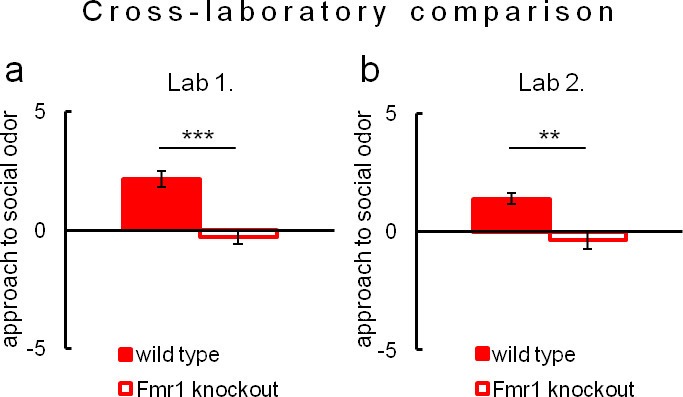
Figure 6.

(a, Fmr1 knockout n = 22, wild-type control n = 18) vs. (b, Fmr1 knockout n = 11, wild-type control n = 9). Regardless of experimental environment, evaluation carried out in Eco-HAB revealed comparable impairment in Fmr1 knockouts. Presented data are logarithmic values.

DOI: http://dx.doi.org/10.7554/eLife.19532.025

Figure 6—source data 1. We include source data for Figures 6, 7 and 8 concerning reproducibility results of both Eco-HAB measures.
The names of the Excel sheets refer to corresponding figures and contain data used for analysis of the behavioral measures obtained by the implementation of Eco-HAB.py software (see 'Materials and methods').
DOI: 10.7554/eLife.19532.026
Figure 6—source data 2. We include source data for Figures 6, 7 and 8 concerning reproducibility results of both Eco-HAB measures.
The names of the Excel sheetsrefer to corresponding figures and contain data used for analysis of the behavioral measures obtained by the implementation of Eco-HAB.py software (see Materials and methods).
DOI: 10.7554/eLife.19532.027

Figure 7. Evaluation of in-cohort sociability in Fmr1 knockouts and wild-type littermate controls undertaken in two different laboratories.
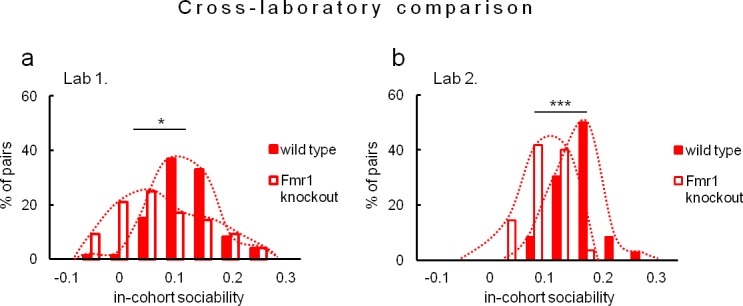
Figure 7.

(a, Fmr1 knockout n = 22, wild-type control n = 18) vs. (b, Fmr1 knockout n = 11, wild-type control n = 9) – gives corresponding results. A histogram illustrating score of Fmr1 knockouts is shifted to the left as compared to that for wild-type control, signifying less time voluntarily spent together with other subjects within a tested cohort.

DOI: http://dx.doi.org/10.7554/eLife.19532.028

Figure 7—source data 1. We include source data for Figures 6, 7 and 8 concerning reproducibility results of both Eco-HAB measures.
The names of the Excel sheetsrefer to corresponding figures and contain data used for analysis of the behavioral measures obtained by the implementation of Eco-HAB.py software (see Materials and methods).
DOI: 10.7554/eLife.19532.029
Figure 7—source data 2. We include source data for Figures 6, 7 and 8 concerning reproducibility results of both Eco-HAB measures.
The names of the Excel sheetsrefer to corresponding figures and contain data used for analysis of the behavioral measures obtained by the implementation of Eco-HAB.py software (see Materials and methods).
DOI: 10.7554/eLife.19532.030

Figure 8. Eco-HAB allows remarkably reproducible assessment of approach to social odor in both (a) wild-type mice (n = 9) and (b) Fmr1 knockouts (n = 11).

Figure 8.

Evaluation of social behavior of subjects was repeated twice in identical Eco-HAB experiments, separated by a 10-day period of regular housing. Each aligned dot and square encircled by an oval represent individual score of approach to social odor for each tested mouse, measured in two subsequent experimental repetitions. Dots are data, while the ovals serve to guide the eye. Data presented are logarithmic values.

DOI: http://dx.doi.org/10.7554/eLife.19532.031

Figure 8—source data 1. We include source data for Figures 6, 7 and 8 concerning reproducibility results of both Eco-HAB measures.
The names of the Excel sheetsrefer to corresponding figures and contain data used for analysis of the behavioral measures obtained by the implementation of Eco-HAB.py software (see Materials and methods).
DOI: 10.7554/eLife.19532.032
Figure 8—source data 2. We include source data for Figures 6, 7 and 8 concerning reproducibility results of both Eco-HAB measures.
The names of the Excel sheetsrefer to corresponding figures and contain data used for analysis of the behavioral measures obtained by the implementation of Eco-HAB.py software (see Materials and methods).
DOI: 10.7554/eLife.19532.033

Eco-HAB measurement is unbiased by social hierarchy and allows for long-term monitoring of social behavior

Social hierarchy, occurring in group-housed mice, could interfere with social behavior measures. For example, dominant mice may occupy territories and restrict the exploration of others. To test this hypothesis, following Eco-HAB testing, we performed a U-tube dominance test (Lindzey et al., 1961). In this test, mice were repeatedly placed facing another mouse from a tested cohort in a narrow tube. We show that winner/loser scores were not associated with activity-based exploration of the available territory (Figure 9).

Figure 9. Tube dominance score of an animal does not correlate with overall activity in Eco-HAB apparatus.

Dominance is expressed as percentage of won encounters ('winning score percent') in the U-tube dominance test (see 'Materials and methods'). Activity in Eco-HAB is defined as the number of visits to all of its compartments during the first 12 hr of the habituation period. Social hierarchy does not correlate with exploration of the territory in either of the tested groups: (a) control (n = 23) or (b) valproate-treated C57BL/6 mice (n = 26), (c) control (n = 32) or (d) valproate-treated BALB/c mice (n = 19). Dependence between two variables tested by Pearson product-moment correlation coefficient.

DOI: http://dx.doi.org/10.7554/eLife.19532.034
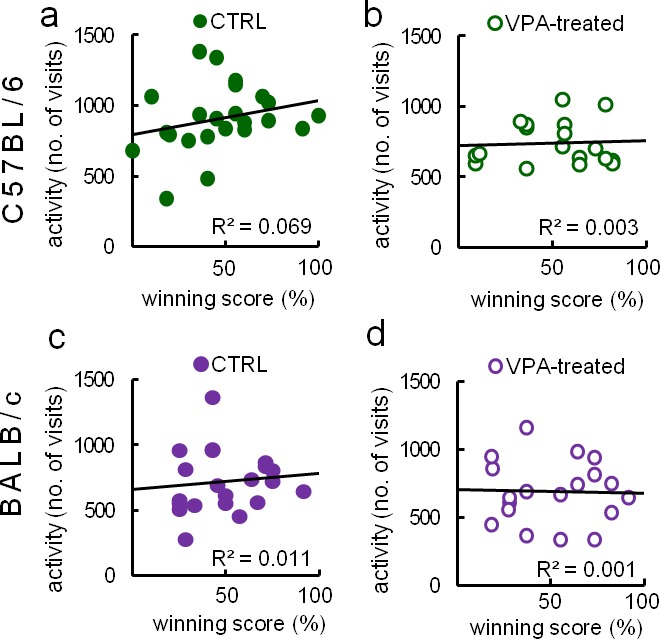
Figure 9—source data 1. Raw data from U-tube dominance test and Eco-HAB measured activity (number of visits to all compartments of the apparatus during 1st 12-hr period of adaptation).
Figure 9 depicts correlation between those two variables.
DOI: 10.7554/eLife.19532.035
Figure 9—source data 2. Raw data from U-tube dominance test and Eco-HAB measured activity (number of visits to all compartments of the apparatus during 1st 12 hr period of adaptation).
Figure 9 depicts correlation between those two variables.
DOI: 10.7554/eLife.19532.036

Figure 9.

Figure 9—figure supplement 1. Aggressive interactions during testing in Eco-HAB are rare regardless of the tested strain.
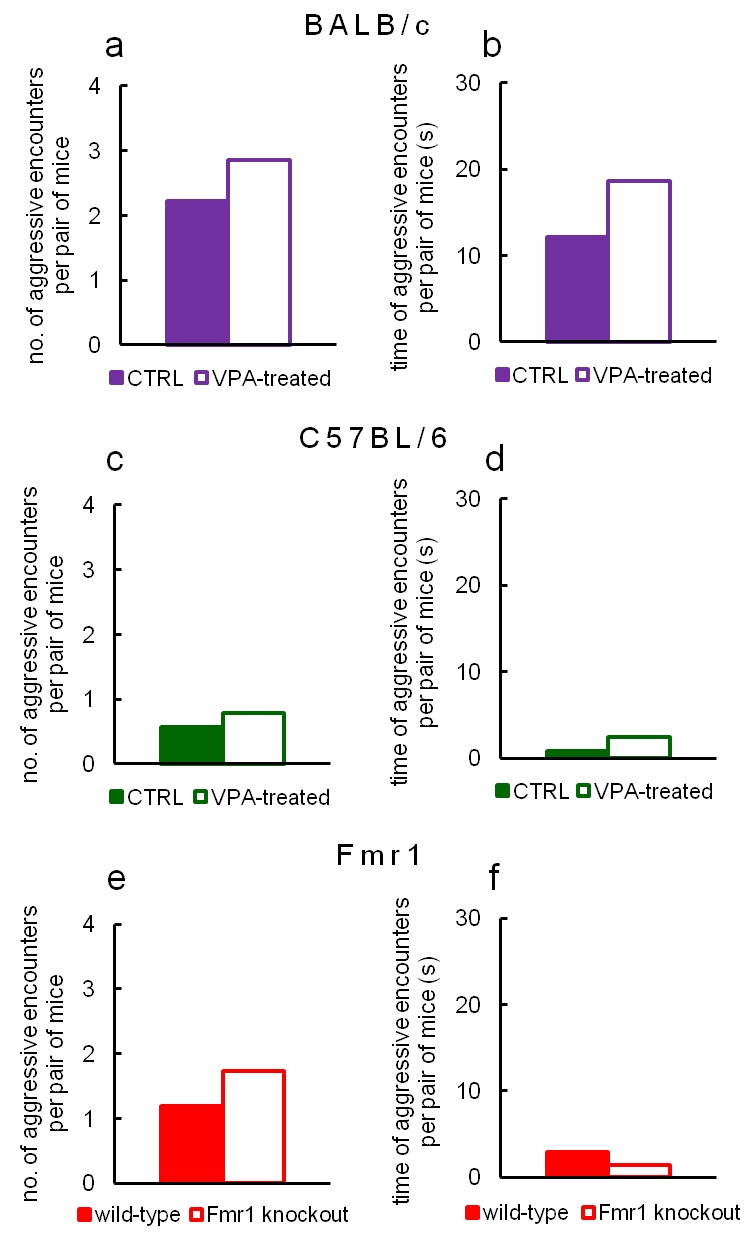
Figure 9—figure supplement 1.

Number of episodes and duration of aggressive behaviors in VPA-treated and control BALB/c (a, b), VPA-treated and control C57BL/6 (c, d) and Fmr1 knockout and wild-type mice (e, f) during first 6 hr of adaptation phase, as counted per each pair of animals within a tested cohort. Aggressive encounters, namely fighting, chasing and biting were quantified by manual video-based scoring and then divided by the number of mouse pairs in a given cohort.

Conclusion

Eco-HAB is an open-source system which combines novel elements to provide low-stress experimental settings for high-throughput, automatic testing of conspecific-related behavior in mice. The testing environment is spacious, resembles the natural habitat of mice, and exploits innate behavioral patterns of this species to test relevant aspects of mouse sociability. Unlike short-term assessment using manual tests, Eco-HAB allows for long-term monitoring of social behaviors. Importantly, data collected in Eco-HAB show that the dynamics of response to social stimuli may differ depending on the tested strain of mice (see Figure 3—figure supplement 2).

Individual tracking with RFID technology allows testing of group-housed animals without human handling – the most important confounding factor in manually conducted tests. In contrast, manual methods have so far allowed for testing isolated animals in relatively small cages in an environment unfamiliar to tested subjects. Existing automated systems, even though technologically advanced and applicable for collection of large datasets, either lack ecological pertinence or are not suitable for assessment of relevant social behaviors in mice. All these problems are addressed by Eco-HAB.

In contrast to available open-arena set-ups, the apparatus we constructed allows mice to display their natural affiliation patterns. As shown by Weissbrod et al. (2013), open-arena testing entails frequent display of aggressive behaviors such as chasing or fighting. Based on knowledge from this and similar studies (de Chaumont et al., 2012; Shemesh et al., 2013), we concentrated on creating an environment that would reduce these types of interactions in order to study different types of social behavior, namely stable affiliations among mice of the same sex. The separate and dispersed sub-territories of the Eco-HAB, resembling borrows inhabited by mice in the wild, alleviate extensive territorial fighting (see Figure 9—figure supplement 1) and prompts animals to form sub-groups in accordance with their natural preferences.

Experiments with larger groups of animals in an undisturbed setting provide access to information unavailable when isolated animals are tested. In addition to providing a platform for measuring in-cohort sociability and scent based social approach, the Eco-HAB and its associated software has proven very useful for in-depth analysis of individual social behaviors. Heat maps of mouse pair interactions may be used to identify more and less social individuals – data useful for comparison with other measures (i.a. individual differences in specific genes or neural markers). Heat maps may also reveal particular littermate affinities or be used to assess stable affiliations between mates or same-sex peers. One can also envision performing experiments on sub-groups of treated/untreated co-housed mice, where differences could be assessed within a single testing session. Compared to testing experimental and control groups separately, experiments on relevant populations allow evaluation of whether the social environment is an essential factor influencing littermate-related behavior. One can also envision expanding these measurements beyond mice to include other rodents, such as prairie or meadow voles.

A noteworthy asset of the Eco-HAB apparatus is the free, custom software which aids in obtaining effective measurements and speeds up data analysis. Appropriate programs were created for the purpose of data collection and conversion as well as in-depth evaluation of social behaviors. This code is open source and can be expanded to encompass new analyses. Assessing reliability of different behavioral measures, we chose the most valid. Nevertheless, in the present form, our system does not allow for the recognition of particular types of subtle littermate-related behaviors that might skew results such as having two animals in the same chamber but facing away from each other and not interacting. While it is not possible to distinguish different types of social interactions yet, casual observations of video recordings obtained during numerous experiments lead us to believe that such events are rather accidental.

In summary, compared to manual tests of sociability, our system provides more reliable data, faster, and with less manpower for several key behavioral measures.

Materials and methods

Animals

Animals were treated in accordance with the ethical standards of the European Union (directive no. 2010/63/UE) and Polish regulations. All experimental procedures were pre-approved by the Local Ethics Committee. Valproate-treated mice of C57BL/6 and BALB/c strains as well as Fmr1 knockout mice of the FVB strain (RRID:IMSR_JAX:008909) and all respective littermate controls were bred in the Animal House of the Faculty of Biology, University of Warsaw.

The effects of prenatal exposure to valproic acid (VPA) were assessed for C57BL/6 and BALB/c strains of animal. To do this, mice were mated with other mice of the same strain and pregnancy was confirmed by the presence of a vaginal plug on embryonic day 0 (E0). On E13, pregnant females received a single subcutaneous injection of 600 mg/kg VPA (Sigma-Aldrich) dissolved in saline. The concentration of the drug in saline was 58–63 mg/ml. The volume of the injected fluid was < 0.35 ml to facilitate proper absorption of the solution. Behavioral experiments were performed in male 2.5- to 5-month-old offspring. Animals’ age was balanced across experimental conditions.

Depending on the experiment, animals were group or single housed with a 12 hr/12 hr light/dark cycle with water and food provided ad libitum. In housing and experimental rooms, the temperature was maintained at 23–24°C with humidity levels between 35% and 45%. In order to reduce aggression in BALB/c group-housed males, we enriched the pre-experimental environment and utilized rat-sized cages to help decrease territorial behaviors. Overtly aggressive BALB/c males were removed from the group cages and were not used in further procedures. As male mice of FVB strain are extremely territorial, it was difficult to eliminate aggressive behaviors that occurred in group-housing. For that reason, only female Fmr1 knockouts and littermate controls (2.5- to 4-month-old) were utilized in behavioral experiments. Animals’ age was balanced across experimental conditions.

The multiplicities of the animal cohorts were chosen following our previous work (Puścian et al., 2014), in which we determined optimal parameters for the measurement of spontaneous reward-motivated behavior in socially enriched environments and we discussed the number of biological replications required to establish whether a given behavioral parameter is sufficiently reproducible. In the present study, we performed all the analyses in accordance with our previous findings and taking into account the area of Eco-HAB system.

Three-chambered apparatus testing

This assay consisted of an experimental box (length – 620 mm, width – 425 mm, height – 250 mm) divided into three equally sized areas. The middle area was object free, while the side areas contained either a social or a non-social stimulus placed in small steel cages (length - 95 mm, width - 95 mm, height - 105 mm). The protocol for assessment of social preference consisted of three sessions: exploration of the middle chamber, exploration of the side-chambers with empty steel cages, and a testing session when social and non-social stimuli were presented. Each session lasted 10 min and was video-recorded. For these experiments, the social stimulus was an unfamiliar mouse of the same strain, sex, and age while the non-social stimulus was a novel blue plastic laboratory bottle cap.

For the purpose of obtaining reliable, undistorted measurements of social preference, a number of steps were taken to minimize stress in the tested animals. Mice were habituated to the experimenter and handling procedures for 14 days prior to testing. All animals used as social stimuli were also subjected to the sham experimental procedure (sitting inside of the steel cage placed in one of the side chambers for 10 min) for 7 days prior to testing day. Transportation of the subjects always took place at least 1 hr before the beginning of the experiment. Procedures were observed and remotely recorded by the experimenter from a separate room to minimize human interference with behavior. Finally, all tests were performed in dimmed light conditions (4–5 lux as measured at the bottom of the apparatus).

We excluded data from the analysis corresponding to the situation in which an animal had not visited both side chambers in either adaptation or social preference testing phase. In other words, we discarded those rare cases in which the animals’ locomotor activity was extremely low. In the course of a 3-year period, we performed at least two biological replications of the three-chambered apparatus testing of each experimental and control group.

Tube dominance test

A dominance test (Lindzey et al., 1961) was performed in a U-shaped tube (length – 800 mm, diameter – 33 mm) whose diameter was sufficiently small to prevent animals from turning while inside of it. Two subjects were simultaneously released into the tube at opposite ends and allowed to compete head-to-head until the more dominant subject completely pushed its opponent out of the tube. Forcing the other mouse out of the tube with all four paws was defined as winning. All animals subjected to the procedure were tested in a round-robin system (on average 10 parings per subject) against fellow members of their previously Eco-HAB tested cohort. A dominance score for each individual was calculated as a percentage of confrontations won.

Eco-HAB – apparatus construction

All elements were either made of Plexiglass (tube-shaped corridors, perforated partitions) or polycarbonate (housing compartments). Housing compartments (length – 250 mm, width – 250 mm, height – 150 mm) had round bottom edges (as in standard housing cages) and two neighboring sidewalls of each compartment were equipped with holes (diameter – 420 mm and 50 mm from the bottom of the compartment) for corridors. Tube-shaped corridors had the following dimensions: length – 300 mm, inner diameter – 40 mm, outer diameter 420 mm. Perforated partitions were rectangular in shape (width – 115 mm, height – 150 mm) with round bottom edges. Perforations were vertical, rectangular shaped, had soft edges, and began 10 mm above the bottom of the cage. Perforations had the following dimensions: height – 130 mm, width 5 mm, with equal 10 mm spacing between perforations. Circular antennas were placed around corridors 40–60 mm from the side walls of housing compartments. Square, stainless steel lids (250 mm long and wide) were fitted for tops of the housing compartments. The two lids placed above the compartments containing perforated partitions were flat, whereas the other two had grid trays for food and water bottles. Illumination levels were standardized between all compartments in an effort to reduce light impact on mouse activity. In the compartments with perforated partitions, light intensity was maintained between 79 and 84 lux. In the compartments equipped with food and water, light intensity was between 18 and 25 lux in shadowed areas and between 75 and 80 lux in non-shadowed areas. It is worth mentioning that the Eco-HAB design is easily scalable. With the exception of RFID coils, whose size needs to be adjusted in accordance to the corridor diagonal, there is no need to change applied electronics or software should one want to adapt the system for species other than mice.

Eco-HAB testing

To individually identify animals in Eco-HAB, all mice were subcutaneously injected with glass-covered microtransponders (9.5 mm length, 2.2 mm diameter, RFIP Ltd) under brief isoflurane anesthesia. Microtransponders emit a unique animal identification code when in range of RFID antennas. After injection of transponders, subjects were moved from the housing facilities to the experimental rooms and adapted to the shifted light/dark cycle of their new environment (the dark phase shifted from 20:00 – 8:00 to 13:00 – 01:00 or 12:00 – 24:00 depending on summer/winter UTC+01:00). For 2 to 3 weeks prior to the behavioral testing, subjects were housed together and grouped appropriately for their respective experiment.

Cohorts consisting of 7 to 12 mice were subjected to 72-hr Eco-HAB testing protocols divided into an adaptation phase (48 hr) and odor-based social preference (approach to social odor) testing phase (24 hr) with access to food and water unrestricted throughout. During the adaptation phase, mice could freely explore all compartments. During the social preference testing phase, olfactory stimuli including either bedding from the cage of an unfamiliar mouse of the same strain, sex and age (novel social scent) or fresh bedding from a different room (novel non-social scent), were presented. Olfactory stimuli were simultaneously placed behind the perforated partitions of opposite testing compartments (see Figure 1). Mice could freely explore both testing compartments for 24 hr. Values from the first hour after presentation of the stimulus were used for statistical analysis. We excluded data from the analysis corresponding to the situation in which an animal had not visited chambers where olfactory stimuli had been presented in either adaptation or odor-based social preference testing phase, i.e. we discarded those rare cases in which the animals’ locomotor activity was extremely low. In the course of a 2-year period, we performed at least two biological replications of Eco-HAB testing of each experimental and control group. Although the protocol utilized here lasted 72 hr, it is noteworthy that, when required, Eco-HAB can run continuously even for months with only short technical breaks for cage cleaning (every 7 days). The cages are not connected to the IVC system, so air exchange is not an issue. Moreover, any kind of olfactory stimuli may be presented behind perforated partitions, enabling experimenters to investigate matters such as motivational conflicts (e.g. when animals are allowed to choose between sniffing an odor related to food or the scent of a female).

Eco-HAB – applied electronic solutions

The RFID system for accurately logging mouse position (block schematic diagram presented in Figure 1—figure supplement 5) operates as follows: once an RFID chip (microtransponder) arrives in the proximity of a particular antenna (RFID coil in Figure 1—figure supplement 5), the corresponding RFID receiver decodes the message from the chip and then passes it to a microcontroller. The microcontroller extracts the ID number from the decoded message and transmits it via USB to a computer. The computer receives data packets, including ID numbers, from each antenna via virtual serial ports, and writes them to file using dedicated software described in the next section.

The RFID system for Eco-HAB consists of eight RFID receivers working at a frequency of 125 kHz. The system is based on COTS modules plugged into bread boards. The RFID reader module (UN-MOD3) uses an EM4095 receiver coupled to an ATTINY AVR microcontroller. The microcontroller controls the receiver via SPI interface and extracts the ID number of the RFID transponder. This number is then transmitted to the serial-to-USB transceivers via UART. The computer recognizes the transceivers as virtual ports. Since, by default, all RFID receivers work asynchronously with local ceramic oscillators, they interfere with each other and end up disabling operation of the system. To avoid this, the output of a 4 MHz crystal oscillator powered by 5V is distributed to all EM4095 IC clock inputs. All USB to serial modules are attached to an USB hub, which also supplies their power.

To assess the efficiency of the implemented RFID antennas, we compared the Eco-HAB recognition system with manual video-based scoring. We have assessed the number of antenna crossings during the first 6 hr period of the dark phase at the beginning of the adaptation phase, when animals are most active and intensely explore a new environment. Videos were recorded in complete darkness. A source of infra-red light placed above the apparatus was used to illuminate the field of view. Measurements were repeated twice on two independently tested cohorts of mice for the purpose of more reliable assessment. Based on these measurements, we concluded that the implemented system of coils can recognize subjects with high sensitivity, far exceeding that obtained with standard video-recognition methods. Due to the built-in internal synchronization system, RFID antennas run independently and do not disrupt each other. All eight coils may be activated simultaneously for an unlimited time.

Eco-HAB.rfid – software package for data collection

Eco-HAB.rfid software is able to simultaneously receive and process transponder codes from up to eight RFID antennas. The software defines the end of the read-out as a period of more than 210 ms without a transponder code transmitted to the computer. Eco-HAB.rfid records all read-outs in a plain text file with tab separated columns. Each line consists of an event number, date, time (ms), number of the activated RFID antenna, duration of the transponder read-out (ms), unique transponder code (14 digits), and tag name (if specified in a separate text file – rfid_tags.txt). For the convenience of further data analysis, a single output file contains data from exactly 1 hr of the system's operation. All files are automatically named and saved to an assigned hard drive. Eco-HAB.rfid is written in Delphi programming language and compiled with Borland Delphi 7.0 (Embarcadero Technologies) using ComPort Library ver. 4.11.

Eco-HAB.py – software package for data processing and analysis

Along with the behavioral assessment system, we designed and created a software package for analyzing data collected by Eco-HAB.rfid software written in the Python programming language (Python 2.7 with NumPy and SciPy libraries). It consists of functions for loading and merging raw data previously stored on the hard drive as well as for converting this data into a series of visits (referred to here as sessions) of each mouse to each of the four Eco-HAB compartments.

Data processing algorithm

For a mouse to be considered to have spent time in a given compartment, it must first enter and then exit that compartment. The time interval between entrance and exit is its residence time in the area. Occasionally, mice pass an antenna too swiftly to trigger a recordable event or pass swiftly through a compartment without lingering. The following filtering procedure was used to automatically account for these types of occasions:

  1. For each pair of events the following conditions are checked:

  2. Events are considered pairwise in consecutive order, e.g., first (e1, e2), then (e2, e3), and so on until (eN-1, eN).

  3. For each mouse we make a list of all events e1, e2,... eN.
    1. If the time between the two events is less than a given threshold (we used 2 s), the pair is skipped. Such signals are either multiple readings of a transponder by the same antenna (an animal lingering under an antenna) or events triggered by an animal running through a compartment rather than staying in it.
    2. If both events were recorded at the same antenna, and the time between them is greater than the threshold, we determine that the mouse spent that time in the nearest compartment (the animal entered a compartment and left through the same corridor).
    3. If both events were recorded in the same corridor, the pair is skipped. This indicates an animal moving through a corridor.
    4. If the two events were recorded in two different corridors adjacent to a compartment, this indicates that the mouse spent the intervening time in the connecting compartment.
    5. If the two events were recorded in the opposite (parallel) corridors, the pair is skipped. This is a very rare event (<0.6% of pairs above the 2-s threshold) because it can only happen if a mouse passes at least two antennas unnoticed.

The goal of this algorithm is to produce a list of sessions having associated start times, end times, compartment numbers, RFID transponder numbers, and a flag indicating whether antennas registered were consecutive or not. All ambiguous events (those found in steps 3a or 3e) are filtered out, leaving a final list of reliable events for further analysis.

Using the scripts

To facilitate data loading and processing, Python scripts EcoHab.py and ExperimentConfigFile.py are provided. Three classes are defined in these scripts: EcoHabData, EcoHabSessions, and ExperimentConfigFile.

Raw text data files are loaded and merged into an EcoHabData object:

ehd = EcoHabData(path_to_data)

Once the object is created, various attributes of the raw data can be accessed. For instance, if mice is a list of one or more transponder numbers, then the list of antennas which detected them can be retrieved using ehd.getantennas(mice) and the times at which they were detected (event times) can be retrieved using ehd.gettimes(mice).

An EcoHabSessions object, containing the sessions of animals in Eco-HAB compartments, is created from an EcoHabData object:

ehs = EcoHabSessions(ehd)

This generates the list of sessions using the data processing algorithm described above. In this new, filtered data object, specific attributes of the sessions can be retrieved. The functions ehs.getaddresses(mice), ehs.getstarttimes(mice), ehs.getendtimes(mice), and ehs.getdurations(mice) return compartment numbers, start times, end times, and durations of sessions, respectively. Data from specific time intervals can be selected by the masking function ehs.mask_data. For example, calling ehs.mask_data(t1, t2) retrieves only those sessions starting after t1 and before t2. It is often convenient for an experimenter to mask data according to specific, well-defined experimental phases. Rather than having to calculate and remember numerical time values at which a given phase started and stopped for numerous phases across many experiments, these values can be quickly defined in a text file. This file can be then used to mask multiple data sets according to easily remembered phase names. Such a file is named config.txt and contains start and stop points for each phase an experimenter wishes to define in the following format:

[ADAPTATION - 1. dark phase]

startdate = 16.02.2015

starttime = 12:00

enddate = 17.02.2015

endtime = 00:00

Once such a configuration file has been made, it can be read using the ExperimentConfigFile class:

cf = ExperimentConfigFile(path_to_data)

The configuration object cf can now be used for masking data:

ehs.mask_data(*cf.gettime('ADAPTATION - 1. dark phase'))

This will limit future responses to sessions starting during the 'ADAPTATION - 1. dark phase' and provides a powerful tool for automated processing of multiple data sets. Both scripts for data analysis together with an example data set are provided in Materials and methods.

Approach to social odor

To calculate the approach to social odor of a given animal, total time spent in the compartment containing a social olfactory stimulus, TS, and total time spent in the compartment with a non-social olfactory stimulus, TnS, are separately calculated for a select time bin following presentation of olfactory cues. Similar values, tS and tnS, are then calculated for a time bin selected from the last dark phase before presentation of stimuli (baseline conditions). The approach to social odor was then calculated as the ratio of TS/TnS to tS/tnS.

In-cohort sociability

The in-cohort sociability of each pair of mice within a given cohort is a measure of sociability that is unique to Eco-HAB system. For a particular pair of subjects, animal a and animal b, we first calculate the times spent by the mice in each of the four compartments during a chosen experimental period: ta1, ta2, ta3, ta4 for animal a, and tb1, tb2, tb3, tb4 for animal b. The total time spent by the pair together in each of the cages is also calculated: tab = tab1 + ;tab2 + tab3 + tab4. All times are normalized by the total time of the analyzed segment, so that each of the quantities fall between 0 and 1. The in-cohort sociability (Figure 1—figure supplement 2c) is then defined by tab - (ta1*tb1 + ta2*tb2 + ta3*tb3 + ta4*tb4), which is the total time spent together (Figure 1—figure supplement 2a) minus the time animals would spend together assuming independent exploration of the apparatus (Figure 1—figure supplement 2b).

Measurement of aggressive encounters in Eco-HAB

We assessed the number and cumulative time of aggressive encounters (fighting, chasing and biting) for every strain tested in Eco-HAB by manual video-based scoring. Behaviors were measured during the first 6 hr period of the dark phase at the beginning of the adaptation period. This is the time when animals are most active, intensely exploring their new environment, and when aggressive behaviors were most probable as unstable social relations on novel territory are being tested by the animals.

Statistical analysis

Statistical analyses of raw data were performed with Statistica 8.0 (StatSoft) and GraphPad Prism6 software. None of the presented datasets met the criteria for parametric analyses and were therefore subjected to non-parametric testing with the Mann-Whitney U-Test. The criterion for statistical significance was a probability level of p<0.05.

Acknowledgements

We are thankful to Thomas G Custer, Ksenia Meyza and Krzysztof Turzynski for critical reading of the manuscript and to Karolina Rokosz for advising us on figures’ design.

Funding Statement

The funders had no role in study design, data collection and interpretation, or the decision to submit the work for publication.

Funding Information

This paper was supported by the following grants:

  • Swiss Contribution to the enlarged European Union PSPB-210 to Alicja Puścian, Hans-Peter Lipp, Ewelina Knapska.

  • Narodowe Centrum Nauki 2013/08/W/NZ4/00691 to Szymon Łęski, Grzegorz Kasprowicz, Ewelina Knapska.

Additional information

Competing interests

The authors declare that no competing interests exist.

Author contributions

AP, Conception and design, Acquisition of data, Analysis and interpretation of data, Drafting or revising the article, Critically read and approved the final version of the manuscript.

SŁ, Conception and design, Analysis and interpretation of data, Critically read and approved the final version of the manuscript.

GK, Acquisition of data, Critically read and approved the final version of the manuscript.

MW, Acquisition of data, Critically read and approved the final version of the manuscript.

JB, Acquisition of data, Critically read and approved the final version of the manuscript.

TN, Acquisition of data, Critically read and approved the final version of the manuscript.

PMB, Acquisition of data, Critically read and approved the final version of the manuscript.

H-PL, Drafting or revising the article, Critically read and approved the final version of the manuscript.

EK, Conception and design, Analysis and interpretation of data, Drafting or revising the article, Critically read and approved the final version of the manuscript.

Ethics

Animal experimentation: Animals were treated in accordance with the ethical standards of the European Union (directive no. 2010/63/UE) and Polish regulations. All experimental procedures were pre-approved by the Local Ethics Committee no. 1 for the city of Warsaw. Permits’ numbers 207/2011, 361/2012, 371/2012, 560/2014.

Additional files

Supplementary file 1. Eco-HAB.py scripts with sample data enabling their execution.

DOI: http://dx.doi.org/10.7554/eLife.19532.038

elife-19532-supp1.zip (583.2KB, zip)
DOI: 10.7554/eLife.19532.038

References

  1. Andrzejewski R. The home-range concept in rodents revised. Acta Theriologica. 2002;47:81–101. doi: 10.1007/BF03192481. [DOI] [Google Scholar]
  2. Beery AK, Kaufer D. Stress, social behavior, and resilience: insights from rodents. Neurobiology of Stress. 2015;1:116–127. doi: 10.1016/j.ynstr.2014.10.004. [DOI] [PMC free article] [PubMed] [Google Scholar]
  3. Bernardet M, Crusio WE. Fmr1 KO mice as a possible model of autistic features. The Scientific World Journal. 2006;6:1164–1176. doi: 10.1100/tsw.2006.220. [DOI] [PMC free article] [PubMed] [Google Scholar]
  4. Chadman KK, Gong S, Scattoni ML, Boltuck SE, Gandhy SU, Heintz N, Crawley JN. Minimal aberrant behavioral phenotypes of neuroligin-3 R451C knockin mice. Autism Research. 2008;1:147–158. doi: 10.1002/aur.22. [DOI] [PMC free article] [PubMed] [Google Scholar]
  5. Chalfin L, Dayan M, Levy DR, Austad SN, Miller RA, Iraqi FA, Dulac C, Kimchi T. Mapping ecologically relevant social behaviours by gene knockout in wild mice. Nature Communications. 2014;5:e19532. doi: 10.1038/ncomms5569. [DOI] [PubMed] [Google Scholar]
  6. Chesler EJ, Wilson SG, Lariviere WR, Rodriguez-Zas SL, Mogil JS. Identification and ranking of genetic and laboratory environment factors influencing a behavioral trait, thermal nociception, via computational analysis of a large data archive. Neuroscience and Biobehavioral Reviews. 2002;26:907–923. doi: 10.1016/s0149-7634(02)00103-3. [DOI] [PubMed] [Google Scholar]
  7. Codita A, Mohammed AH, Willuweit A, Reichelt A, Alleva E, Branchi I, Cirulli F, Colacicco G, Voikar V, Wolfer DP, Buschmann FJ, Lipp HP, Vannoni E, Krackow S. Effects of spatial and cognitive enrichment on activity pattern and learning performance in three strains of mice in the IntelliMaze. Behavior Genetics. 2012;42:449–460. doi: 10.1007/s10519-011-9512-z. [DOI] [PubMed] [Google Scholar]
  8. Crabbe JC, Wahlsten D, Dudek BC. Genetics of mouse behavior: interactions with laboratory environment. Science. 1999;284:1670–1672. doi: 10.1126/science.284.5420.1670. [DOI] [PubMed] [Google Scholar]
  9. Daan S, Spoelstra K, Albrecht U, Schmutz I, Daan M, Daan B, Rienks F, Poletaeva I, Dell'Omo G, Vyssotski A, Lipp HP. Lab mice in the field: unorthodox daily activity and effects of a dysfunctional circadian clock allele. Journal of Biological Rhythms. 2011;26:118–129. doi: 10.1177/0748730410397645. [DOI] [PubMed] [Google Scholar]
  10. de Chaumont F, Coura RD, Serreau P, Cressant A, Chabout J, Granon S, Olivo-Marin JC. Computerized video analysis of social interactions in mice. Nature Methods. 2012;9:410–417. doi: 10.1038/nmeth.1924. [DOI] [PubMed] [Google Scholar]
  11. Dell'Omo G, Ricceri L, Wolfer DP, Poletaeva II, Lipp H. Temporal and spatial adaptation to food restriction in mice under naturalistic conditions. Behavioural Brain Research. 2000;115:1–8. doi: 10.1016/S0166-4328(00)00234-5. [DOI] [PubMed] [Google Scholar]
  12. Dell'Omo G, Shore RF, Lipp HP. An automated system, based on microchips, for monitoring individual activity in wild small mammals. The Journal of Experimental Zoology. 1998;280:97–99. doi: 10.1002/(SICI)1097-010X(19980101)280:1&#x0003c;97::AID-JEZ12&#x0003e;3.0.CO;2-T. [DOI] [PubMed] [Google Scholar]
  13. El-Kordi A, Winkler D, Hammerschmidt K, Kästner A, Krueger D, Ronnenberg A, Ritter C, Jatho J, Radyushkin K, Bourgeron T, Fischer J, Brose N, Ehrenreich H. Development of an autism severity score for mice using Nlgn4 null mutants as a construct-valid model of heritable monogenic autism. Behavioural Brain Research. 2013;251:41–49. doi: 10.1016/j.bbr.2012.11.016. [DOI] [PubMed] [Google Scholar]
  14. Galsworthy MJ, Amrein I, Kuptsov PA, Poletaeva II, Zinn P, Rau A, Vyssotski A, Lipp HP. A comparison of wild-caught wood mice and bank voles in the Intellicage: assessing exploration, daily activity patterns and place learning paradigms. Behavioural Brain Research. 2005;157:211–217. doi: 10.1016/j.bbr.2004.06.021. [DOI] [PubMed] [Google Scholar]
  15. Heinrichs SC, Koob GF. Application of experimental stressors in laboratory rodents. Current Protocols in Neuroscience. 2006;Chapter 8 doi: 10.1002/0471142301.ns0804s34. [DOI] [PubMed] [Google Scholar]
  16. Howerton CL, Garner JP, Mench JA. A system utilizing radio frequency identification (RFID) technology to monitor individual rodent behavior in complex social settings. Journal of Neuroscience Methods. 2012;209:74–78. doi: 10.1016/j.jneumeth.2012.06.001. [DOI] [PubMed] [Google Scholar]
  17. Jamain S, Radyushkin K, Hammerschmidt K, Granon S, Boretius S, Varoqueaux F, Ramanantsoa N, Gallego J, Ronnenberg A, Winter D, Frahm J, Fischer J, Bourgeron T, Ehrenreich H, Brose N. Reduced social interaction and ultrasonic communication in a mouse model of monogenic heritable autism. PNAS. 2008;105:1710–1715. doi: 10.1073/pnas.0711555105. [DOI] [PMC free article] [PubMed] [Google Scholar]
  18. Knapska E, Walasek G, Nikolaev E, Neuhäusser-Wespy F, Lipp HP, Kaczmarek L, Werka T. Differential involvement of the central amygdala in appetitive versus aversive learning. Learning & Memory. 2006;13:192–200. doi: 10.1101/lm.54706. [DOI] [PMC free article] [PubMed] [Google Scholar]
  19. Krackow S, Vannoni E, Codita A, Mohammed AH, Cirulli F, Branchi I, Alleva E, Reichelt A, Willuweit A, Voikar V, Colacicco G, Wolfer DP, Buschmann JU, Safi K, Lipp HP. Consistent behavioral phenotype differences between inbred mouse strains in the IntelliCage. Genes, Brain, and Behavior. 2010;9:722–731. doi: 10.1111/j.1601-183X.2010.00606.x. [DOI] [PubMed] [Google Scholar]
  20. Lewejohann L, Skryabin BV, Sachser N, Prehn C, Heiduschka P, Thanos S, Jordan U, Dell'Omo G, Vyssotski AL, Pleskacheva MG, Lipp HP, Tiedge H, Brosius J, Prior H. Role of a neuronal small non-messenger RNA: behavioural alterations in BC1 RNA-deleted mice. Behavioural Brain Research. 2004;154:273–289. doi: 10.1016/j.bbr.2004.02.015. [DOI] [PubMed] [Google Scholar]
  21. Lindzey G, Winston H, Manosevitz M. Social dominance in inbred mouse strains. Nature. 1961;191:474–476. doi: 10.1038/191474a0. [DOI] [PubMed] [Google Scholar]
  22. Lopucki R. Social relationships in a bank vole clethrionomys glareolus (Schreber, 1780) population: video monitoring under field conditions. Polish Journal of Ecology. 2007;55:543–558. [Google Scholar]
  23. Mines MA, Yuskaitis CJ, King MK, Beurel E, Jope RS. GSK3 influences social preference and anxiety-related behaviors during social interaction in a mouse model of fragile X syndrome and autism. PLoS One. 2010;5:e19532. doi: 10.1371/journal.pone.0009706. [DOI] [PMC free article] [PubMed] [Google Scholar]
  24. Mineur YS, Huynh LX, Crusio WE. Social behavior deficits in the Fmr1 mutant mouse. Behavioural Brain Research. 2006;168:172–175. doi: 10.1016/j.bbr.2005.11.004. [DOI] [PubMed] [Google Scholar]
  25. Morrison SJ. Time to do something about reproducibility. eLife. 2014;3:e19532. doi: 10.7554/eLife.03981. [DOI] [PMC free article] [PubMed] [Google Scholar]
  26. Moy SS, Nadler JJ, Perez A, Barbaro RP, Johns JM, Magnuson TR, Piven J, Crawley JN. Sociability and preference for social novelty in five inbred strains: an approach to assess autistic-like behavior in mice. Genes, Brain and Behavior. 2004;3:287–302. doi: 10.1111/j.1601-1848.2004.00076.x. [DOI] [PubMed] [Google Scholar]
  27. Nature Challenges in irreproducible research. [December 14, 2015];Nature News and Comment. http://www.nature.com/news/reproducibility-1.17552
  28. Pearson BL, Defensor EB, Blanchard DC, Blanchard RJ. C57BL/6J mice fail to exhibit preference for social novelty in the three-chamber apparatus. Behavioural Brain Research. 2010;213:189–194. doi: 10.1016/j.bbr.2010.04.054. [DOI] [PMC free article] [PubMed] [Google Scholar]
  29. Puścian A, Lęski S, Górkiewicz T, Meyza K, Lipp HP, Knapska E. A novel automated behavioral test battery assessing cognitive rigidity in two genetic mouse models of autism. Frontiers in Behavioral Neuroscience. 2014;8:e19532. doi: 10.3389/fnbeh.2014.00140. [DOI] [PMC free article] [PubMed] [Google Scholar]
  30. Pérez-Escudero A, Vicente-Page J, Hinz RC, Arganda S, de Polavieja GG. idTracker: tracking individuals in a group by automatic identification of unmarked animals. Nature Methods. 2014;11:743–748. doi: 10.1038/nmeth.2994. [DOI] [PubMed] [Google Scholar]
  31. Roullet FI, Lai JK, Foster JA. In utero exposure to valproic acid and autism--a current review of clinical and animal studies. Neurotoxicology and Teratology. 2013;36:47–56. doi: 10.1016/j.ntt.2013.01.004. [DOI] [PubMed] [Google Scholar]
  32. Ryan BC, Young NB, Moy SS, Crawley JN. Olfactory cues are sufficient to elicit social approach behaviors but not social transmission of food preference in C57BL/6J mice. Behavioural Brain Research. 2008;193:235–242. doi: 10.1016/j.bbr.2008.06.002. [DOI] [PMC free article] [PubMed] [Google Scholar]
  33. Sandi C, Haller J. Stress and the social brain: behavioural effects and neurobiological mechanisms. Nature Reviews Neuroscience. 2015;16:290–304. doi: 10.1038/nrn3918. [DOI] [PubMed] [Google Scholar]
  34. Santos AR, Kanellopoulos AK, Bagni C. Learning and behavioral deficits associated with the absence of the fragile X mental retardation protein: what a fly and mouse model can teach us. Learning & Memory. 2014;21:543–555. doi: 10.1101/lm.035956.114. [DOI] [PMC free article] [PubMed] [Google Scholar]
  35. Schaefer AT, Claridge-Chang A. The surveillance state of behavioral automation. Current Opinion in Neurobiology. 2012;22:170–176. doi: 10.1016/j.conb.2011.11.004. [DOI] [PMC free article] [PubMed] [Google Scholar]
  36. Schellinck HM, Price SR, Wong MJ.  Chemical Signals in Vertebrates. 2008. Using ethologically relevant tasks to study olfactory discrimination in Rodents; pp. 71–80. [DOI] [Google Scholar]
  37. Shemesh Y, Sztainberg Y, Forkosh O, Shlapobersky T, Chen A, Schneidman E. High-order social interactions in groups of mice. eLife. 2013;2:e19532. doi: 10.7554/eLife.00759. [DOI] [PMC free article] [PubMed] [Google Scholar]
  38. Sidhu H, Dansie LE, Hickmott PW, Ethell DW, Ethell IM. Genetic removal of matrix metalloproteinase 9 rescues the symptoms of fragile X syndrome in a mouse model. Journal of Neuroscience. 2014;34:9867–9879. doi: 10.1523/JNEUROSCI.1162-14.2014. [DOI] [PMC free article] [PubMed] [Google Scholar]
  39. Simonoff E, Pickles A, Charman T, Chandler S, Loucas T, Baird G. Psychiatric disorders in children with autism spectrum disorders: prevalence, comorbidity, and associated factors in a population-derived sample. Journal of the American Academy of Child & Adolescent Psychiatry. 2008;47:921–929. doi: 10.1097/CHI.0b013e318179964f. [DOI] [PubMed] [Google Scholar]
  40. Sorge RE, Martin LJ, Isbester KA, Sotocinal SG, Rosen S, Tuttle AH, Wieskopf JS, Acland EL, Dokova A, Kadoura B, Leger P, Mapplebeck JC, McPhail M, Delaney A, Wigerblad G, Schumann AP, Quinn T, Frasnelli J, Svensson CI, Sternberg WF, Mogil JS. Olfactory exposure to males, including men, causes stress and related analgesia in rodents. Nature Methods. 2014;11:629–632. doi: 10.1038/nmeth.2935. [DOI] [PubMed] [Google Scholar]
  41. Stockley P, Bottell L, Hurst JL. Wake up and smell the conflict: odour signals in female competition. Philosophical Transactions of the Royal Society B: Biological Sciences. 2013;368:e19532. doi: 10.1098/rstb.2013.0082. [DOI] [PMC free article] [PubMed] [Google Scholar]
  42. Tabuchi K, Blundell J, Etherton MR, Hammer RE, Liu X, Powell CM, Südhof TC. A neuroligin-3 mutation implicated in autism increases inhibitory synaptic transmission in mice. Science. 2007;318:71–76. doi: 10.1126/science.1146221. [DOI] [PMC free article] [PubMed] [Google Scholar]
  43. Voikar V, Colacicco G, Gruber O, Vannoni E, Lipp HP, Wolfer DP. Conditioned response suppression in the IntelliCage: assessment of mouse strain differences and effects of hippocampal and striatal lesions on acquisition and retention of memory. Behavioural Brain Research. 2010;213:304–312. doi: 10.1016/j.bbr.2010.05.019. [DOI] [PubMed] [Google Scholar]
  44. von Merten S, Hoier S, Pfeifle C, Tautz D. A role for ultrasonic vocalisation in social communication and divergence of natural populations of the house mouse (Mus musculus domesticus) PLoS One. 2014;9:e19532. doi: 10.1371/journal.pone.0097244. [DOI] [PMC free article] [PubMed] [Google Scholar]
  45. Weissbrod A, Shapiro A, Vasserman G, Edry L, Dayan M, Yitzhaky A, Hertzberg L, Feinerman O, Kimchi T. Automated long-term tracking and social behavioural phenotyping of animal colonies within a semi-natural environment. Nature Communications. 2013;4:e19532. doi: 10.1038/ncomms3018. [DOI] [PubMed] [Google Scholar]
  46. Łopucki R, Szymroszczyk P. Recognition of interspecific familiar versus unfamiliar odours among bank voles and yellow-necked mice. Acta Theriologica. 2003;48:167–176. doi: 10.1007/BF03194156. [DOI] [Google Scholar]
  47. Štefánik P, Olexová L, Kršková L. Increased sociability and gene expression of oxytocin and its receptor in the brains of rats affected prenatally by valproic acid. Pharmacology Biochemistry and Behavior. 2015;131:42–50. doi: 10.1016/j.pbb.2015.01.021. [DOI] [PubMed] [Google Scholar]
eLife. 2016 Oct 12;5:e19532. doi: 10.7554/eLife.19532.039

Decision letter

Editor: Peggy Mason1

In the interests of transparency, eLife includes the editorial decision letter and accompanying author responses. A lightly edited version of the letter sent to the authors after peer review is shown, indicating the most substantive concerns; minor comments are not usually included.

[Editors’ note: a previous version of this study was rejected after peer review, but the authors submitted for reconsideration. The first decision letter after peer review is shown below.]

Thank you for submitting your work entitled "Eco-HAB – fully automated and ecologically relevant assessment of social impairments in mouse models of autism" for consideration by eLife. Your article has been favorably evaluated by a Senior Editor and four reviewers, one of whom, Peggy Mason, is a member of our Board of Reviewing Editors. The following individuals involved in the review of your submission have agreed to reveal their identity: Thomas Bourgeron (peer reviewer). Our decision has been reached after consultation between the reviewers. Based on these discussions and the individual reviews below, we regret to inform you that your work will not be considered further for publication in eLife.

The principle reasons for the decision were:

1) The reviewers were uncomfortable with the potential COI. The manuscript was viewed as not sufficiently differentiated from an advertisement. If the system design is to be open source, that should be clearly stated. If the system is to be sold commercially, then a clear COI statement must be included.

2) The system needs assessment of reproducibility across cohorts, validation with manual scoring and comparison to other existing systems.

If the authors can adequately address these issues, then eLife would be interested in taking another look.

Reviewer #1:

In general this is a valuable methodological contribution to the study of social interactions of mice. The system is novel and is likely to yield new data such as the VPA data provided as an example here.

Most of my suggestions are minor but a few overall comments are warranted.

The methods should be better integrated into the text to increase readability. Same with the supplementary figures which are beyond onerous. With the exception of code or circuit diagrams, put all figures into the manuscript in the order needed. Do not use supplemental figures.

What is the time limit for mice in the apparatus? 72 hr is used here – is that the limit and what is the limiting factor? How is air exchange handled (I am assuming that the system is closed on the top)?

How scalable is this system in terms of size? Can it be used for guinea pigs? rats?

The sociability measure is well described in the methods but the "Social preference" appears to me overly derived. Raw numbers – time in chamber with (and wo/) the social odor before during and after the odors presence would be better than the normalized factor used.

It is very confusing to use the term Social preference to refer to the mouse going to the mouse in a 3-chamber test and to a social ODOR in the eco-hab. I highly recommend using the term approach to social odor.

Throughout the manuscript, it is problematic that no non-social stimuli are tested – e.g. a non-social odor or an object. This limits the conclusions about the sociability per se of the measures. Nonetheless, the point here is a novel apparatus which could be used to make these direct comparisons even if they have not yet been made.

Reviewer #2:

This manuscript describes a four-chambered system for animal tracking using RFID tags and antennas as opposed to other available methods (video tracking, IR beam-breaks, piezoelectric floor, etc.) One major advantage of RFID tracking is that it allows for the testing of multiple animals in one arena with individual identifying information. The Eco-HAB apparatus described allows animals to explore a sizable space, the symmetry allows for comparison of different stimuli, and tube connectors may increase mouse comfort in the arena. The authors make an important argument about the need for better reproducibility in social testing, and provide data suggesting that social approach in anxiety-prone balb/c mice is different in the standard 3ChA test under high and low stress conditions. While they did not test the eco-HAB under different lighting or animal handling history conditions (making it not a direct comparison to either the 3ChA comparison or cross-lab variability), data from different time points suggests that the eco-HAB system provides consistent results. The authors further provide empirical data showing the utility of this system in assessing social behavioral differences across multiple variables (including mouse strain, VPA treatment, Fmr1 knockout). Finally, they present a neat metric they call "in-cohort sociability" that provides something really different from standard 3ChA testing because it measures social behavior towards known individuals. One might imagine a scenario under which novel animal social cue exploration might decrease but in-cohort sociability would go up, and having both metrics adds a lot to the interest of this setup.

1) This report may blur the boundary between a detailed description of a methodological advance and the advertisement of a commercial device (available for ~$2000 euros). Other eLife tools reports I've seen use commercial resources but not ones they are selling. I defer to the editor to determine suitability.

2) Data validation must be included so that the accuracy of the software and hardware are disclosed. In particular, a nontrivial amount of testing time should be dually scored by human video observers (e.g. at slow speed on visibly marked individuals) and the RFID data collection system. The authors mention that some signals are dropped, and this is a classic issue with RFID reads – fast moving animals can be missed, and partial tag reads can abound. Depending on the structure of the individual ID tags (unique at only the beginning, end, or all), partial tag reads may or may not be assignable to individuals. Comparisons to hand-scoring of video feed will allow the authors to report estimate how much missing data there is (as analyses reported consist of the subset of the reliable data after dropping conflicting signals. In one note they say that <1% of mice are read as far apart enough that they missed two antennas in a row, however this under-reports the frequency of error. There can be error with no discrepancy in the order of signals detected if, and mice can be missed while moving between adjacent chambers or staying for a long period of time in a single chamber where their entry and exit were both misread. A second method of scoring would put time values to this error (amount or% of time misclassified) as opposed to just frequency of signals being dropped from analysis.

3) This system could potentially provide the ability to do a tremendous amount with individual data, if this is supported in the analysis package. If this is supported (i.e. provided the pair-wise social behavior data in the manuscript were generated by the analysis package), the authors should discuss this potential. For example, a sub-group of cohoused mice could be treated and a subgroup could be untreated, and differences could be assessed within a single testing session. The heat maps of mouse pair interactions could be used to identify more and less social individual mice which could be useful for comparisons to other measures (for example individual differences in specific genes, neural markers, etc.). And presuming other small rodents like prairie or meadow voles could be tested in such an apparatus, stable affiliations could be examined between mates or same-sex peers. This represents an exciting advantage of this kind of tracking system that is currently overlooked in this presentation.

Reviewer #2 (Additional data files and statistical comments):

In my comments above I ask for the authors to share validation data with the results of two methods of scoring the same data. I would hope these have already been collected in the course of validating the hardware and software. It is painstaking work to validate 12 mice visually, but it needs to be done at least once for me to have any confidence in the output. I have seen multiple iterations of other similar testing systems have major flaws in the output that were not caught until such validation was performed.

Reviewer #3:

The authors propose a set-up to study social behavior in mice. The setup proposed is of a complexity between very simple standard tests and more complex RFID arenas. This intermediate level of complexity has the advantage of being much cheaper than full-area RFID arenas and the authors argue that the simplified arena is ethologically relevant.

While the authors compare their setup with simpler arenas, they don’t make a comparison with more complex arenas (Kimchi Lab). To know whether this simplified arena captures the necessary elements, it would seem necessary to compare against these full-area setups.

Perhaps one of the more relevant points is about reproducibility, but I see no discussion of the data apparently used to demonstrate it in Figure 5. What does it count as high reproducibility? Why the data would correspond to that standard? What are the bars in the graph?

The authors justify RFID approaches saying then video-based approaches have the problem of how to deal with shadows and corridors. For a fairer discussion, maybe the authors can (a) discuss how bad the problem really is (giving refs to new developments in this line) and (b) also discuss problems with RFID (more invasive than video?) and (c) try to discuss limitations of their proposed setup (cannot find in different lines how afraid to open spaces they are?).

Reviewer #4:

The paper entitled "Eco-HAB – fully automated and ecologically relevant assessment of social impairments in mouse models of autism" describes an innovative set-up to assess mouse social behavior in an automated way, without human intervention. Mouse sociability is assessed within the housing environment, that is, an arrangement of housing boxes connected by corridor tubes. Mice are tracked and localized using RFID technology. The data collected are used to estimate the amount of time each mouse spend within each box, with or without her conspecifics, and also to measure their interest for social odor cues in comparison with non-social odor cues. The authors challenged their system by testing several mouse models of autism. This new system should allow researchers to detect similar social impairments in different mouse models as the classic 3-chambered test. For example, mouse social interest could be analyzed in low-stress conditions. This could also spare time and avoid many confounding factors (such as experimenter biases, housing conditions, habituation to the test apparatus) and while this concept is of high interest for the community (replication is indeed a major issue in the field), I have several comments on this current version of the Eco-HAB.

First, this setting and the analyses conducted on the data are reduced to a very basic "social interaction" level. The social interaction is described as the time spent in which box with whom. This is disappointing given the high potential of the method to generate more precise data (e.g., sub-group formation: is it possible to quantify the number of individuals in the subgroup and how stable in time the subgroups are?). In addition, the supposition that a mouse spends time with another one when they are located in the same case is not clearly shown. The correction of the time spent with another mouse (by subtracting the supposed spontaneous (non-social) exploration to the time spent in the compartment) is not convincing. It would need further analyses and a validation. Indeed, on a few video samples, it might be possible to compare the manual scoring of time spent with another mouse to the amount of time calculated through the method presented. This would allow the authors to check the accuracy of the calculation. The non-social stimuli used in Eco-HAB might also be more elaborated. For instance, the authors use bedding with sent vs. fresh bedding as a test for social vs. non-social stimuli. To align with the 3-chambered test paradigm, for the non-social condition, the authors could use bedding + non-social odor such as lemon or bedding + inanimate object.

Second, the novelty of the system is not clear to me. The authors quoted a previous article by Weissbrod et al. published in Nature Communication entitled "Automated long-term tracking and social behavioral phenotyping of animal colonies within a semi-natural environment". The paper also describes a tracking via RFID and social interaction matrices. It would be important to compare the two systems and explicitly show why Eco-HAB is different or better. The authors should also include a table indicating the accuracy of the video-RFID-tracking system performance in their system (as Table1 in the Weissbrod paper).

Third, I don't think that "low cost custom system" and "reproducibility" is very relevant here. If the authors want to argue for the reproducibility of the results obtained with this system, it would be appropriate to indicate the results from the same measurements using different cohorts. Currently, the data of the different replications appeared to be pooled. In addition, reproducing the setup is relatively complex and expertise in electronics is mandatory to reproduce the system.

In summary, the authors did not convince the reviewer of the usefulness of this current version of Eco-HAB. However, if they present additional measures that can be made with Eco-HAB (and not with previous behavioral tests using RFID), the system could be of interest to increase reproducibility in the field of mouse behavior.

[Editors’ note: what now follows is the decision letter after the authors submitted for further consideration.]

Thank you for submitting your article "Eco-HAB as a fully automated and ecologically relevant assessment of social impairments in mouse models of autism" for consideration by eLife. Your article has been favorably evaluated by a Senior Editor and two reviewers, one of whom, Peggy Mason (Reviewer #1), is a member of our Board of Reviewing Editors. The following individual involved in the review of your submission has agreed to reveal their identity: Gonzalo de Polavieja (Reviewer #2).

The reviewers have discussed the reviews with one another and the Reviewing Editor has drafted this decision to help you prepare a revised submission.

This is a great revision. The remaining concerns are very specific and are listed below. Please take a look and revise accordingly. We look forward to seeing your revision.

Reviewer #1:

This is an important methodological advance in the field of rodent social behavior and neuroscience. The revised manuscript has addressed many of the concerns raised by the initial review. Of great importance, it is clear that the system is open source and this manuscript is a contribution and not an advertisement. Additional detail concerning reproducibility has been added.

Minor to moderate concerns are:

Please put open source into the Abstract and keywords and possibly also the summary.

Figure 1—figure supplement 2 – the legend is not helpful. What is being graphed on the y axis? It would appear to be crossings but that is not said in the legend. And how were the manual crossings measured – with red light? Most importantly, why is the interpretation that the RFID measurement is superior to the manual scoring? This graph shows a difference, a consistent one. But it is unclear to me which of the two is more accurate. Finally, this does not truly address the 3rd concern of the 4th reviewer which is admittedly a bit vague. But the gist of the concern is: how does the reader know that the two mice are "spending time together" when they both occupy the same box? I think this questions whether two mice in one box could be at opposite ends and facing away from each other and yet be counted as socially affiliating. Clearly a formal possibility. Do the authors have any data relevant to this concern?

The sentence “Even though, in the present form, our system does not allow for the recognition of particular littermate-related behaviors, results show that both Eco-HAB measures-in-cohort sociability and scent-based social approach allow for drawing similar conclusions” is not understandable to me.

The Discussion is short. Some text in the Results should be in the Discussion (e.g. subsection “Eco-HAB – ethologically relevant testing of social behaviors”, last two paragraphs; subsection “Eco-HAB measurement is unbiased by social hierarchy and allows for long-term monitoring of social behavior”, last paragraph). Several of the comments in the response to reviewers would also be useful to include. The manuscript is concise but to a fault. Hold the reader's hand a bit more and help them to understand what you know so well after working on this for years.

Figure 5. The original is in original form I believe and still does not speak to reproducibility as do Figure 5—figure supplements 1-3. The supplemental figures are very useful and should be the main figure. I do not know what Figure 5 shows in its present form. Here is a suggestion. Make different symbols for the two cohorts in each condition (wt vs. fmr1 and via vs. control). Then line them up from highest to lowest. As it is the individuals are ordered along the x axis by mouse number or some other arbitrary/meaningless parameter. This simply does not show replication. If anything it is a messy version of a scatter or box plot of the data showing variability and range.

What are the ovals in Figure 5—figure supplement 3? The dots are averages from the two days of testing?

Reviewer #2:

Most of the concerns I had have been appropriately address in the new version of the manuscript. Now it is clear that software and data are open. It is also more clear the comparison with other methods and how this setup is more reliable than others and that levels of stress are lower than in 3-chamber setups.

The comparison with standard 3-chamber setups is, in summary, quite deep. However, the comparison with open arenas (Weissbrod, 2103) is only verbal. The authors say that in open arenas animals have territorial fights, as recognized in Weissbrod 2013. However, I see no comparison now between the number of fights or stress levels in the present setup vs. Weissbrod 2013. The reader is left to assume that, because the setup is inspired in ethologically relevant behavior, it must obviously be true that there is less aggression. In the most beautiful scenario, we would have the wild, open arena and present setup measurements of aggressive encounters. In the next level at least a comparison between open arenas and this set-up. But, to avoid doing new experiments, I think the minimum would be to re-analize the data to measure aggression. Video data was acquired, so it should most probably be possible to analyze this data for aggression encounters.

eLife. 2016 Oct 12;5:e19532. doi: 10.7554/eLife.19532.040

Author response


[Editors’ note: the author responses to the first round of peer review follow.]

[…]

1) The reviewers were uncomfortable with the potential COI. The manuscript was viewed as not sufficiently differentiated from an advertisement. If the system design is to be open source, that should be clearly stated. If the system is to be sold commercially, then a clear COI statement must be included.

Thank you for pointing out this matter, as it gave us an opportunity to clearly state our intentions regarding Eco-HAB’s accessibility. The system has been designed to be open source both with respect to hardware and software. We have presented all the technical details and electronic solutions needed to construct the apparatus from scratch. We have also provided all the software required to run experiments and analyze data, along with sample implementations. Our only intention was to enable potentially interested scientists to build the apparatus on their own, without the necessity of purchasing any of its elements from us. The estimated cost of Eco-HAB was presented solely to stress the fact that it consists of inexpensive equipment, specifically that it was no more costly than traditional, non-automated set-ups serving similar purposes. As recommended, we have added a clear statement of Eco-HAB’s open source character in the manuscript (Introduction).

“[…]we designed Eco-HAB, a fully automated open source system, based on RFID technology and inspired by the results of ethological field studies in mice […]”.

2) The system needs assessment of reproducibility across cohorts.

In order to better demonstrate reproducibility, we have performed additional experiments as well as presented previously obtained data that was not part of the initial manuscript. To present them we designed an entirely new Figure 5 with 3 secondary graphics, addressing reproducibility between cohorts, reproducibility between results obtained in different laboratories and within subject comparisons.

3) Validation with manual scoring.

We added data on the efficiency of RFID antennas’ as compared to video-based, manual scoring. The implemented system of coils recognizes subjects with sensitivity far exceeding that obtained with standard video- and RFID-recognition methods. Implemented RFID coils are highly effective and have a sensitivity sufficient to register mice moving at their maximal speed. The RFID antennas run independently and do not disrupt each other’s workings, regardless of the signal’s amplitude. All coils may be activated simultaneously and register signals for unlimited time as described in the amended manuscript (Figure 1—figure supplement 2).The ability to simultaneously activate and run for an unlimited time is due to the synchronization system (output of a 4 MHz crystal oscillator powered with 5V distributed to all EM4095 IC clock inputs), which, as far as we know, has never been implemented in a laboratory animal recognition setup.

4) And comparison to other existing systems.

We added sentences to the manuscript (subsection “Eco-HAB – ethologically relevant testing of social behaviors”, last two paragraphs) stating how Eco-HAB compares to full-arena set-ups, such as the one proposed by Tali Kimchi’s Lab (Weissbrod A. et al. 2013). As shown in their publication, open-arena testing entails frequent display of aggressive behaviors, such as chasing or fighting. For studies of associative behaviors and stable affiliations among mice, we needed an environment that would reduce these types of interactions. It took 3 years of experimental trials and research into mouse ethology to come up with our system of tunnels and chambers that allows mice to display their natural affiliation patterns.

If the authors can adequately address these issues, then eLife would be interested in taking another look.

Reviewer #1:

In general this is a valuable methodological contribution to the study of social interactions of mice. The system is novel and is likely to yield new data such as the VPA data provided as an example here.

Most of my suggestions are minor but a few overall comments are warranted.

The methods should be better integrated into the text to increase readability. Same with the supplementary figures which are beyond onerous. With the exception of code or circuit diagrams, put all figures into the manuscript in the order needed. Do not use supplemental figures.

We designed the figures in accordance to eLife recommendations, which state that figures not central to the narrative should be presented as secondary figures, directly linked to the primary ones. We recognize that this kind of presentation may be troublesome for the reviewers, to whom all the figures are presented as separate files. However, potential readers will see all the graphics comprising a given figure and its supplements as comprehensive flash animations, inbuilt into the article’s body.

What is the time limit for mice in the apparatus? 72 hr is used here – is that the limit and what is the limiting factor? How is air exchange handled (I am assuming that the system is closed on the top)?

We made adjustments to the manuscript to clarify these matters: “Although the protocol utilized here lasted 72 h, it is noteworthy that, when required, Eco-HAB can run continuously even for months with only short technical breaks for cage cleaning (every 7 days). The cages are not connected to the IVC system, so air exchange is not an issue.”

How scalable is this system in terms of size? Can it be used for guinea pigs? rats?

The implemented solutions are easily scalable. With the exception of RFID coils, whose size needs to be adjusted in accordance to the corridor diagonal, there is no need to change applied electronics or software should one wish to adapt the system to species other than mice. This is stated in the amended manuscript (subsection “Eco-HAB - apparatus construction”).

The sociability measure is well described in the methods but the "Social preference" appears to me overly derived. Raw numbers – time in chamber with (and wo/) the social odor before during and after the odors presence would be better than the normalized factor used.

When animals are tested in Eco-HAB or using manual behavioral tests, they usually display a preference for one of the experimental compartments during the adaptation phase. We argue that this factor should be taken under consideration, as it may influence subsequent measurement of social preference. We consider this issue to be even more prominent in automated set-ups, where animals are exposed to the experimental environment 24h a day. Since Eco-HAB allows testing of spontaneous behavior in animals, their habits might play an even greater role. Additionally, animals’ activity, which usually decreases in the course of experiment, may confound interpretation based solely on raw data. For these reasons we think that the normalized factor we present is the most accurate way to assess social preference.

It is very confusing to use the term Social preference to refer to the mouse's going to the mouse in a 3-chamber test and to a social ODOR in the eco-hab. I highly recommend using the term approach to social odor.

The text, figures and their descriptions have been adjusted according to your suggestion.

Throughout the manuscript, it is problematic that no non-social stimuli are tested – e.g. a non-social odor or an object. This limits the conclusions about the sociability per se of the measures. Nonetheless, the point here is a novel apparatus which could be used to make these direct comparisons even if they have not yet been made.

We fully agree that when testing social preference one should introduce non-social stimulus for control purposes. That is why, as described in Materials and methods section (see: Three-chambered apparatus testing, Eco-HAB testing), in all of our experiments we use non-social stimuli (a non-social object or a non-social odor respectively) in order to control for novelty – a factor that might cause an increase in exploratory behaviors, such as sniffing and approaching. We also compared responses to social and non-social stimulus of the same modality.

Reviewer #2: […]

1) This report may blur the boundary between a detailed description of a methodological advance and the advertisement of a commercial device (available for ~$2000 euros). Other eLife tools reports I've seen use commercial resources but not ones they are selling. I defer to the editor to determine suitability.

The system has been designed to be open source in the full meaning of the word. We presented all the technical details and electronic details needed to construct the apparatus from scratch. We also provided all the software required to run experiments and analyze data, along with example implementations. Our only intention was to enable potentially interested scientist to build the apparatus on their own, without the necessity of purchasing any of its elements from us. The estimated cost of the Eco-HAB was presented solely to stress the fact that it was inexpensive equipment, specifically that it was no more costly than traditional, non-automated behavioral set-ups serving similar purposes. We added a clear statement of Eco-HAB’s open source character in the manuscript (Introduction, sixth paragraph).

2) Data validation must be included so that the accuracy of the software and hardware are disclosed. In particular, a nontrivial amount of testing time should be dually scored by human video observers (e.g. at slow speed on visibly marked individuals) and the RFID data collection system. The authors mention that some signals are dropped, and this is a classic issue with RFID reads – fast moving animals can be missed, and partial tag reads can abound. Depending on the structure of the individual ID tags (unique at only the beginning, end, or all), partial tag reads may or may not be assignable to individuals. Comparisons to hand-scoring of video feed will allow the authors to report estimate how much missing data there is (as analyses reported consist of the subset of the reliable data after dropping conflicting signals. In one note they say that <1% of mice are read as far apart enough that they missed two antennas in a row, however this under-reports the frequency of error. There can be error with no discrepancy in the order of signals detected if, and mice can be missed while moving between adjacent chambers or staying for a long period of time in a single chamber where their entry and exit were both misread. A second method of scoring would put time values to this error (amount or% of time misclassified) as opposed to just frequency of signals being dropped from analysis.

We have added data on the sensitivity of the RFID system we had obtained before we started to perform experiments. The data includes comparisons of the efficiency of the antennas with respect to video-based manual scoring (Figure 1—figure supplement 2). The system of coils (subsection “Eco-HAB - applied electronic solutions”) can recognize subjects with high sensitivity, far exceeding that obtained with standard video- and RFID-recognition methods. These RFID coils have sufficient sensitivity to register even mice moving at high speed. This is all possible because of the internal 4 MHz crystal oscillator synchronization. To the best of our knowledge, this has never been implemented in laboratory animal recognition set-ups. The RFID antennas run independently and do not disrupt each other’s workings, regardless of signal’s amplitude. Moreover, all coils may be active simultaneously and register signals for practically unlimited time. Since the system is designed to be highly sensitive in order not to miss animals’ signals when they are running, it is expected that it would generate superfluous readouts (e.g. when animal is sitting under antenna). If present, such readouts are later eliminated by the Eco-HAB.py software, that contains algorithms recognizing such events. We have also described (Materials and methods, section Eco-HAB.py – software package for data processing and analysis: Data processing algorithm) how our software deals with cases when signal was dropped. Even if this happens, it would not influence the final assessment of social preference. As to partial tag readouts, they are not an issue since such events are absent in our system.

3) This system could potentially provide the ability to do a tremendous amount with individual data, if this is supported in the analysis package. If this is supported (i.e. provided the pair-wise social behavior data in the manuscript were generated by the analysis package), the authors should discuss this potential. For example, a sub-group of cohoused mice could be treated and a subgroup could be untreated, and differences could be assessed within a single testing session. The heat maps of mouse pair interactions could be used to identify more and less social individual mice which could be useful for comparisons to other measures (for example individual differences in specific genes, neural markers, etc.). And presuming other small rodents like prairie or meadow voles could be tested in such an apparatus, stable affiliations could be examined between mates or same-sex peers. This represents an exciting advantage of this kind of tracking system that is currently overlooked in this presentation.

Thank you for this feedback. Indeed – Eco-HAB can provide all the features you have mentioned and we had not stressed this enough in the initial manuscript. All the individual data can easily be analyzed using our software package. The software is open source code, enabling users to modify it to develop their own custom measures. Analysis of pair-wise social behavior we reported is one of the default functionalities of Eco-HAB.py. Closely following your advice we have modified the Results section (see: Eco-HAB – ethologically relevant testing of social behaviors) with text regarding Eco-HAB’s potential to analyze individual social behavior in a detailed manner as well as track stable affiliations and test littermate-interactions of sub-groups of mice within one experimental session: “Besides asserting described measures of ethologically relevant sociability, Eco-HAB provides the possibility of performing in-depth analysis of individual social behaviors. […] Compared to testing experimental and control groups separately, such a solution allows for evaluation of social environment as an essential factor that may influence littermate-related behavior.”’

Reviewer #2 (Additional data files and statistical comments):

In my comments above I ask for the authors to share validation data with the results of two methods of scoring the same data. I would hope these have already been collected in the course of validating the hardware and software. It is painstaking work to validate 12 mice visually, but it needs to be done at least once for me to have any confidence in the output. I have seen multiple iterations of other similar testing systems have major flaws in the output that were not caught until such validation was performed.

As described above, we had already performed such an analysis before the system began to be utilized for experimental purposes. As we stated, the RFID coils are highly effective and have sensitivity sufficient to register running mice. We included this data and a description of how it was obtained in the manuscript (subsection “Eco-HAB - applied electronic solutions, Figure 1—figure supplement 2).

Reviewer #3:

The authors propose a set-up to study social behavior in mice. The setup proposed is of a complexity between very simple standard tests and more complex RFID arenas. This intermediate level of complexity has the advantage of being much cheaper than full-area RFID arenas and the authors argue that the simplified arena is ethologically relevant.

While the authors compare their setup with simpler arenas, they don’t make a comparison with more complex arenas (Kimchi Lab). To know whether this simplified arena captures the necessary elements, it would seem necessary to compare against these full-area setups.

We have added information to the manuscript (subsection “Eco-HAB – ethologically relevant testing of social behaviors”, last two paragraphs) stating how Eco-HAB compares to full-arena set-ups, such as that proposed by Tali Kimchi’s Lab (Weissbrod A. et al. 2013). Basically, our system avoids the extensive territorial fights that occur in open arena settings. This is very important since our goal is to measure associative behaviors (stable affiliations) among mice of the same as well as opposite sexes. As shown by Weissbrod et al. (2013) open-arena testing entails frequent display of aggressive behaviors, such as chasing. We consider feasibility of observing spontaneous, long lasting affiliations between conspecifics an exciting advantage of Eco-HAB as a tracking system. Additional design elements were inspired by the work of Weissbrod et al. (2013) including our technical RFID electronics solutions. However, in Eco-HAB, transponders do not have to be perpendicular to the antennas in order to get optimal signal strength. This results in superior registration accuracy which is independent of the position of an animal. Additionally, we placed two antennas on each corridor leading to the housing compartments to be able to explicitly assess the direction from which animal was entering.

Perhaps one of the more relevant points is about reproducibility, but I see no discussion of the data apparently used to demonstrate it in Figure 5. What does it count as high reproducibility? Why the data would correspond to that standard? What are the bars in the graph?

In order to make the reproducibility issue more convincing, we have performed additional experiments, as well as presented previously obtained data, that had not been a part of the initial manuscript. To do so, we constructed an entirely new Figure 5 with 3 secondary graphics, addressing reproducibility between cohorts, reproducibility between results obtained in different laboratories and within subject comparisons.

The authors justify RFID approaches saying then video-based approaches have the problem of how to deal with shadows and corridors. For a fairer discussion, maybe the authors can (a) discuss how bad the problem really is (giving refs to new developments in this line) and (b) also discuss problems with RFID (more invasive than video?) and (c) try to discuss limitations of their proposed setup (cannot find in different lines how afraid to open spaces they are?).

Following your advice we added comments concerning how our system is an improvement on video-based methods, the invasive character of RFID-tracking, and limitations of Eco-HAB system, which in the present form, does not allow for the recognition of particular littermate-related behaviors (Introduction, fifth paragraph and subsection “Eco-HAB – ethologically relevant testing of social behaviors”, first paragraph).

Reviewer #4:

The paper entitled "Eco-HAB – fully automated and ecologically relevant assessment of social impairments in mouse models of autism" describes an innovative set-up to assess mouse social behavior in an automated way, without human intervention. Mouse sociability is assessed within the housing environment, that is, an arrangement of housing boxes connected by corridor tubes. Mice are tracked and localized using RFID technology. The data collected are used to estimate the amount of time each mouse spend within each box, with or without her conspecifics, and also to measure their interest for social odor cues in comparison with non-social odor cues. The authors challenged their system by testing several mouse models of autism. This new system should allow researchers to detect similar social impairments in different mouse models as the classic 3-chambered test. For example, mouse social interest could be analyzed in low-stress conditions. This could also spare time and avoid many confounding factors (such as experimenter biases, housing conditions, habituation to the test apparatus) and while this concept is of high interest for the community (replication is indeed a major issue in the field), I have several comments on this current version of the Eco-HAB.

First, this setting and the analyses conducted on the data are reduced to a very basic "social interaction" level. The social interaction is described as the time spent in which box with whom. This is disappointing given the high potential of the method to generate more precise data (e.g., sub-group formation: is it possible to quantify the number of individuals in the subgroup and how stable in time the subgroups are?).

Eco-HAB can provide the features you have mentioned, namely results on sub-group formation and stability, although perhaps we had not stressed this issue enough in the manuscript. All of the individual and sub-group data can easily be analyzed through our software package. The software is an open source code which means that users can modify it to obtain custom measures. Analysis of pair-wise social behavior is one of the default functionalities of Eco-HAB.py. Following your advice we added comments to the Results and Discussion section (see: Eco-HAB – ethologically relevant testing of social behaviors) regarding Eco-HAB’s potential to analyze individual social behavior as well as track stable affiliations and test littermate-interactions of sub-groups of mice within one experimental session (–subsection “Eco-HAB – ethologically relevant testing of social behaviors”, last two paragraphs).

In addition, the supposition that a mouse spends time with another one when they are located in the same case is not clearly shown. The correction of the time spent with another mouse (by subtracting the supposed spontaneous (non-social) exploration to the time spent in the compartment) is not convincing. It would need further analyses and a validation. Indeed, on a few video samples, it might be possible to compare the manual scoring of time spent with another mouse to the amount of time calculated through the method presented. This would allow the authors to check the accuracy of the calculation. The non-social stimuli used in Eco-HAB might also be more elaborated. For instance, the authors use bedding with sent vs. fresh bedding as a test for social vs. non-social stimuli. To align with the 3-chambered test paradigm, for the non-social condition, the authors could use bedding + non-social odor such as lemon or bedding + inanimate object.

Before we started to perform animal experiments in Eco-HAB, we had already completed a detailed analysis of the RFID system efficiency. This was done by means of comparison with video recordings. We describe this in detail in addressing your comment regarding RFID antennas (see below). In accordance to your advice, we have added new charts (Figure 1—figure supplement 3) concerning system validation.

As for the olfactory stimuli utilized in Eco-HAB, in these experiments we deliberately presented social and non-social stimuli of the same modality in order to appropriately control for novelty. Moreover, we avoided using stimuli that might be associated with food or sex in order to eliminate the possibility of motivational conflicts that might have confounded assessment of sociability. We have made alterations to the manuscript explicitly stating the possibility of being able to use any scent (subsection “Eco-HAB testing”, last paragraph) depending on the particular scientific question being asked.

Second, the novelty of the system is not clear to me. The authors quoted a previous article by Weissbrod et al. published in Nature Communication entitled "Automated long-term tracking and social behavioral phenotyping of animal colonies within a semi-natural environment". The paper also describes a tracking via RFID and social interaction matrices. It would be important to compare the two systems and explicitly show why Eco-HAB is different or better. The authors should also include a table indicating the accuracy of the video-RFID-tracking system performance in their system (as Table1 in the Weissbrod paper).

We have added information to the manuscript (subsection “Eco-HAB – ethologically relevant testing of social behaviors”, last two paragraphs) stating how Eco-HAB compares to full-arena set-ups, such as that proposed by Tali Kimchi’s Lab (Weissbrod A. et al. 2013). Basically, our system avoids the extensive territorial fights that occur in open arena settings. This is very important since our goal is to measure associative behaviors (stable affiliations) among mice of the same as well as opposite sexes. As shown by Weissbrod et al. (2013) open-arena testing entails frequent display of aggressive behaviors, such as chasing. We consider feasibility of observing spontaneous, long lasting affiliations between conspecifics an exciting advantage of Eco-HAB as a tracking system. Additional design elements were inspired by the work of Weissbrod et al. (2013) including our technical RFID electronics solutions. However, In Eco-HAB, transponders do not have to be perpendicular to the antennas in order to get optimal signal strength. This results in superior registration accuracy which is independent of the position of an animal. Additionally, we placed two antennas on each corridor leading to the housing compartments to be able to explicitly assess the direction from which animal was entering.

We have also added data on the sensitivity of the RFID system we had obtained before we started to perform experiments. The data includes comparisons of the efficiency of the antennas with respect to video-based manual scoring (Figure 1—figure supplement 2). The system of coils (subsection “Eco-HAB - applied electronic solutions”) can recognize subjects with high sensitivity, far exceeding that obtained with standard video- and RFID-recognition methods. These RFID coils have sufficient sensitivity to register even mice moving at high speed. This is all possible because of the internal 4 MHz crystal oscillator synchronization. To the best of our knowledge, this has never been implemented in laboratory animal recognition set-ups. The RFID antennas run independently and do not disrupt each other’s workings, regardless of signal’s amplitude. Moreover, all coils may be active simultaneously and register signals for practically unlimited time. Since the system is designed to be highly sensitive in order not to miss animals’ signals when they are running, it is expected that it would generate superfluous readouts (e.g. when animal is sitting under antenna). If present, such readouts are later eliminated by the Eco-HAB.py software, that contains algorithms recognizing such events. We have also described (Materials and methods, section Eco-HAB.py – software package for data processing and analysis: Data processing algorithm) how our software deals with cases when signal was dropped. Even if this happens, it would not influence the final assessment of social preference. As to partial tag readouts, they are not an issue since such events are absent in our system.

Third, I don't think that "low cost custom system" and "reproducibility" is very relevant here. If the authors want to argue for the reproducibility of the results obtained with this system, it would be appropriate to indicate the results from the same measurements using different cohorts. Currently, the data of the different replications appeared to be pooled. In addition, reproducing the setup is relatively complex and expertise in electronics is mandatory to reproduce the system.

In order to make the reproducibility issue more convincing, we have performed additional experiments, as well as presented previously obtained data, that had not been a part of the initial manuscript. To do so, we constructed an entirely new Figure 5 with 3 secondary graphics, addressing reproducibility between cohorts, reproducibility between results obtained in different laboratories and within subject comparisons. As recommended we have presented results from the same measurements using different cohorts (Figure 5).

As to the electronic, we have presented all the data needed for reproduction of a new Eco-HAB setup. Even if a scientist has insufficient electronic expertise to build one themselves, they could order a system at low cost from someone who did. All electronic elements are inexpensive and easily obtainable. Design of the system, which would be the most expensive part, has already been taken care of by us. Moreover, we would be happy to assist any potentially interested laboratories with implementation of their own systems.

In summary, the authors did not convince the reviewer of the usefulness of this current version of Eco-HAB. However, if they present additional measures that can be made with Eco-HAB (and not with previous behavioral tests using RFID), the system could be of interest to increase reproducibility in the field of mouse behavior.

As described above (subsection “Eco-HAB – ethologically relevant testing of social behaviors”, last two paragraphs), we strongly believe that the ability to measure spontaneous, long lasting affiliations between mice is the greatest advantage of Eco-HAB as compared to previously published set-ups. This is achievable only because we were able to minimize aggressive and territorial behaviors, that are intrinsic to commonly applied open-arena testing. To our knowledge, Eco-HAB is a first system enabling animals to inhabit multiple small sub-territories, resembling natural burrows. We argue, that this is due to the lack of attractive resources placed in the middle of the area available for exploration. We hope that, together with the data showing the reproducibility of Eco-HAB measurements we were able to convince you of its usefulness, especially for studies concerning non-confrontational littermate-related behaviors in rodents.

[Editors' note: the author responses to the re-review follow.]

Reviewer #1:

This is an important methodological advance in the field of rodent social behavior and neuroscience. The revised manuscript has addressed many of the concerns raised by the initial review. Of great importance, it is clear that the system is open source and this manuscript is a contribution and not an advertisement. Additional detail concerning reproducibility has been added.

Minor to moderate concerns are:

Please put open source into the Abstract and keywords and possibly also the summary.

We made appropriate changes in the manuscript (Abstract, Keywords and Conclusion, first paragraph).

Figure 1—figure supplement 2 – the legend is not helpful. What is being graphed on the y axis? It would appear to be crossings but that is not said in the legend. And how were the manual crossings measured – with red light? Most importantly, why is the interpretation that the RFID measurement is superior to the manual scoring? This graph shows a difference, a consistent one. But it is unclear to me which of the two is more accurate.

We have designed a new Figure 1—figure supplement 2 with altered legend. The implemented RFID antennas are far more sensitive than what is needed to recognize every visually registered crossing. Now the graph shows that for every video-recorded event (animal passing under the antenna) there are on average 3.9/3.4 (2 independent measurements) RFID registrations. Superfluous data are automatically screened and removed by the Eco-HAB.py software, as described in the subsection “Data processing algorithm”. Further, as described in subsection “Eco-HAB – applied electronic solutions” video-based assessment of antenna crossings was performed during the first 6 hour period of the dark phase at the beginning of the adaptation phase, when animals are most active and intensively explore a new environment (subsection “Eco-HAB - applied electronic solutions”, third paragraph). As advised, we explicitly stated the conditions under which videos were recorded, namely that they were obtained in complete darkness. The source of infra-red light placed above the apparatus was used to illuminate the field of view (in the aforementioned paragraph).

Finally, this does not truly address the 3rd concern of the 4th reviewer which is admittedly a bit vague. But the gist of the concern is: how does the reader know that the two mice are "spending time together" when they both occupy the same box? I think this questions whether two mice in one box could be at opposite ends and facing away from each other and yet be counted as socially affiliating. Clearly a formal possibility. Do the authors have any data relevant to this concern?

We added to the Discussion the passage that draws attention of a reader to such possibility: “Nevertheless, in the present form, our system does not allow for the recognition of particular types of subtle littermate-related behaviors that might skew results such as having two animals in the same chamber but facing away from each other and not interacting. While it is not possible to distinguish different types of social interactions yet, casual observations of video recordings obtained during numerous experiments lead us to believe that such events are rather accidental.”

The sentence “Even though, in the present form, our system does not allow for the recognition of particular littermate-related behaviors, results show that both Eco-HAB measures-in-cohort sociability and scent-based social approach allow for drawing similar conclusions” is not understandable to me.

The sentence was modified: “Nevertheless, in the present form, our system does not allow for the recognition of particular types of subtle littermate-related behaviors (…)”.

The Discussion is short. Some text in the Results should be in the Discussion (e.g. subsection “Eco-HAB – ethologically relevant testing of social behaviors “, last two paragraphs; subsection “Eco-HAB measurement is unbiased by social hierarchy and allows for long-term monitoring of social behavior”, last paragraph). Several of the comments in the response to reviewers would also be useful to include. The manuscript is concise but to a fault. Hold the reader's hand a bit more and help them to understand what you know so well after working on this for years.

The Discussion section was enriched and modified. Please find the changes we implemented below.

“Unlike short-term assessment using manual tests, Eco-HAB allows for long-term monitoring of social behaviors. Importantly, data collected in Eco-HAB show that the dynamics of response to social stimuli may differ depending on the tested strain of mice (see Figure 3—figure supplement 2).”

“In contrast to available open-arena set-ups, the apparatus we constructed allows mice to display their natural affiliation patterns. […] One can also envision expanding these measurements beyond mice to include other rodents, such as prairie or meadow voles.”

“A noteworthy asset of the Eco-HAB apparatus is the free, custom software which aids in obtaining effective measurements and speeds up data analysis. Appropriate programs were created for the purpose of data collection and conversion as well as in-depth evaluation of social behaviors. This code is open source and can be expanded to encompass new analyses. Assessing reliability of different behavioral measures, we chose the most valid.”

“Nevertheless, in the present form, our system does not allow for the recognition of particular types of subtle littermate-related behaviors that might skew results such as having two animals in the same chamber but facing away from each other and not interacting. While it is not possible to distinguish different types of social interactions yet, casual observations of video recordings obtained during numerous experiments lead us to believe that such events are rather accidental.”

Figure 5. The original is in original form I believe and still does not speak to reproducibility as do Figure 5—figure supplements 1-3. The supplemental figures are very useful and should be the main figure. I do not know what Figure 5 shows in its present form. Here is a suggestion. Make different symbols for the two cohorts in each condition (wt vs. fmr1 and via vs. control). Then line them up from highest to lowest. As it is the individuals are ordered along the x axis by mouse number or some other arbitrary/meaningless parameter. This simply does not show replication. If anything it is a messy version of a scatter or box plot of the data showing variability and range.

Figure 5 and its legend: “(…) Each column represents one cohort of animals, while data points (dots and squares) represent scores of particular mice.”) was adjusted in accordance to your suggestions, to clearly show scores of mice grouped in a given cohort. Further, as advised we also changed Figure 5—figure supplements 1-3 into main figures numbered 6 to 8.

What are the ovals in Figure 5—figure supplement 3? The dots are averages from the two days of testing?

Figure 5—figure supplement 3 (now Figure 8) has been described more precisely. We have adjusted the legend: “Eco-HAB allows remarkably reproducible assessment of approach to social odor in both (a) wild-type mice (n=9) and (b) Fmr1 knockouts (n=11). Evaluation of social behavior of subjects was repeated twice in identical Eco-HAB experiments, separated by a 10-day period of regular housing. Each aligned dot and square encircled by an oval represent individual score of approach to social odor for each tested mouse, measured in two subsequent experimental repetitions. Dots are data, while the ovals serve to guide the eye. Data presented are logarithmic values.”

Reviewer #2:

Most of the concerns I had have been appropriately address in the new version of the manuscript. Now it is clear that software and data are open. It is also more clear the comparison with other methods and how this setup is more reliable than others and that levels of stress are lower than in 3-chamber setups.

The comparison with standard 3-chamber setups is, in summary, quite deep. However, the comparison with open arenas (Weissbrod, 2103) is only verbal. The authors say that in open arenas animals have territorial fights, as recognized in Weissbrod 2013. However, I see no comparison now between the number of fights or stress levels in the present setup vs. Weissbrod 2013. The reader is left to assume that, because the setup is inspired in ethologically relevant behavior, it must obviously be true that there is less aggression. In the most beautiful scenario, we would have the wild, open arena and present setup measurements of aggressive encounters. In the next level at least a comparison between open arenas and this set-up. But, to avoid doing new experiments, I think the minimum would be to re-analize the data to measure aggression. Video data was acquired, so it should most probably be possible to analyze this data for aggression encounters.

Following your advice we quantified number and time of aggressive encounters for every tested strain and presented them in the new figure (see Figure 9—figure supplement 1 and its legend: “Figure 9—figure supplement 1. Aggressive interactions during testing in Eco-HAB are rare regardless of the tested strain. Number of episodes and duration of aggressive behaviors in VPA-treated and control BALB/c (a, b), VPA-treated and control C57BL/6 (c, d) and Fmr1 knockout and wild-type mice (e, f) during first 6 hours of adaptation phase, as counted per each pair of animals within a tested cohort. Aggressive encounters, namely fighting, chasing and biting were quantified by manual video-based scoring and then divided by the number of mouse pairs in a given cohort.”). Behaviors were measured by manual video-based scoring of previously obtained recordings. We assessed aggression encounters during first 6 hour period of the dark phase at the beginning of the adaptation period, the time when animals are most active, intensively exploring new environment and when potential aggressive behaviors were most probable, due to yet unstable social relations on novel territory (description added in Materials and methods section, see subsection “Measurement of aggressive encounters in Eco-HAB”).

Associated Data

    This section collects any data citations, data availability statements, or supplementary materials included in this article.

    Supplementary Materials

    Figure 3—source data 1. Eco-HAB measured social approach and in-cohort sociability of valproate-treated and control C57BL/6 and BALB/c mice.

    The names of the Excel sheets refer to corresponding figures and contain data used for analysis of the behavioral measures obtained by the implementation of Eco-HAB.py software (see 'Materials and methods').

    DOI: http://dx.doi.org/10.7554/eLife.19532.012

    DOI: 10.7554/eLife.19532.012
    Figure 3—source data 2. Eco-HAB measured social approach and in-cohort sociability of valproate-treated and control C57BL/6 and BALB/c mice.

    The names of the Excel sheets refer to corresponding figures and contain data used for analysis of the behavioral measures obtained by the implementation of Eco-HAB.py software (see Materials and methods).

    DOI: http://dx.doi.org/10.7554/eLife.19532.013

    DOI: 10.7554/eLife.19532.013
    Figure 3—source data 3. Eco-HAB measured social approach and in-cohort sociability of valproate-treated and control C57BL/6 and BALB/c mice.

    The names of the Excel sheets refer to corresponding figures and contain data used for analysis of the behavioral measures obtained by the implementation of Eco-HAB.py software (see Materials and methods).

    DOI: http://dx.doi.org/10.7554/eLife.19532.014

    DOI: 10.7554/eLife.19532.014
    Figure 3—source data 4. Eco-HAB measured social approach and in-cohort sociability of valproate-treated and control C57BL/6 and BALB/c mice.

    The names of the Excel sheets refer to corresponding figures and contain data used for analysis of the behavioral measures obtained by the implementation of Eco-HAB.py software (see Materials and methods).

    DOI: http://dx.doi.org/10.7554/eLife.19532.015

    DOI: 10.7554/eLife.19532.015
    Figure 4—source data 1. Eco-HAB measured social approach and in-cohort sociability of Fmr1 knockouts and wild-type controls.

    The names of the Excel sheets refer to corresponding figures and contain data used for analysis of the behavioral measures obtained by the implementation of Eco-HAB.py software (see 'Materials and methods').

    DOI: http://dx.doi.org/10.7554/eLife.19532.019

    DOI: 10.7554/eLife.19532.019
    Figure 4—source data 2. Eco-HAB measured social approach and in-cohort sociability of Fmr1 knockouts and wild-type controls.

    The names of the Excel sheetsrefer to corresponding figures and contain data used for analysis of the behavioral measures obtained by the implementation of Eco-HAB.py software (see 'Materials and methods').

    DOI: http://dx.doi.org/10.7554/eLife.19532.020

    DOI: 10.7554/eLife.19532.020
    Figure 5—source data 1. Eco-HAB measured social approach score for valproate-treated and control C57BL/6 and BALB/c mice and Fmr1 knockouts and wild-type controls.

    These data are identical to Figure 3A—source data 1, Figure 3E—source data 3, Figure 4A—source data 1 with respect to Figures 3A,E and 4A and are available as a separate file for the readers’ convenience.

    DOI: http://dx.doi.org/10.7554/eLife.19532.022

    DOI: 10.7554/eLife.19532.022
    Figure 5—source data 2. Eco-HAB measured social approach score for valproate-treated and control C57BL/6 and BALB/c mice and Fmr1 knockouts and wild-type controls.

    These data are identical to Figure 3A—source data 1, Figure 3E—source data 3, Figure 4A—source data 1 with respect to Figures 3A,E and 4A and are available as a separate file for the readers’ convenience.

    DOI: http://dx.doi.org/10.7554/eLife.19532.023

    DOI: 10.7554/eLife.19532.023
    Figure 5—source data 3. Eco-HAB measured social approach score for valproate-treated and control C57BL/6 and BALB/c mice and Fmr1 knockouts and wild-type controls.

    These data are identical to Figure 3A—source data 1, Figure 3E—source data 3, Figure 4A—source data 1 with respect to Figures 3A,E and 4A and are available as a separate file for the readers’ convenience.

    DOI: http://dx.doi.org/10.7554/eLife.19532.024

    DOI: 10.7554/eLife.19532.024
    Figure 6—source data 1. We include source data for Figures 6, 7 and 8 concerning reproducibility results of both Eco-HAB measures.

    The names of the Excel sheets refer to corresponding figures and contain data used for analysis of the behavioral measures obtained by the implementation of Eco-HAB.py software (see 'Materials and methods').

    DOI: http://dx.doi.org/10.7554/eLife.19532.026

    DOI: 10.7554/eLife.19532.026
    Figure 6—source data 2. We include source data for Figures 6, 7 and 8 concerning reproducibility results of both Eco-HAB measures.

    The names of the Excel sheetsrefer to corresponding figures and contain data used for analysis of the behavioral measures obtained by the implementation of Eco-HAB.py software (see Materials and methods).

    DOI: http://dx.doi.org/10.7554/eLife.19532.027

    DOI: 10.7554/eLife.19532.027
    Figure 7—source data 1. We include source data for Figures 6, 7 and 8 concerning reproducibility results of both Eco-HAB measures.

    The names of the Excel sheetsrefer to corresponding figures and contain data used for analysis of the behavioral measures obtained by the implementation of Eco-HAB.py software (see Materials and methods).

    DOI: http://dx.doi.org/10.7554/eLife.19532.029

    DOI: 10.7554/eLife.19532.029
    Figure 7—source data 2. We include source data for Figures 6, 7 and 8 concerning reproducibility results of both Eco-HAB measures.

    The names of the Excel sheetsrefer to corresponding figures and contain data used for analysis of the behavioral measures obtained by the implementation of Eco-HAB.py software (see Materials and methods).

    DOI: http://dx.doi.org/10.7554/eLife.19532.030

    DOI: 10.7554/eLife.19532.030
    Figure 8—source data 1. We include source data for Figures 6, 7 and 8 concerning reproducibility results of both Eco-HAB measures.

    The names of the Excel sheetsrefer to corresponding figures and contain data used for analysis of the behavioral measures obtained by the implementation of Eco-HAB.py software (see Materials and methods).

    DOI: http://dx.doi.org/10.7554/eLife.19532.032

    DOI: 10.7554/eLife.19532.032
    Figure 8—source data 2. We include source data for Figures 6, 7 and 8 concerning reproducibility results of both Eco-HAB measures.

    The names of the Excel sheetsrefer to corresponding figures and contain data used for analysis of the behavioral measures obtained by the implementation of Eco-HAB.py software (see Materials and methods).

    DOI: http://dx.doi.org/10.7554/eLife.19532.033

    DOI: 10.7554/eLife.19532.033
    Figure 9—source data 1. Raw data from U-tube dominance test and Eco-HAB measured activity (number of visits to all compartments of the apparatus during 1st 12-hr period of adaptation).

    Figure 9 depicts correlation between those two variables.

    DOI: http://dx.doi.org/10.7554/eLife.19532.035

    DOI: 10.7554/eLife.19532.035
    Figure 9—source data 2. Raw data from U-tube dominance test and Eco-HAB measured activity (number of visits to all compartments of the apparatus during 1st 12 hr period of adaptation).

    Figure 9 depicts correlation between those two variables.

    DOI: http://dx.doi.org/10.7554/eLife.19532.036

    DOI: 10.7554/eLife.19532.036
    Supplementary file 1. Eco-HAB.py scripts with sample data enabling their execution.

    DOI: http://dx.doi.org/10.7554/eLife.19532.038

    elife-19532-supp1.zip (583.2KB, zip)
    DOI: 10.7554/eLife.19532.038

    Articles from eLife are provided here courtesy of eLife Sciences Publications, Ltd

    RESOURCES