. 2016 Oct 12;5:e19532. doi: 10.7554/eLife.19532

Figure 3. Sociability measurements in Eco-HAB and three-chambered apparatus social approach test performed under stress reducing conditions.

Figure (ad) depict tests involving C57BL/6 mice and (eh) tests involving BALB/c mice. (a) and (e) show social approach in the Eco-HAB system defined as the increase in proportion of time spent in the compartment with social odor during the first hour after its presentation, divided by the proportion of time spent in the compartment with non-social stimulus. For (a), VPA-treated n = 26 and CTRL n = 35. For (e), VPA-treated n = 18 and CTRL n = 20. (b) and (f) show social approach in the three-chambered test, defined as the increase in proportion of time spent in the compartment with an unfamiliar mouse, divided by the proportion of time spent in the compartment with unfamiliar inanimate object. For (b), VPA-treated n = 18, CTRL n = 27. For (f), VPA-treated n = 23 and CTRL n = 26. (c) and (g) show density plot matrices for Eco-HAB housed control and valproate-treated cohorts. Each small square, for which position in the matrix represents one pair of subjects, shows the total time spent together minus the time animals would spend together assuming independent exploration of the apparatus (see 'Materials and methods'). Histograms (d) and (h) show the distribution of this measure for all pairs of valproate-treated and control animals. Data are mean values and error bars represent SEM, *p<0.05, **p<0.01, ***p<0.001 (Mann-Whitney U-test).

DOI: http://dx.doi.org/10.7554/eLife.19532.011
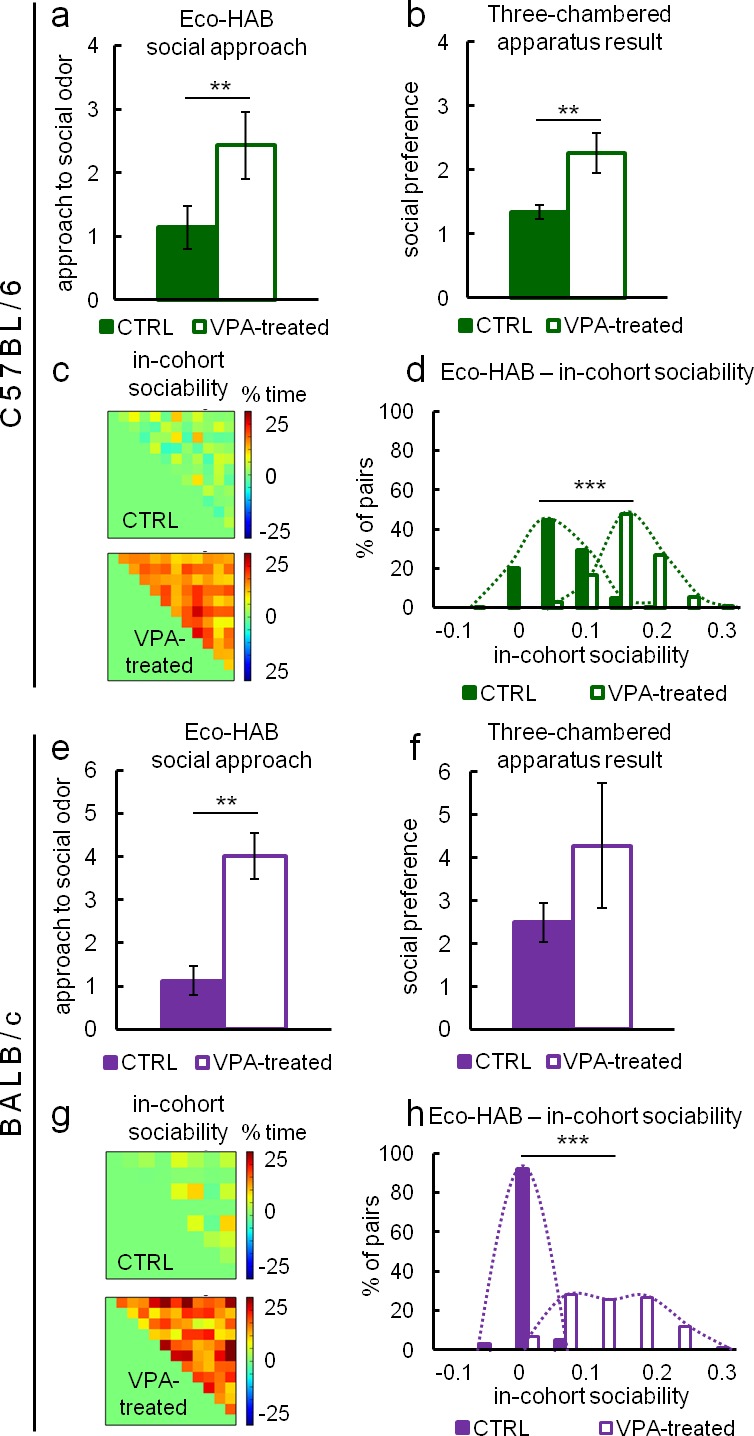
Figure 3—source data 1. Eco-HAB measured social approach and in-cohort sociability of valproate-treated and control C57BL/6 and BALB/c mice.
The names of the Excel sheets refer to corresponding figures and contain data used for analysis of the behavioral measures obtained by the implementation of Eco-HAB.py software (see 'Materials and methods').
DOI: 10.7554/eLife.19532.012
Figure 3—source data 2. Eco-HAB measured social approach and in-cohort sociability of valproate-treated and control C57BL/6 and BALB/c mice.
The names of the Excel sheets refer to corresponding figures and contain data used for analysis of the behavioral measures obtained by the implementation of Eco-HAB.py software (see Materials and methods).
DOI: 10.7554/eLife.19532.013
Figure 3—source data 3. Eco-HAB measured social approach and in-cohort sociability of valproate-treated and control C57BL/6 and BALB/c mice.
The names of the Excel sheets refer to corresponding figures and contain data used for analysis of the behavioral measures obtained by the implementation of Eco-HAB.py software (see Materials and methods).
DOI: 10.7554/eLife.19532.014
Figure 3—source data 4. Eco-HAB measured social approach and in-cohort sociability of valproate-treated and control C57BL/6 and BALB/c mice.
The names of the Excel sheets refer to corresponding figures and contain data used for analysis of the behavioral measures obtained by the implementation of Eco-HAB.py software (see Materials and methods).
DOI: 10.7554/eLife.19532.015

Figure 3.

Figure 3—figure supplement 1. Three-chambered apparatus testing performed on group-housed valproate-treated C57BL/6 (VPA-treated n = 14, CTRL n = 38) (a) and BALB/c (n = VPA-treated n = 15, CTRL n = 17) (b) mice did not reveal any differences in sociability.
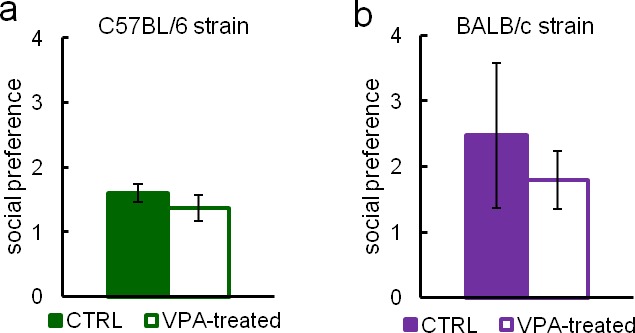
Figure 3—figure supplement 1.

Data are represented as mean ± SEM.
Figure 3—figure supplement 2. Eco-HAB allows for long-term monitoring of responses to social stimuli.
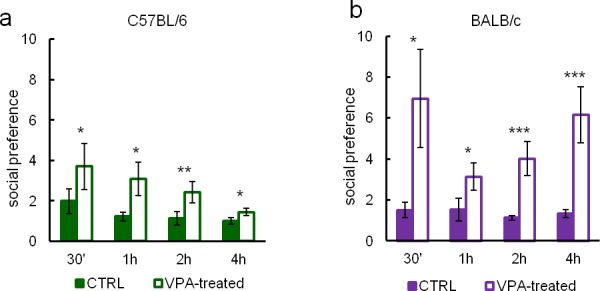
Figure 3—figure supplement 2.

We assessed subjects approach to social odor in four different periods, namely 30’, 1 hr, 2 hr, and 4 hr after the presentation of olfactory stimuli, in order to see how their behavior changes with time. Approach to social odor in (a) valproate-treated C57BL/6 mice (n = 26) gradually decreases during first 4 hr of testing, whereas in (b) valproate-treated BALB/c mice (n = 18) it is high and stable during this time. In control C57BL/6 mice (n = 35) and BALB/c mice (n = 20) approach to social odor gradually decreases with a faster decrease rate in C57BL/6 mice. Data are represented as mean, error bars represent SEM, *p<0.05, **p<0.01, ***p<0.001 (Mann-Whitney U-test).