. 2016 Oct 12;5:e19532. doi: 10.7554/eLife.19532

Figure 5. Eco-HAB provides reproducible assessment of approach to social odor in group-housed mice.
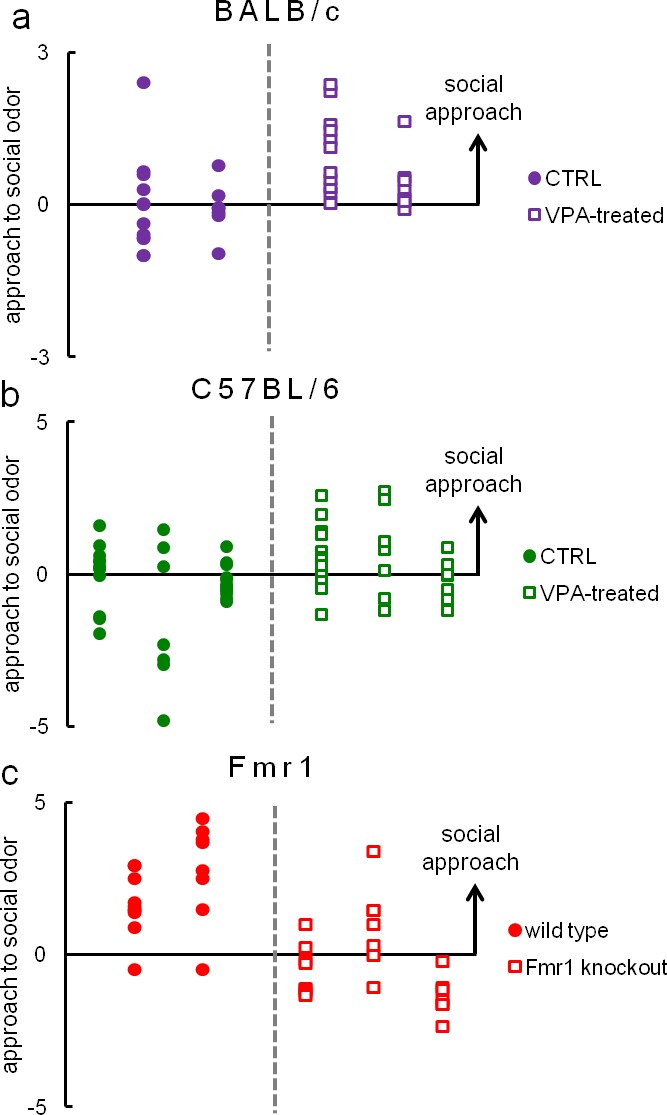
Figure 5.

Individual results of approach to social odor for all cohorts of (a) valproate-treated (n = 20) and control (n = 18) BALB/c subjects (4 cohorts), (b) valproate-treated (n = 26) and control (n = 35) C57BL/6 mice (6 cohorts) and (c) Fmr1 knockouts (n = 22) and wild-type (n = 18) animals (5 cohorts). Each column represents one cohort of animals, while data points (dots and squares) represent scores of particular mice. Since the measure of approach to social odor is a proportion (for detailed description see 'Materials and methods'), which may take values from 0 to +∞, we present logarithmic data to depict reproducibility of social preference and social avoidance in an unbiased manner. All analyses, including statistical testing, were performed on raw data. Average results of these data are presented in Figures 3A,E and 4A, respectively.

DOI: http://dx.doi.org/10.7554/eLife.19532.021

Figure 5—source data 1. Eco-HAB measured social approach score for valproate-treated and control C57BL/6 and BALB/c mice and Fmr1 knockouts and wild-type controls.
These data are identical to Figure 3A—source data 1, Figure 3E—source data 3, Figure 4A—source data 1 with respect to Figures 3A,E and 4A and are available as a separate file for the readers’ convenience.
DOI: 10.7554/eLife.19532.022
Figure 5—source data 2. Eco-HAB measured social approach score for valproate-treated and control C57BL/6 and BALB/c mice and Fmr1 knockouts and wild-type controls.
These data are identical to Figure 3A—source data 1, Figure 3E—source data 3, Figure 4A—source data 1 with respect to Figures 3A,E and 4A and are available as a separate file for the readers’ convenience.
DOI: 10.7554/eLife.19532.023
Figure 5—source data 3. Eco-HAB measured social approach score for valproate-treated and control C57BL/6 and BALB/c mice and Fmr1 knockouts and wild-type controls.
These data are identical to Figure 3A—source data 1, Figure 3E—source data 3, Figure 4A—source data 1 with respect to Figures 3A,E and 4A and are available as a separate file for the readers’ convenience.
DOI: 10.7554/eLife.19532.024