Abstract
Imaging mouse models of human cancer promises more effective analysis of tumor progression and reduction of the number of animals needed for statistical power in preclinical therapeutic intervention trials. This study utilizes positron emission tomography imaging of 2-[18F]-fluoro-deoxy-d-glucose to monitor longitudinal development of mammary intraepithelial neoplasia outgrowths in immunocompetent FVB/NJ mice. The mammary intraepithelial neoplasia outgrowth tissues mimic the progression of breast cancer from premalignant ductal carcinoma in situ to invasive carcinoma. Progression of disease is clearly evident in the positron emission tomography images, and tracer uptake correlates with histological evaluation. Furthermore, quantitative markers of disease extracted from the images can be used to track proliferation and progression in vivo over multiple time points.
Genetically engineered mice have become the sine qua non models of human cancers, providing the biologic raw material for elucidating fundamental mechanisms of carcinogenesis and simultaneously serving as a tool for rapidly assessing tumor and host responses to novel potential therapeutic interventions in studies commonly referred to as “preclinical” trials (1-3). As these model systems evolve to more closely approximate the neoplastic progression of human disease (4, 5) and the heterogeneous tumor environment (6, 7), they expose limitations of traditional methods for assessing progression and proliferation of disease. Histological sections are the gold standard for phenotypic analysis of cancer cells but require removal of the tissue (or death of the mouse), which precludes further biologic analysis. Alternatively, manual or caliper palpation is often used as a simple in vivo measure of tumor proliferation but cannot be used to measure early stages of disease that are not palpable. Recently developed technologies for in vivo imaging allow a single animal to be followed over multiple time points (8, 9). Noninvasive longitudinal imaging has the potential for precise and efficient analysis of tumor initiation and progression, may allow detection of distant metastatic disease, and could significantly reduce the number of animals needed for statistical power in preclinical therapeutic intervention trials (10).
Here we show that positron-emission tomography (PET), using 2-[18F]-fluoro-deoxy-d-glucose (FDG) and a high-resolution scanner designed for laboratory animal imaging, is sensitive enough to detect and quantify premalignant lesions in a mouse model of breast cancer and to document the transition into invasive malignancy. Although this model will consistently transform to malignant disease, latencies, as measured by time to palpable lesion, range from 3.4 to 18.7 weeks, with an average time of ≈11 weeks (11). The mouse model consists of six transplantable tissue lines with different morphological and developmental phenotypes. All results in this work are derived from Line 8w-B, which exhibits rapid progression to tumor and relatively slow rate of metastasis. Precise assessment of neoplastic progression over time is critical to understanding factors related to malignant transformation and evaluating potential modifiers in preclinical studies.
PET imaging with FDG has been widely used clinically for detecting, staging, and monitoring therapeutic response in a wide variety of human cancers, including breast cancer (12-14). However, the reduced size of pathology in small-animal models of human diseases has motivated the development of dedicated small-animal scanners with increased resolution and sensitivity. The goal of this study was to validate in vivo small-animal PET imaging as a surrogate for standard ex vivo histological measures of disease proliferation and progression that preclude the possibility of longitudinal assessment.
Methods
The study reported here monitors the longitudinal development of disease in a mouse mammary tumor model of human breast cancer originating from ductal carcinoma in situ (DCIS). The model (15) consists of mammary tissue transplantations originally derived from transgenic mice constructed with the polyomavirus middle-T oncogene promoted by the mouse mammary tumor virus long terminal repeat (16, 17). Transplants into gland-cleared mammary fat pads of syngeneic immunocompetent mice (FVB/NJ, The Jackson Laboratory) result in hyper-plastic and dysplastic growth, which remains confined to the dimensions of the stroma and is analogous to human DCIS (2). These mammary intraepithelial neoplastic outgrowths (MIN-Os) consistently undergo malignant transformation to a phenotype capable of autonomous ectopic growth and metastasis. The course of disease approximates the neoplastic progression of human breast carcinoma from preinvasive DCIS to invasive carcinoma with metastatic potential.
Imaging was performed with a microPET P4 scanner (Concorde Microsystems, Knoxville, TN), a dedicated PET system for small-animal imaging (18) using FDG as the radiopharmaceutical. The primary mechanism of enhanced FDG uptake in tumors is via up-regulation of glucose transporters, although other factors related to the in vivo tumor microenvironment have also been implicated (19-22).
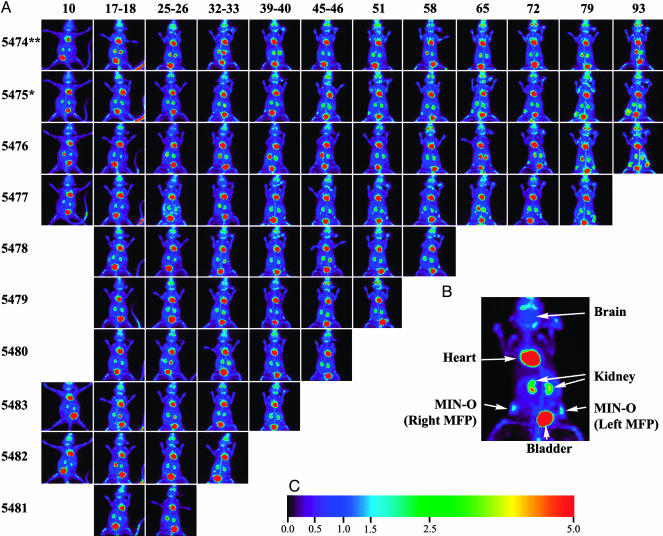
Two sets of animal studies were used in this work. In the first experiment, a group of 10 mice were followed from 10 to 93 days posttransplantation, with imaging occurring every week starting at day 10. The purpose was to investigate in vivo development of MIN-O transplants with PET imaging and to make comparisons with histological evaluations of the same tissues at various points in the developmental timeline. At 3 weeks of age, 8 of the 10 animals received transplants of MIN-O tissue into the no. 4 mammary fat pads (right and left, located laterally from the bladder) after preclearing the glandular tissue. All mice had eight other normal noncleared mammary glands that served as internal controls. To control for the effects of transplantation surgery, one animal (no. 5475) received transplants of MIN-O tissue into the right mammary fat pad and normal glandular mammary tissue into the left, and one animal (no. 5474) received normal transplants into both fat pads. Starting in the fourth week, predetermined animals were killed immediately after imaging, and their mammary fat pads were harvested for whole-mount and histological evaluation. Fig. 1 shows the imaging schedule for each mouse in this experiment. In the second experiment, 4 mice were imaged at 5, 6, 8, 10, and 12 weeks posttransplantation to both no. 4 mammary fat pads. The purpose of this study was to provide more data at later time points for quantitative analysis. Combined, these two studies comprised a total of 96 in vivo scans.
Fig. 1.
Longitudinal imaging with PET. (A) Layout of experimental data. Each row of images corresponds to a given animal followed in the study (identified by number at left), and each column corresponds to a time point for imaging. Animals were followed longitudinally from as early as 10 days to as late as 93 days posttransplantation of MIN-O tissue. Four animals were not imaged at the earliest time point because of the lack of a visible signal in the other six animals. At the last time point in each row, animals were killed and the mammary fat pads were prepared for ex vivo imaging and histology. (B) Example image. An enlarged view of a maximum-intensity projection of a study mouse showing uptake in various tissues, including the MIN-O tissue in the left and right no. 4 mammary fat pads. The mouse is displayed in a supine orientation. (C) Intensity scale. The color scale representing uptake relative to brain. This color scale is used for all PET images.
All experiments involving animals were carried out under institutionally approved animal protocols with guidelines specifying animal handling and welfare. In both experiments, data were acquired for 30 min starting 30 min after tail-vein injection of between 150 and 300 μCi of FDG. Mice were anesthetized with 1-2% isoflurane for the duration of the procedure. Volumetric images reflecting the spatial distribution of FDG uptake were reconstructed from the scanner data by using an iterative maximum a posteriori reconstruction algorithm (23, 24), yielding images with a volumetric resolution of ≈5 μl (5 mm3). These images were converted to a measure of relative uptake by normalizing to the reconstructed intensity in the brain of the animal. After considering a number of organs and other tissues (data not shown), the brain was determined to be a stable and reliable feature for normalization. Other methods of normalization, such as the Standard Uptake Value (25, 26), were problematic because a nontrivial fraction of the injected dose occasionally remained interstitially in the tail of an animal. Hence the injected dose was not always an accurate measure for tracer availability to tissue.
Results and Discussion
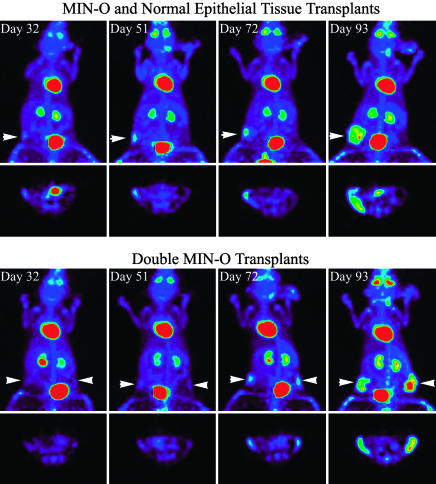
Longitudinal Progression. Longitudinal progression of disease could be detected with PET imaging. Fig. 1A shows the progression of disease for mice in the first experiment. Fig. 1B shows the uptake pattern in a sample mouse image. In addition to activity in MIN-O in the right and left mammary fat pads, images show areas of high metabolic activity in the heart along with activity in FDG excretion pathways such as the kidneys and bladder. Sporadic activity was observed at times in bone marrow as well as at sites of inflammation around the left ear due to ear tag infection. With the exception of the earliest animal killed (no. 5481), radiotracer uptake indicative of premalignant disease was detected in all MIN-O transplant sites within 25-32 days. The earliest palpable tumor was found at 79 days, and hence PET imaging was able to detect proliferating disease several weeks before it became palpable. Fig. 2 shows more detailed images of two mice sampled at four time points during the experiment. The top row of Fig. 2 shows the single control animal at weeks 4, 7, 10, and 13; the bottom row shows images of a double transplant animal at the same time points. The images of each animal consist of coronal maximum-intensity projections (MIPs, above) and a representative tomographic transverse slice (below). The MIP images provide a convenient way to survey the entire animal, whereas the transverse slices show development in a specific cross section of the mammary fat pad. In both images, a steady progression of disease can be seen across different time points. This progression can be seen as a growth in the size of transplanted tissue as well as an increase in uptake of FDG. In the single control animal, the only detectable development occurs on the side with the MIN-O transplant tissue. The eight normal mammary fat pads (not receiving transplant) in each mouse show no increased uptake, indicating that the observed uptake in affected tissues does not arise from other developmental processes in the mammary fat pad. All normal tissue transplants exhibit no detectable uptake above background, thereby ruling out the effects of transplant surgery as a mechanism for the observed uptake in the affected mammary fat pads. In the context of these controls, the images in Fig. 2 provide clear qualitative evidence that MIN-O tissue exhibits preferential uptake of FDG yielding disease-specific contrast in the PET images, and both size and uptake increase over time as disease progresses.
Fig. 2.
Longitudinal development and malignant transformation; disease development in the single control animal (no. 5475, Upper) and a double MIN-O animal (no. 5476, Lower), each consisting of coronal maximum-intensity projections and transverse slices in the area of disease. In the single control we see increased uptake only in the MIN-O tissue in the right mammary fat pad (indicated by the arrow). The normal endothelial tissue transplant in left mammary fat pad did not exhibit any noticeable increase in uptake. In both cases, the MIN-O tissue has undergone transformation from premalignant neoplasia to invasive carcinoma by 93 days. The development of disease shows a marked increase in uptake as well as growth within the fat pad thickening of the fat pad in later stages.
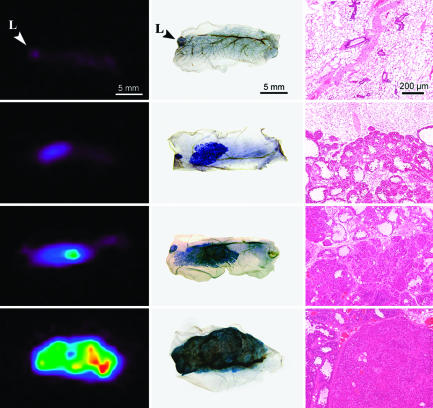
FDG Uptake vs. Histology. As described above, mammary fat pads were harvested on a predefined schedule from animals killed immediately after their last in vivo scan. The ex vivo mammary tissue was then imaged in the microPET scanner before being fixed for histological preparations. Fig. 3 shows comparisons of the same tissue samples with PET images, whole-mount preparations, and hematoxylin/eosin-stained microscopic sections. The mammary whole mounts show the degree of filling of the mammary fat pads, the subgross anatomy of the MIN-O transplant, and the more densely staining invasive tumors arising within the MIN-O. Staining of the whole-mount images corresponds well with uptake in the ex vivo PET images. The whole-mount images show the presence of a lymph node in some cases, which can also be found in the PET images.
Fig. 3.
Ex vivo PET and histology images. Each row of images corresponds to tissue from a single mammary fat pad. Excised fat pads were fixed in formalin shortly after PET imaging. The tissues were then stained with hematoxylin and imaged for whole-mount slides and subsequently processed to obtain the hematoxylin/eosin-stained sections. Normal epithelial tissue and native lymph nodes (L) exhibit little uptake of 18FDG. MIN-O tissues show preferential uptake from the premalignant stage, increasing throughout the transformation to malignant carcinoma, and in subsequent tumor development. In particular, the third row of images demonstrates increased uptake in the malignant region of the tissue. The histology sections show that this region is marked by a transition from diffuse to solid growth.
As was seen in the longitudinal images of Figs. 1 and 2, later time points generally result in large and rapidly growing tumors with higher uptake in the PET images. Whole-mount images allow a more careful examination of the diseased tissue in the mammary fat pad and a better understanding of tracer uptake and specificity. For example, whole-mount mammary glands in Fig. 3 show focal and more widespread increased staining in the third and fourth rows, respectively. These densely stained regions correspond to more densely cellular areas in microscopic images of the MIN-O/tumor interface in the third column. Dense cellular areas arising in MIN-Os have been shown to have fully transformed malignant behavior in a “test by transplantation” (15), the standard for demonstrating malignancy. No distinct difference in microvessel density between premalignant and malignant tissue was detected with CD31 immunohistochemistry (data not shown). Each PET image in the first column of Fig. 3 displays increased uptake in precisely the areas indicated in the whole-mount image and the microscopic slide. This correspondence provides further evidence that increased uptake of FDG is related to progression of disease.
The histological section of normal epithelial tissue transplant in the single control animal shows low-density ductal proliferation throughout the mammary fat pad and corresponding low levels of activity in the PET image. Premalignant MIN-O tissue exhibits more extensive but diffuse proliferation histologically and shows higher uptake in ex vivo PET images as well. MIN-O tissue that has made the transformation to malignant disease has dense solid growth with the highest relative uptake of FDG.
Estimates of Volume and Uptake over Time. To be useful for preclinical evaluations of drugs and other therapeutics, any method for assessing lesions must provide the ability to test hypotheses related to disease development. For in vivo imaging methods, such an approach necessitates extraction of a limited set of relevant markers that are quantitative and reproducible. We have used the volumetric PET images to evaluate quantitative estimates of the maximum uptake of FDG in MIN-O tissues as well as functionally active volume and total integrated uptake of the tissues. At the core of these quantitative estimates is a simple segmentation algorithm that identifies a connected group of voxels with uptake greater than a user-input threshold. After segmentation, quantitative parameters such as maximum up-take, volume, and total uptake can be readily calculated.
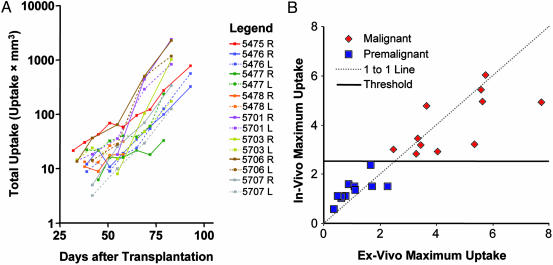
Fig. 4 shows plots of quantitative markers for mice from both experiments. The plot quantifies proliferation of the MIN-O tissue over roughly two orders of magnitude and in excess of 30 days before the first palpable lesions were found. We have computed similar plots for lesion volume and maximum uptake (see Fig. 6, which is published as supporting information on the PNAS web site).
Fig. 4.
Quantitation plots. (A) Plots show the total uptake of FDG within each segmented lesion as a function of time from transplantation of the MIN-O tissue. Points with a functionally active volume <6 mm3 (roughly the volumetric resolution of the scanner) were excluded because of concern over the accuracy of the segmentation, and animals killed <50 days after tissue transplantation were excluded because of limited data. (B) In vivo and ex vivo measurements of maximum uptake, acquired shortly before tissues were fixed for histological processing to determine the malignancy status. A slope-1 line has been added for reference as well as the uptake threshold of 2.5, which discriminates premalignant and malignant lesions.
Longitudinal imaging for preclinical studies offers the possibility of evaluating an animal before administration of a therapeutic agent, thereby allowing each animal to act as its own control. The result is an increase in statistical power for detecting changes in size or uptake. The magnitude of statistical power increase depends on the correlation between different time points. Strong Pearson correlations between measurements at different time points (0.6-0.99) suggest a substantial increase in statistical power (a factor of 2.5 to >10) can be achieved using longitudinal data.
Fig. 4B plots maximum uptake within the segmented region of interest in the last in vivo scan against the same measure in the ex vivo scan acquired immediately thereafter. The plot shows good agreement between the two measures despite the tissue harvesting procedure and a number of imaging considerations such as differences in attenuation, scatter, spillover, and partial volume effects. The correspondence demonstrates that the up-take measured in vivo is in fact coming from the tissue of interest.
After the ex vivo scans, the tissues were processed histologically and the presence of malignancy determined by histomorphology. Using histology as the gold standard for assessing the malignancy status of tissues, we find a clear partitioning of the data based on the measured maximum uptake of the lesion. As seen in Fig. 4B, a maximum uptake threshold of 2.5 or greater is able to discriminate malignant from premalignant tissue. Although total uptake and active volume are also able to discriminate the data well (see Fig. 7, which is published as supporting information on the PNAS web site), maximum uptake is more robust to the process of segmentation and perhaps more reflective of the cellular biology.
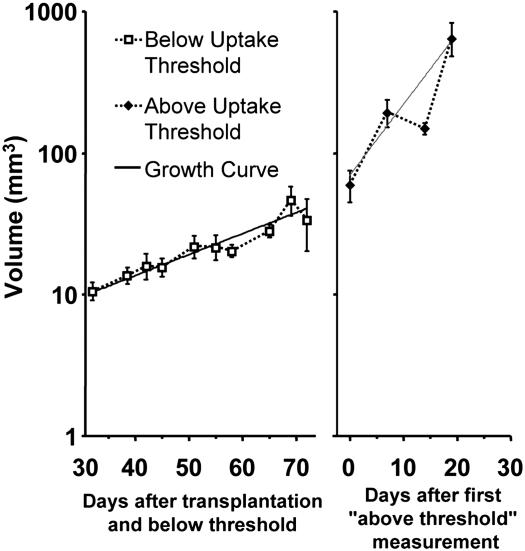
Fig. 5 plots the active volume as a function of time relative to transplantation for premalignant lesions and relative to the time of malignant transformation for malignant lesions defined using the maximum uptake threshold as the criteria. The average volume estimates are modeled by two distinct exponential growth rates fitted by nonlinear regression and plotted with the data. The first is an early growth rate with a volume-doubling time of ≈20.3 days (95% confidence interval, 15.8-28.3 days). This growth curve is representative of MIN-Os at early stages of the experiment when the tissue was still in a precancerous state. Lesions are not palpable at this time. After malignant transformation, the volume is seen to transition to a more rapid growth rate with ≈6.0 day doubling time (95% confidence interval, 3.8-14.1 days). This plot demonstrates the utility of an in vivo marker of malignant transformation for sorting data into different phenotypic regimes.
Fig. 5.
Volume estimates pre- and postmalignant transformation. Data points were sorted into the two categories by using the maximum uptake threshold as the criteria and are plotted as average volume (±1 SE). Exponential growth models were fitted to each data set by using nonlinear regression and are plotted with the data.
Conclusion
This study demonstrates that functional PET imaging using FDG on a dedicated small-animal scanner can be used to follow the course of disease in vivo for this mouse model of breast cancer. Lesions are visible at an early premalignant stage, well in advance of the point where they can be found by visual inspection or palpation. Uptake of FDG in MIN-O tissue corresponds to histological measures of development, albeit at a coarser spatial resolution. The maximum uptake of MIN-O tissue in the PET image corresponds to the histological stage of disease. In all cases, tissue that exhibited a maximum uptake of 2.5 or more relative to uptake in the brain contained malignant disease, indicating the utility of this measure for in vivo determination of disease stage. High uptake corresponds to regions of solid growth indicative of tissue that has undergone transformation to invasive carcinoma. Although the histological evaluations that establish this could be performed only ex vivo on harvested tissues, the relevant markers of disease progression and proliferation can be extracted in vivo with fairly straightforward image analysis.
Accurate markers of disease progression and proliferation extracted from in vivo images are necessary for longitudinal studies and allow the possibility of preclinical studies evaluating therapeutics. The ability to determine the point of malignant transformation allows efficacy of therapeutics to be determined both pre- and posttransformation or for including stage of disease (premalignant vs. malignant) as a statistical covariate in more general studies. Quantitative markers of disease progression and proliferation, extracted using image analysis, show high positive correlation between time points leading to a substantial longitudinal advantage for detecting differences in tumor development. Thus in vivo imaging methods can result in a substantial reduction in the number of animals needed for a given level of significance, both by following a single animal over time and because of increased statistical efficiency of the resulting data.
Using 2.5 times the uptake in the brain as an in vivo criterion for malignant disease, we find significant changes in growth rates of segmented volumes before and after transformation. These parameters provide baseline values against which effects of exogenous stimuli such as novel potential therapeutic interventions can be compared. High variability of the quantitative markers between different animals combined with high positive correlation between time points in a given animal indicate a substantial advantage to longitudinal studies in determining changes in lesion size or uptake over time. These data indicate the unmodified course of disease in this mouse model. The growth and uptake curves can be used as baseline measures for future studies of therapeutic interventions.
We have demonstrated that in vivo imaging with PET allows a quantitative evaluation of progression and malignant transformation in this mouse model of breast cancer. It is thus well suited to following disease in cohorts of mice for preclinical trials assessing new therapeutics. Based on the uptake of FDG across a wide range of human cancers (12), we believe that this general approach will be applicable to a broad spectrum of mouse models of human cancer.
Supplementary Material
Acknowledgments
We acknowledge Carol L. MacLeod and Larry Young for characterization of the MIN-O transplant (with support from National Institutes of Health Grant R01 CA81376); Calliandra Harris and Stephen Rendig for operation of the microPET scanner; and Richard Leahy, Bing Bai, and Quanzheng Li of the University of Southern California for assistance with the maximum a posteriori reconstruction code. Robert Munn provided assistance in preparing the figures. We also gratefully acknowledge support from the National Institutes of Health (Grants R21 CA102733, R01 EB000561, and R01 CA89140) and the Whitaker Foundation.
Abbreviations: PET, positron-emission tomography; FDG, 2-[18F]-fluoro-deoxy-d-glucose; MIN-O, mammary intraepithelial neoplastic outgrowth.
References
- 1.Cardiff, R. D. & Muller, W. J. (1993) Cancer Surv. 16, 97-113. [PubMed] [Google Scholar]
- 2.Cardiff, R. D., Moghanaki, D. & Jensen, R. A. (2000) J. Mamm. Gland Biol. Neoplasia 5, 421-437. [DOI] [PubMed] [Google Scholar]
- 3.Kavanaugh, C. & Green, J. E. (2003) J. Nutr. 133, 2404S-2409S. [DOI] [PubMed] [Google Scholar]
- 4.Cardiff, R. D. (2001) Microsc. Res. Tech. 52, 224-230. [DOI] [PubMed] [Google Scholar]
- 5.Cardiff, R. D. (2003) Comp. Med. 53, 250-253. [PubMed] [Google Scholar]
- 6.Bhujwalla, Z. M., Artemov, D., Aboagye, E., Ackerstaff, E., Gillies, R. J., Natarajan, K. & Solaiyappan, M. (2001) Novartis Found. Symp. 240, 23-38. [DOI] [PubMed] [Google Scholar]
- 7.Schornack, P. A. & Gillies, R. J. (2003) Neoplasia 5, 135-145. [DOI] [PMC free article] [PubMed] [Google Scholar]
- 8.Phelps, M. E. (2000) Proc. Natl. Acad. Sci. USA 97, 9226-9233. [DOI] [PMC free article] [PubMed] [Google Scholar]
- 9.Cherry, S. R. & Gambhir, S. S. (2001) ILAR J. 42, 219-232. [DOI] [PubMed] [Google Scholar]
- 10.Cherry, S. R. (2001) J. Clin. Pharmacol. 41, 482-491. [DOI] [PubMed] [Google Scholar]
- 11.Maglione, J. E., McGoldrick, E. T., Young, L. J. T., Namba, R., Gregg, J. P., Liu, L., Moghanaki, D., Ellies, L. G., Borowsky, A. D., Cardiff, R. D., et al. (2004) Mol. Cancer Ther., in press. [PubMed]
- 12.Gambhir, S. S., Czernin, J., Schwimmer, J., Silverman, D. H., Coleman, R. E. & Phelps, M. E. (2001) J. Nucl. Med. 42, 1S-93S. [PubMed] [Google Scholar]
- 13.Czernin, J. (2002) Mol. Imaging Biol. 4, 35-45. [DOI] [PubMed] [Google Scholar]
- 14.Buck, A., Schirrmeister, H., Kuhn, T., Shen, C., Kalker, T., Kotzerke, J., Dankerl, A., Glatting, G., Reske, S. & Mattfeldt, T. (2002) Eur. J. Nucl. Med. Mol. Imaging 29, 1317-1323. [DOI] [PubMed] [Google Scholar]
- 15.Maglione, J. E., Moghanaki, D., Young, L. J., Manner, C. K., Ellies, L. G., Joseph, S. O., Nicholson, B., Cardiff, R. D. & MacLeod, C. L. (2001) Cancer Res. 61, 8298-8305. [PubMed] [Google Scholar]
- 16.Guy, C. T., Cardiff, R. D. & Muller, W. J. (1992) Mol. Cell. Biol. 12, 954-961. [DOI] [PMC free article] [PubMed] [Google Scholar]
- 17.Muller, W. J., Ho, J. & Siegel, P. M. (1998) Biochem. Soc. Symp. 63, 149-157. [PubMed] [Google Scholar]
- 18.Tai, Y.-C., Chatziioannou, A., Siegel, S., Young, J., Newport, D., Goble, R. N., Nutt, R. E. & Cherry, S. R. (2001) Phys. Med. Biol. 46, 1845-1862. [DOI] [PubMed] [Google Scholar]
- 19.Brown, R. S., Goodman, T. M., Zasadny, K. R., Greenson, J. K. & Wahl, R. L. (2002) Nucl. Med. Biol. 29, 443-453. [DOI] [PubMed] [Google Scholar]
- 20.Brown, R. S., Leung, J. Y., Fisher, S. J., Frey, K. A., Ethier, S. P. & Wahl, R. L. (1996) J. Nucl. Med. 37, 1042-1047. [PubMed] [Google Scholar]
- 21.Bos, R., van Der Hoeven, J. J., van Der Wall, E., van Der Groep, P., van Diest, P. J., Comans, E. F., Joshi, U., Semenza, G. L., Hoekstra, O. S., Lammertsma, A. A., et al. (2002) J. Clin. Oncol. 20, 379-387. [DOI] [PubMed] [Google Scholar]
- 22.Zasadny, K. R., Kison, P. V., Francis, I. R. & Wahl, R. L. (1998) Clin. Positron Imaging 1, 123-129. [DOI] [PubMed] [Google Scholar]
- 23.Qi, J., Leahy, R. M., Cherry, S. R., Chatziioannou, A. & Farquhar, T. H. (1998) Phys. Med. Biol. 43, 1001-1013. [DOI] [PubMed] [Google Scholar]
- 24.Chatziioannou, A., Qi, J., Moore, A., Annala, A., Nguyen, K., Leahy, R. M. & Cherry, S. R. (2000) IEEE Trans. Med. Imag. 19, 507-512. [DOI] [PubMed] [Google Scholar]
- 25.Keyes, J. W., Jr. (1995) J. Nucl. Med. 36, 1836-1839. [PubMed] [Google Scholar]
- 26.Schomburg, A., Bender, H., Reichel, C., Sommer, T., Ruhlmann, J., Kozak, B. & Biersack, H. J. (1996) Eur. J. Nucl. Med. 23, 571-574. [DOI] [PubMed] [Google Scholar]
Associated Data
This section collects any data citations, data availability statements, or supplementary materials included in this article.


