

Abstract
The chick is widely used in studies of eye growth regulation and myopia. The aim of this study was to explore the utility of pattern (p)ERG as a tool to assess retinal function in such studies. Effects of optical defocus and diffusing blur, manipulations used to alter eye growth experimentally, were evaluated. PERGs were recorded from White-Leghorn chickens, using a checkerboard pattern, including 8 spatial frequencies (0.05 to 2.2 c/d SF), 13 contrast levels (1–100%), and 8 temporal reversal frequencies (0.5 to 20 Hz). The acute effects of defocus and diffusing blur were examined. Flash- and pERGs were also recorded from chicks that underwent monocular optic nerve section (ONS), to explore the contribution of retinal ganglion cells (RGCs). Measurements were made up to 6 weeks post-ONS, complemented with SD-OCT imagng. In normal chicks, the response to 1 Hz, 100% contrast stimuli showed positive- and negative-going waveforms at 43 ms (P1) and 75 ms (N95), respectively, with 0.06–0.1 c/d SF eliciting the largest P1 amplitudes of 21.9 ± 2.5 μV. Contrast levels above 5% yielded measurable P1 responses. Responses were transient and monophasic for 0.5 to 5 Hz reversal rates, with higher temporal frequencies yielding steady state responses. Defocus and diffusing blur decreased pERG amplitude across all SFs. pERG responses remained normal after ONS, despite the loss of RGCs. In conclusion, chicks show robust pERG responses, which are attenuated by defocus and diffusing blur. The pERG response is not affected by ONS, suggesting that RGCs do not contribute to the chick pERG.
Keywords: electroretinogram, pattern ERG, chicken, myopia, defocus, diffusing blur, optic nerve section
Graphical Abstract
1. Introduction
The chick is an important and widely used model for studies aimed at understanding human eye growth regulation and dysregulation, including myopia (Schaeffel, Glasser & Howland, 1988, Wallman & Winawer, 2004, Wildsoet & Schmid, 2000). Given that experimental investigations into eye growth regulation commonly use visual manipulations that alter retinal image quality, such as spatial form deprivation or optical defocus, and related evidence implicating local retinal circuits, an in vivo measure of retinal function, such as the electroretinogram (ERG), is a useful research tool for such studies.
The ERG is recorded at the cornea as a voltage change originating in the retina in response to visual stimulation. The components of the resulting waveform can provide information about the integrity of various retinal cell types. The simplest recording paradigm makes use of flash stimuli to record full field ERGs, with four main components generally identifiable, traceable to photoreceptors (a-wave)(Penn & Hagins, 1969), ON bipolar cells (b-wave)(Robson & Frishman, 1995), the inner retina (photopic negative response, PhNR)(Viswanathan, Frishman, Robson, Harwerth & Smith, 1999) and the retinal pigment epithelium (c-wave)(Gallemore & Steinberg, 1990). However the pattern (p)ERG, which makes use of more complex stimuli, either alternating checkerboards or grating stimuli, is potentially more informative for investigations involving visual manipulations, offering insight into their effects on retinal activity. The response in this case comprises only nonlinear signals, as the a- and b- waves cancel (Miura, Wang, Ivers & Frishman, 2009). In humans, the pERG response is composed of two key components, an early positive component (P50) and a later negative-going component (N95) (Berninger & Arden, 1988, Riggs, Johnson & Schick, 1964).
Comprehensive studies to determine the origins of the pERG component waveforms have been carried out in mice (Miura et al., 2009) and monkeys (Luo & Frishman, 2011). In mice, the p1 (analogous to P50 in primates), was found to originate from cells in the ON pathway while the n2 (N95 in primates) originates from cells in the OFF pathway. The pERG response is abolished with the loss of retinal ganglion cells after optic nerve crush in mice, as in other mammals and primates. For example, in cats (Mafei & Fiorentini, 1981) and monkeys (Maffei, Fiorentini, Bisti & Hollander, 1985), the pERG response is reduced to noise level following optic nerve section and subsequent retinal ganglion cell degeneration. In monkeys, non-spiking cells in the ON pathway appear to contribute to the P50 response, in addition to retinal ganglion cells (Luo & Frishman, 2011).
Despite the potential utility of the pERG for studies of eye growth regulation in chicks, a systematic study to determine the characteristics and origins of the pERG response in the chick is lacking. The pERG has been measured previously in a number of other avian species. In one study, investigators used pERGs as a tool to evaluate the contrast sensitivity function (CSF) of six species, including the starling, barn owl, wood-pecker, pigeon, quail and kestrel (Zhao, Wang, Chen, Xu & Jonas, 2013). In relation to studies into the origin of the pERG components in birds, the pigeon has been most extensively studied (Bagnoli, Porciatti, Francesconi & Barsellotti, 1984, Blondeau, Lamarche, Lafond & Brunette, 1987, Blondeau, Olivier, Brunette, Zaharia & Lafond, 1986, Porciatti, Francesconi & Bagnoli, 1985, Vaegan & Arden, 1987). Results showed that, in contrast to findings in primates and other mammals, the pigeon pERG response is not dependent on the functional integrity of retinal ganglion cells, as evident by pERG amplitudes in optic nerve section eyes comparable to control eyes up to nine months following surgery.
The aim of the study described here was to characterize the chick pERG in terms of spatial and temporal frequency, as well as contrast-dependence, with optic nerve section (ONS) used as a lesioning tool to eliminate retinal ganglion cells to investigate their contribution to the pERG response. Additional testing specifically evaluated the acute effects of optical defocus and diffusing blur, which are the two most common types of visual stimulus manipulations used in myopia research.
2. Materials and Methods
2.1 Animals
Forty-two White-Leghorn chickens were used in this study, with an age range spanning 2 days to 6 weeks. Chicks were housed in a 12-hour light/dark cycle, with food and water available ad libitum. Methods were approved by the UC Berkeley Animal Care and Use Committee and conformed to the ARVO statement for the Use of Animals in Ophthalmic and Vision Research.
For all ERG recordings, chicks were anesthetized with 60 mg/kg ketamine and 4 mg/kg xylazine and placed prone on a water-filled heat mat at 40° C. Eyelids were held open with a speculum. The depth of anesthesia was compatible with continued action of the nictitating membrane during the procedure, thereby preventing corneal dehydration. DTL electrodes were placed along the lower lid margin, in contact with the cornea. The reference and ground electrodes were platinum needles, placed subcutaneously in the dorsal neck and thigh skin, respectively, as described previously (Rymer, Choh, Bharadwaj, Padmanabhan, Modilevsky, Jovanovich, Yeh, Zhang, Guan, Payne & Wildsoet, 2007). Stimuli were generated and recorded using an Espion system (Diagnosys, Ltd, Lowell MA, USA). Protocols were adapted from the guidelines of the International Society for Clinical Electrophysiology of Vision (Bach, Brigell, Hawlina, Holder, Johnson, McCulloch, Meigen & Viswanathan, 2013, McCulloch, Marmor, Brigell, Hamilton, Holder, Tzekov & Bach, 2015).
2.2 Flash ERGs
Photopic flash ERGs were recorded binocularly in 8 normal White-Leghorn chicks (aged 2–3 weeks), using two colorburst ganzfeld stimulators (Diagnosys Ltd, Lowell MA, USA) placed directly in front of the undilated eyes. Full field ERG parameters used a flash luminance of 3.0 cd.s.m-2 and 1 s inter-stimulus interval, against a background illuminance of 25 cd.m-2. The responses to twenty flashes were averaged and subsequently analyzed. Sampling frequency was 1000 Hz, with a pre-trigger time of 10 ms and post-trigger time of 500 ms. Data were exported to excel and peaks for each response were manually marked and averaged. Amplitudes and implicit times of the a- and b-waves are reported. The a-wave amplitude was measured from the origin to the trough of the initial negative-going wave. The b-wave amplitude was measured from the trough of the a-wave to the following positive peak. Oscillatory potentials were isolated with a band pass filter of 50–300 Hz, as used previously (Frishman, Shen, Du, Robson, Harwerth, Smith, Carter-Dawson & Crawford, 1996, Miura et al., 2009). Scotopic recordings were not undertaken because rods are known to be nonfunctional in chickens during the day (Schaeffel, Rohrer, Lemmer & Zrenner, 1991).
2.3 pERG in normal animals
Monocular pERGs were recorded from 18 normal White-Leghorn chicks (aged 2–3 weeks), using an alternating checkerboard pattern stimulus displayed on a 36 × 27 cm cathode ray tube (CRT) monitor, which subtended an angle of ~75° at the eye (Espion, Diagnosys Ltd, Lowell MA, USA). The mean luminance of the display was 30.1 cd/m2 for a uniform field (IL1700, International Light Technologies, MA, USA). The chicks were positioned to visually align the line of site from the area centralis of the eye being recorded with the center of the stimulus display. Eyes were not cyclopleged and pupils were not dilated.
The various stimulus conditions tested are summarized in Table 1. The spatial frequency (SF) threshold was determined using an alternating 4 Hz checkerboard pattern at 100% contrast. Recordings were obtained for eight SFs, starting with the lowest frequency, 0.05 c/d (largest pattern), and increasing to 2.2 c/d, with 100 reversals per SF. Contrast sensitivity was tested using a reversal rate of 4 Hz, for only one, mid-range SF, a 0.1 c/d pattern; recordings were obtained for 13 contrast levels, ranging from 1 and 100%, for a total of 100 reversals per contrast level. To assess temporal sensitivity, recordings were obtained for 8 temporal frequencies ranging from 0.5 to 20 Hz, using the same 0.1 c/d pattern at 100% contrast, with 100 reversals per temporal frequency. PERG responses were analyzed after first filtering them with a low band pass filter (0–55 Hz) to remove background noise occurring at 60 Hz. Peaks were automatically marked by the instrument software and selections subsequently evaluated and manually adjusted as necessary for each response. The P1 amplitude was calculated as the distance from the baseline to the positive peak, which occurred with a delay of between 35–50 ms.
Table 1.
pERG stimulus parameters used for each condition tested.
| Condition | Test | Lens | Contrast (%) | Temporal Frequency (Hz) | Spatial Frequency (c/d) |
|---|---|---|---|---|---|
| Normal | Spatial frequency threshold | None | 100 | 4 | 0.05, 0.63, 0.10, 0.18, 0.54, 0.63, 1.1, 2.2 |
| Normal | Contrast sensitivity | None | 1, 2.5, 5, 10, 20, 30, 40, 50, 60, 70, 80, 90, 100 | 4 | 0.1 |
| Normal | Temporal frequency threshold | None | 100 | 0.5, 1, 2, 3, 4, 5, 10, 20 | 0.1 |
| Normal | Effects of defocus | −10, −5, +5, +10 D | 100 | 4 | 0.05, 0.63, 0.10, 0.18, 0.54, 0.63, 1.1, 2.2 |
| Normal | Effects of diffusing blur | 0.6, 0.2, <0.1, LP Bangerter filters | 100 | 4 | 0.05, 0.63, 0.10, 0.18, 0.54, 0.63, 1.1, 2.2 |
| ONS | Effects of ganglion cell loss | None | 100 | 4 | 0.05, 0.63, 0.10, 0.18, 0.54, 0.63, 1.1, 2.2 |
2.4 Retinal image quality degradation & effects on ERGs
The effect of optical defocus on the pERG response was investigated with a series of defocusing lenses (−10, −5, +5 & +10 D lenses), covering the range commonly encountered in eye growth studies involving chicks (Sivak, Barrie, Callender, Doughty, Seltner & West, 1990). The effect of diffusing blur was investigated using a series of Bangerter filters (0.6, 0.2, <0.1 & light perception (LP)), which attenuate stimulus contrast and act as low pass spatial frequency filters (Tran, Chiu, Tian & Wildsoet, 2008). Lenses and filters were placed in front of the eye at a vertex distance of 10 mm. For each lens or filter, the pERG was recorded as described above, for eight SF patterns, all set to 100% contrast and a temporal frequency of 1 Hz.
2.5 Retinal cell lesioning & effects on ERGs
Chicks (aged 1–2 days) underwent monocular optic nerve section (ONS; n=6) or sham surgery (n=6) on their right eyes under gaseous isoflurane anesthesia (1.5% in oxygen; previously described in detail (Wildsoet & Pettigrew, 1988)). With the aid of a surgical microscope, a temporal incision was made to enter the orbit and visualize the optic nerve, which was first crushed and then sectioned (experimental treatment), or unaltered (sham treatment). The lesion was then surgically closed and tobradex ointment applied over the area prophylactically. Contralateral eyes served as controls. Note that the vascular supply to the pecten, on which the retina is dependent for its oxygen and nutrient supply, lies external to the optic nerve and is not compromised by the surgery.
Binocular flash and pERG recordings were obtained from both eyes undergoing lesioning or sham surgeries and fellow untreated eyes. Testing was performed weekly up to 6 weeks following ONS surgery. Pattern ERG recordings made use of 13 contrast levels ranging from 1% to 100%, using a 0.1 c/d pattern, a reversal rate of 4 Hz and 100 reversals per contrast level.
2.6 Lesioning effects on opticokinetic nystagmus (OKN)
To confirm the success of our lesioning procedure, ONS chicks underwent monocular OKN testing one week after the surgery. Awake animals were lightly restrained and placed on a stage in the center of a custom-built rotating drum lined with a printed 0.2 c/d white and black (~100% contrast), vertical square wave grating. The drum could be rotated around the stage in both clockwise and counterclockwise directions. For testing, each eye was occluded in turn, with the other eye having free view of the stimulus. As the drum rotated, the presence or absence of tracking head movements was noted.
2.7 Effects of lesioning on retinal ultrastructure assessed by in vivo imaging
ONS chicks underwent high resolution, retinal imaging (SD-OCT, Bioptigen, NC, USA) of both eyes 2 and 4 weeks after surgery. For imaging, chicks were first anesthetized with intramuscular ketamine (30 mg/kg) and xylazine (3 mg/kg), then placed on a custom-made stand with x-y-z adjustments with the eye aligned with the optics of the instrument. Alignment was considered optimal when both the pecten and the presumed area centralis, identified as a local area of retinal thickening temporal to the pecten, were visible. The position of the reference arm was adjusted so that the B-scan was flat as opposed to either convex or concave. A fundus image was then captured and the retina scanned using a custom rectangular volume protocol. Scan parameters included a 14 mm × 14 mm rectangle with 1000 A-scans per B-scan, 100 B-scans, and 3 B-scans per frame. Images were registered and averaged off-line. Axial measurements were made at a single location at the center of the area centralis using the instrument’s built-in software. For fellow (unlesioned) eyes, axially-oriented calipers were placed at the thickest point of the area centralis and three parameters were measured - total retinal thickness (nerve fiber layer (NFL) to retinal pigment epithelium (RPE)), inner retinal thickness (NFL to outer plexiform layer (OPL)), and outer retina (OPL to RPE). For ONS eyes, the retinal location selected for measurement was at a similar distance from the pecten as the area centralis in the contralateral control eye.
2.8 Effects of lesioning on retinal histology
One chick was used for histology to confirm results from in vivo OCT imaging. The chick underwent unilateral ONS at 1 day of age; the contralateral eye did not undergo any surgical manipulation. After 10 days, the chick was sacrificed and the eyes enucleated and fixed with 4% (w/v) paraformaldehyde in PBS. Cryosections of the retinas were stained with 1% (v/v) toluidine blue in water prior to imaging with a light microscope (Zeiss Axioplan, Germany).
2.9 Statistical analyses
Results are summarized as means and standard deviation (SD). For flash and pattern ERG data, differences between ONS eyes and their fellows were compared using the Wilcoxon test followed by Bonferroni correction of p values. For OCT data collected from ONS chicks, changes in interocular differences over time were examined using a repeated measures ANOVA, followed by post hoc testing with Bonferroni correction of p values. Analyses were performed in R Studio.
3. Results
3.1 Flash & pERG in normal chicks
For normal chicks, the photopic flash ERG implicit times and amplitudes for the a- and b-waves were 12.38 ± 0.74 ms and −74.86 ± 13.2 μV, and 29.0 ± 2.6 ms and 249.20 ± 59.0 μV respectively. For pattern stimulation, the responses to SFs between 0.05 to 2.2 c/d, set to 100% contrast and 1 Hz reversal rate, showed characteristic positive (P1) and negative-going (N95) waveforms, occurring 43 ± 5 ms and 75 ± 16 ms after stimulus onset respectively, and varying in amplitude with spatial frequency (Table 2). A representative recording is shown in Figure 1. N95 waveforms were of small amplitude (0 to −5 μV) and variable, and thus, for this study, only data relating to the P1 component were analyzed further.
Table 2.
P1 implicit time (ms) and amplitude (μV) for increasing SFs with defocus using trial lenses (D) and diffusing blur with Bangerter filters (BF)
| SF (c/d) | No lens | −5 D | −10 D | +5 D | +10 D | 0.6 BF | 0.2 BF | <0.1 BF | <0.1 BF | |
|---|---|---|---|---|---|---|---|---|---|---|
| 0.05 | implicit time | 39.0 ± 3.1 | 42.6 ± 4.3 | 41.6 ± 5.6 | 41.4 ± 6.1 | 40.8 ± 2.9 | 39.5 ± 5.9 | 38.2 ± 3.7 | 45.0 ± 7.3 | 44.3 ± 8.2 |
| amplitude | 14.3 ± 4.5 | 12.5 ± 4.1 | 8.6 ± 1.8 | 11.8 ± 3.3 | 14.2 ±1.8 | 11.0 ± 2.8 | 9.4 ± 2.3 | 5.3 ± 2.7 | 2.9 ± 1.6 | |
| 0.06 | implicit time | 37.7 ± 2.6 | 41.4 ± 5.1 | 42.4 ±5.7 | 39.8 ± 3.7 | 42.6 ± 5.1 | 39.2 ± 4.6 | 39.5 ± 1.6 | 48.0 ± 9.8 | 38.5 ± 0.7 |
| amplitude | 22.0 ± 2.6 | 18.9 ± 3.9 | 14.5 ± 1.7 | 17.4 ± 5.8 | 20.1 ±4.1 | 17.6 ± 2.1 | 13.9 ± 2.3 | 7.8 ± 1.2 | 1.2 ± 1.7 | |
| 0.1 | implicit time | 37.7 ± 2.4 | 43.0 ± 8.1 | 42.6 ± 7.7 | 38.8 ± 1.8 | 45.4 ± 3.6 | 41.5 ± 5.5 | 40.8 ± 7.0 | 41.4 ± 7.6 | 42.0 ± 7.1 |
| amplitude | 21.2 ± 3.6 | 16.1 ± 4.5 | 13.2 ±5.2 | 15.5 ± 4.4 | 15.7 ± 6.4 | 17.0 ± 2.4 | 12.2 ± 2.5 | 5.3 ± 1.5 | 2.1 ± 3.1 | |
| 0.18 | implicit time | 39.0 ± 3.7 | 40.0 ± 4.0 | 49.0 ± 8.2 | 40.4 ± 3.2 | 43.3 ± 2.6 | 42.2 ± 4.5 | 40.2 ± 3.8 | 51.0 ± 7.1 | 37.0 |
| amplitude | 19.3 ± 4.8 | 12.8 ± 6.2 | 7.4 ±7.2 | 11.3 ± 3.7 | 12.6 ±7.2 | 13.3 ± 2.7 | 8.58 ± 4.8 | 1.9 ± 2.6 | 0.6 ± 1.4 | |
| 0.54 | implicit time | 39.1 ± 4.6 | 42.8 ± 9.6 | 53.0 ± 4.0 | 48.0 ± 5.7 | 57.0 ± 3.6 | 46.3 ± 7.2 | 45.7 ± 6.5 | 36.0 | na |
| amplitude | 14.3 ± 5.4 | 9.5 ± 6.0 | 3.6 ± 3.6 | 6.25 ± 3.4 | 4.6 ±4.4 | 6.2 ± 2.8 | 1.7 ± 2.8 | 0.5 ± 1.2 | na | |
| 0.63 | implicit time | 39.5 ± 3.7 | 44.3 ± 10.4 | 50.0 ±1.4 | 44.0 ± 4.4 | 50.5 ± 10.6 | 51.3 ± 9.0 | 46.0 ± 18.4 | 30.0 | na |
| amplitude | 15.0 ± 5.5 | 5.9 ± 6.9 | 2.8 ± 4.5 | 4.2 ± 3.9 | 3.9 ± 5.4 | 5.5 ± 4.7 | 1.4 ± 2.4 | 0.8 ± 1.7 | na | |
| 1.1 | implicit time | 43.6 ± 4.9 | 47.3 ± 5.1 | 54 | 48.0 ± 4.4 | 52 | 48.0 ± 1.4 | 40.0 ± 5.7 | na | na |
| amplitude | 8.4 ± 4.2 | 2.3 ± 3.5 | 2.12 ± 4.7 | 2.5 ± 2.5 | 0.7 ±1.7 | 1.8 ± 2.8 | 1.0 ± 1.9 | na | na | |
| 2.2 | implicit time | 44.4 ± 6.5 | 51 ±11.3 | na | 38.5 ± 4.9 | 52 | 40.5 ± 6.4 | 49.0 ± 15.6 | na | na |
| amplitude | 6.9 ± 5.2 | 2.3 ± 3.7 | na | 1.2 ± 1.6 | 0.8 ± 1.9 | 2.2 ± 3.5 | 1.0 ± 1.7 | na | na |
Figure 1. Representative pERG example for increasing spatial frequencies.

pERG responses recorded from one representative normal chick, for increasing spatial frequencies from 0.05 to 2.2 c/d. Contrast 100% and temporal frequency 1 Hz. * Peaks in each trace represent the P1 component, the N95 component is not evident in this example.
When SF was manipulated and contrast held constant at 100%, the maximum amplitude of the P1 component of 22.0 ± 2.6 μV was recorded with a SF of 0.06 c/d, and the minimum amplitude of 6.9 ± 5.2 μV, with a 2.2 c/d SF, the latter SF eliciting a measurable response in half of the chicks tested. Contrast levels of 5–10% and higher yielded measurable P1 responses for the same spatial frequency range (0.05 to 2.2 c/d), with amplitudes increasing with contrast and plateauing at 50% contrast (Figure 2A). Responses were transient and monophasic for temporal frequencies from 0.5 to 5 Hz, with higher frequencies yielding steady state responses in all chicks tested with a 10 Hz stimulus, and the 20 Hz stimulus yielding a measurable response in only half of the chicks tested (Figure 2B).
Figure 2. P1 amplitude with contrast and temporal frequency.
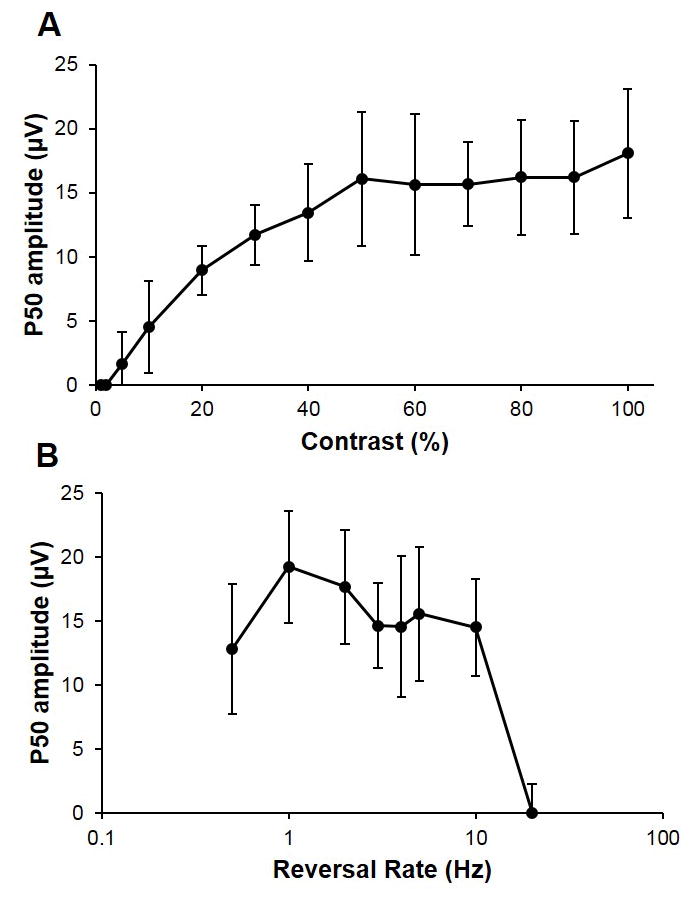
Mean P1 amplitudes from pERG recordings from normal chicks (n=6), plotted against A) contrast from 1% to 100% (SF 0.1 c/d and temporal frequency 1 Hz), and B) temporal frequency reversal rates from 0.5 to 20 Hz (SF 0.1 c/d and contrast 100%). Error bars are SDs.
3.2 Effects of visual manipulation on pERG
Both optical defocus and diffusing blur attenuated the P1 responses across all SFs (Figures 3A & B). Implicit times and amplitudes of the P1 waveform are presented in table 2. For the defocusing lenses tested, the +10 D lens had the smallest effect on the P1 amplitude, limited to low SFs, while the −10 D lens had the largest effect, completely eliminating the P1 component for the highest SFs tested. Likewise, for the highest SFs, 1.1–2.2 c/d, the P1 components were almost completely eliminated for all levels of diffusing blur (0.6 to LP Bangerter filters). For lower SFs, there was a graded decrease in P1 amplitude across SFs, varying with the level of diffusing blur. With the most dense (LP) filter, the P1 component was eliminated for all but the lowest SF tested (0.05 c/d).
Figure 3. P1 amplitude with defocus and diffusing blur.

Mean P1 amplitudes from pERG recordings from normal chicks (n=6), plotted against spatial frequency and tested with A) various defocus lenses and B) Bangerter filters. Contrast 100% and temporal frequency 1 Hz. Error bars are SDs and are not shown for lens conditions for clarity.
3.3 Effects on retinal lesions on flash and pERG
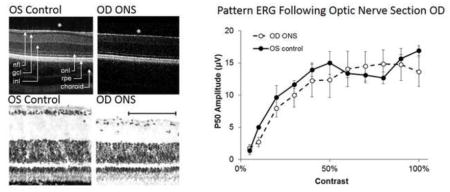
Following ONS, flash ERG responses were unaffected through 6 weeks post-surgery. Representative flash ERG responses from ONS and fellow control eyes, 1 and 6 weeks following treatment, are shown in Figure 4. The a- and b-wave amplitudes and a- and b-wave implicit times were unaffected by ONS, using the Wilcoxon test followed with Bonferroni correction (p > 0.05), despite some eyes showing decreases in b-wave amplitude. Similarly, OPs showed slight decreases in amplitude in some of the eyes, although differences were not statistically significant. In relation to pERG responses, the P1 amplitude was not significantly affected by the ONS surgery, even 6 weeks post-surgery (p > 0.05, weeks 1–6). Figure 6 shows P1 amplitudes for ONS and fellow control eyes from pERG recordings at week 6. Normal flash and pERG responses were elicited from eyes subjected to sham surgery (data not shown).
Figure 4. Representative full field ERG with ONS.

Representative photopic flash ERG responses from both ONS and contralateral control eyes of one chick, 1 week and 6 weeks following ONS. The stimulus had a luminance of 3.0 cd.s.m-2. Complete traces are shown on top and oscillatory potentials (OPs) are shown on the bottom. Responses from contralateral control eye are in black, from ONS eye in red.
Figure 6. P1 amplitude with ONS.
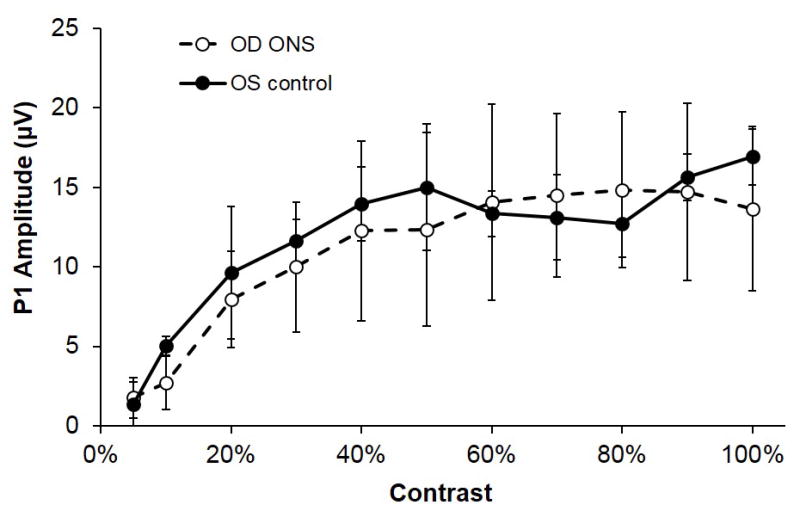
Mean P1 amplitudes for pERGs recorded 6 weeks post ONS, plotted against spatial contrast levels from 5 to 100%. SF 0.1 c/d and temporal frequency 4 Hz. Closed symbols represent contralateral control eyes and open symbols, ONS eyes. Error bars are SDs.
3.4 Effects of lesioning on OKN
For chicks that had undergone ONS surgery, no tracking responses could be elicited from their lesioned eyes, confirming the success of the surgery, i.e., the loss on communication between the retina of lesioned eyes and higher centers. In contrast, tracking responses were successfully elicited from the contralateral control eyes of the same chicks. Normal tracking responses were also elicited from eyes that underwent sham surgery.
3.5 Effects of lesioning on retinal ultrastructure assessed by SD-OCT & histology
Representative SD-OCT images from normal (contralateral control) and ONS eyes are shown in Figure 7A & B. At two weeks post-surgery, the inner retinal layer of ONS eyes showed significant thinning at the area centralis compared to that of control eyes, i.e., 169 ± 17.3 μm versus 192 ± 7.7 μm, respectively (F = 32.2, p<0.005; Table 3). This change reflects a loss of retinal ganglion cells and secondary thinning of nerve fiber layer in ONS eyes, and is also reflected in a reduction in total retinal thickness at the area centralis, i.e., 268 ± 17.8 μm compared to 295 ± 11.1 μm for ONS and control eyes, respectively (F = 37.8, p<0.005). The loss of retinal ganglion cells and thinning of the nerve fiber layer was also confirmed histologically, as evident in sections collected 10 days after ONS surgery (Figures 7C & D). There was no significant difference in the thickness of the outer retinal layers (the OPL to RPE) between ONS and control eyes up to 6 weeks (F = 0.33, p = 0.60).
Figure 7. OCT and histology following ONS.
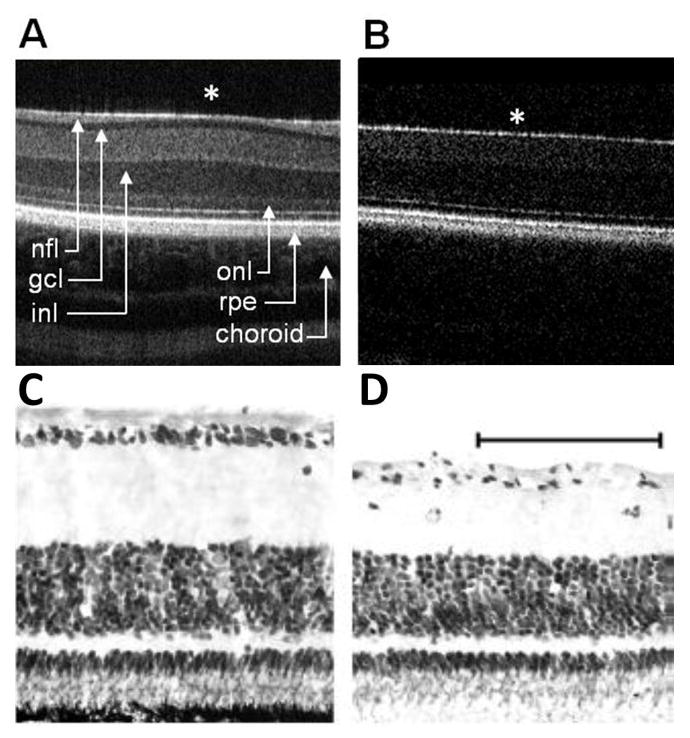
In vivo SD-OCT images of central retina captured from A) a normal (control) eye and B) its contralateral ONS eye. Layers labeled in (A) include nerve fiber layer (nfl), ganglion cell layer (gcl), inner nuclear layer (inl), outer nuclear layer (onl), retinal pigment epithelium (rpe) and choroid. * indicates area centralis. Stained histological sections from central retina of C) a normal eye and D) its contralateral ONS eye, 10 days after ONS surgery, scale bar = 50 μm
Table 3.
Total, inner and outer retinal thicknesses for optic nerve section (ONS) and contralateral control eyes (mean ± SE), measured from SD-OCT images captured 2 and 4 weeks post-surgery (n = 4–5). Difference is control-ONS in μm. P-values indicate differences between treated and contralateral control eyes over time using an ANOVA.
| Week 2 | Week 4 | |||
|---|---|---|---|---|
| Total retinal thickness (μm) | ONS | 268 ± 17.8 | 256 ± 12.0 | p < 0.005 |
| control | 295 ± 11.1 | 289 ± 8.1 | ||
| difference | −27 | −33 | ||
| Inner retinal thickness (μm) | ONS | 169 ± 17.3 | 154 ± 14.9 | p < 0.005 |
| control | 192 ± 7.7 | 187 ± 7.2 | ||
| difference | −25 | −33 | ||
| Outer retinal thickness (μm) | ONS | 99 ± 13.5 | 102 ± 9.2 | p = 0.60 |
| control | 97 ± 3.9 | 103 ± 8.9 | ||
| difference | +2 | −1 |
4. Discussion
The main goal of this study was to characterize the pERG response of the chick, a classic animal model of human myopia. In terms of spatial frequency (SF), the derived response curve, based on the P1 component, was consistent with a band pass filter, with an approximately 2.2 c/d cutoff. For spatial contrast, responses increased linearly up to about 50% contrast from a threshold of around 5%, and then plateaued. Maximum responses were obtained with an intermediate SF of 0.6 – 0.1 c/d, spatial contrast of 50% or greater, and a 1–5 Hz pattern reversal rate. Irrespective of its sign, defocus decreased the responses, as did the Bangerter filters, with the responses to higher spatial frequencies being most attenuated with the latter. We also demonstrated that the pERG response is not dependent on functional retinal ganglion cells in chicks.
Apart from pERGs, another approach used to assess the spatial resolution of chicks involves an optokinetic nystagmus (OKN) paradigm. In an OKN study of similarly aged young chicks, Schmid and Wildsoet (1998) reported a slightly higher visual acuity than that reported here, of between 7.7–8.6 c/d, with a contrast sensitivity threshold of 4–11%, peaking at a SF of 1.2 c/d (Schmid & Wildsoet, 1998), compared to 0.0.6 – 0.1 c/d in the current study. These differences may reflect differences in the underlying neural pathways subserving the pERG and the OKN responses, as well as differences in the testing conditions. The pERG response represents the output of the retina, limited by uncorrected optical aberrations and noise in the recording technique. On the other hand, the OKN response also involves midbrain processing. Hodos et al. (2002) found that the contrast sensitivity function derived from pERG recordings in pigeons had a similar bandwidth and peak spatial frequency to that derived from psychophysical testing, but was lower by approximately 54%. The high-frequency cut-off derived from pERG recordings was also lower than that obtained by psychophysical testing, by 37% (Hodos, Ghim, Potocki, Fields & Storm, 2002). In another study involving chickens, the pERG was used to measure and subsequently correct for refractive errors; peak pERG amplitudes were obtained with +6 to +10 D trial lenses interposed, corresponding to refractive errors of +3 to +7 D after accounting for the working distance (Kruse, Schwahn, Gekeler, Weiss & Schaeffel, 1999). However, even with refractive error corrections in place, this study reported a slightly lower SF cutoff of 1.75 c/d, compared to approximately 2.2 c/d in the current study, in which neither refractive errors nor the working distance of 25 cm (+4 D) was corrected. Differences in stimulus hardware between our studies may be a contributing factor for this difference and it is also noteworthy that our birds exhibit lower hyperopia (approximately +1 D, unpublished result). In the current study, birds were anesthetized, thereby minimizing accommodative fluctuations, but eyes not cyclopleged, allowing for partial compensation for the working distance through residual accommodative tonus. Nonetheless, the pERG contrast thresholds reported here are likely also slightly higher and SF cut-off lower than one might predict for optimally focused conditions and/or with a pinhole in place to control optical aberrations.
Previous studies have reported overall retinal thinning linked to thinning of the inner retina following ONS in mice, as evaluated in vivo using SD-OCT imaging (Chauhan, Stevens, Levesque, Nuschke, Sharpe, O’Leary, Archibald & Wang, 2012, Gabriele, Ishikawa, Schuman, Ling, Bilonick, Kim, Kagemann & Wollstein, 2011). In the current study, histology on one bird was used to confirm the early loss of retinal ganglion cells (RGCs) after the ONS surgery, i.e., within 5 days of the surgery, as also noted in our previous studies involving ONS (Choh, Banh & Wildsoet, 2004, Chong, Wildsoet & Choh, 2013). This loss of RGCs and their axons from the nerve fiber layer is consistent with the thinning of the ganglion cell and nerve fiber layers seen by OCT imaging.
The pERG response was unaffected, even 6 weeks after the ONS surgery, implying that the retinal ganglion cells are not the origin of the pERG in chicks. Similar to our findings, studies in pigeons reported near normal pERG amplitudes following ONS and complete loss of retinal ganglion cells (Blondeau et al., 1987, Porciatti et al., 1985). In contrast, the pERG response is reported to be eliminated in mammals, including mice (Miura et al., 2009), rats (Berardi, Domenici, Gravina & Maffei, 1990), and cats (Maffei & Fiorentini, 1982) following either optic nerve section resulting in death of retinal ganglion cells. In humans, surgical trans-section of the optic nerve decreased, but did not eliminate, the pERG response 30 months after surgery (Harrison, O’Connor, Young, Kincaid & Bentley, 1987), indicating a role for the retinal ganglion cells in the human pERG.
The chick is widely used as an animal model in studies of eye growth regulation and myopia (Schaeffel et al., 1988). Specifically, myopia can be induced by imposed defocus or form deprivation (Pickett-Seltner, Sivak & Pasternak, 1988, Schaeffel et al., 1988, Troilo, Gottlieb & Wallman, 1987). Here, the pERG technique was further exploited to examine the effects of imposed optical blur and image degradation with Bangerter filters. We showed that pERG responses, as measured in terms of the P1 component, are slightly reduced, but not eliminated, for most SFs with defocusing lenses ranging in power from −10 to +10 D. This effect of defocus on the pERG response is in contrast to the effects of the Bangerter filters, which imposed diffusing blur and dramatically reduced the pERG response, and in the case of the densest filter, eliminated the response, consistent with established spatial filtering profiles (Tran et al., 2008). These results are also in accordance with findings that dense Bangerter filters, i.e. <0.1 and LP, induce form-deprivation myopia in chicks (Tran et al., 2008).
In conclusion, young chicks exhibit robust pERG responses, which appear to be independent of retinal ganglion cell integrity, but which are sensitive to both imposed optical defocus and diffusing blur. With increasing interest in the role of local retinal regulation in ocular growth regulation and myopia, pERGs represents a tool to evaluate and compare the effects of various experimental stimulus manipulations on retinal activity.
Figure 5. Full field ERG with ONS.
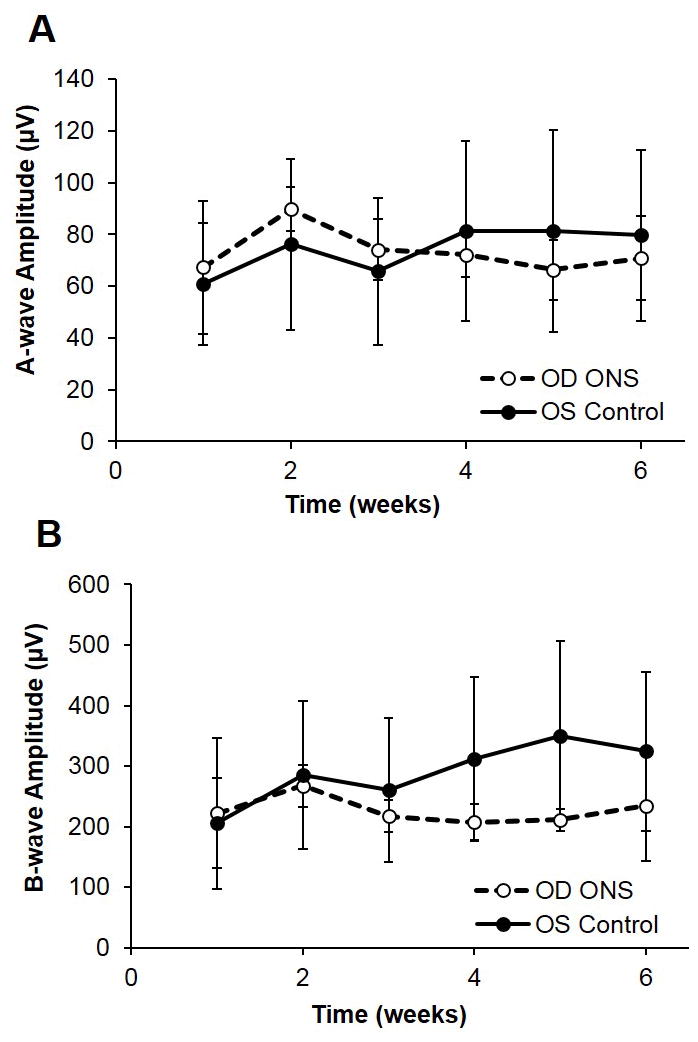
Mean amplitudes of A) a-wave and B) b-wave components of photopic flash ERGs recorded weekly from 1 to 6 weeks post ONS. Stimulus had a luminance of 3.0 cd.s.m-2. Closed symbols are results for contralateral control eyes and open symbols, for ONS eyes. Error bars are SDs.
Highlights.
Chicks show robust pERG responses
Imposed defocus and diffusing blur attenuate pERG responses
The pERG response is unaffected following selective lesioning of retinal ganglion cells via optic nerve section
Acknowledgments
This work was supported by the NIH, 5R01EY012392 to CFW and NEI K08 EY022696 to LO. Special thanks to Edwin Ostrin for statistical support.
Footnotes
Publisher's Disclaimer: This is a PDF file of an unedited manuscript that has been accepted for publication. As a service to our customers we are providing this early version of the manuscript. The manuscript will undergo copyediting, typesetting, and review of the resulting proof before it is published in its final citable form. Please note that during the production process errors may be discovered which could affect the content, and all legal disclaimers that apply to the journal pertain.
References
- Bach M, Brigell MG, Hawlina M, Holder GE, Johnson MA, McCulloch DL, Meigen T, Viswanathan S. ISCEV standard for clinical pattern electroretinography (PERG): 2012 update. Doc Ophthalmol. 2013;126(1):1–7. doi: 10.1007/s10633-012-9353-y. [DOI] [PubMed] [Google Scholar]
- Bagnoli P, Porciatti V, Francesconi W, Barsellotti R. Pigeon pattern electroretinogram: a response unaffected by chronic section of the optic nerve. Exp Brain Res. 1984;55(2):253–262. doi: 10.1007/BF00237276. [DOI] [PubMed] [Google Scholar]
- Berardi N, Domenici L, Gravina A, Maffei L. Pattern ERG in rats following section of the optic nerve. Exp Brain Res. 1990;79(3):539–546. doi: 10.1007/BF00229323. [DOI] [PubMed] [Google Scholar]
- Berninger TA, Arden GB. The pattern electroretinogram. Eye (Lond) 1988;2(Suppl):S257–283. doi: 10.1038/eye.1988.149. [DOI] [PubMed] [Google Scholar]
- Blondeau P, Lamarche J, Lafond G, Brunette JR. Pattern electroretinogram and optic nerve section in pigeons. Curr Eye Res. 1987;6(6):747–756. doi: 10.3109/02713688709034841. [DOI] [PubMed] [Google Scholar]
- Blondeau P, Olivier P, Brunette JR, Zaharia M, Lafond G. Pattern and flash electroretinogram following increased intraocular pressure in pigeons. Ophthalmic Res. 1986;18(4):224–229. doi: 10.1159/000265438. [DOI] [PubMed] [Google Scholar]
- Chauhan BC, Stevens KT, Levesque JM, Nuschke AC, Sharpe GP, O’Leary N, Archibald ML, Wang X. Longitudinal in vivo imaging of retinal ganglion cells and retinal thickness changes following optic nerve injury in mice. PLoS One. 2012;7(6):e40352. doi: 10.1371/journal.pone.0040352. [DOI] [PMC free article] [PubMed] [Google Scholar]
- Choh V, Banh J, Wildsoet CF. Thickness and Histological Changes in Optic Nerve–Sectioned Chick Retina. Invest Ophthalmol Vis Sci. 2004;45 (E-Abstract 47) [Google Scholar]
- Chong S, Wildsoet CF, Choh V. Life and Death of Retinal Cells in Optic Nerve Sectioned Chick Eyes. Invest Ophthalmol Vis Sci. 2013;54 (E-Abstract 6096) [Google Scholar]
- Frishman LJ, Shen FF, Du L, Robson JG, Harwerth RS, Smith EL, 3rd, Carter-Dawson L, Crawford ML. The scotopic electroretinogram of macaque after retinal ganglion cell loss from experimental glaucoma. Invest Ophthalmol Vis Sci. 1996;37(1):125–141. [PubMed] [Google Scholar]
- Gabriele ML, Ishikawa H, Schuman JS, Ling Y, Bilonick RA, Kim JS, Kagemann L, Wollstein G. Optic nerve crush mice followed longitudinally with spectral domain optical coherence tomography. Invest Ophthalmol Vis Sci. 2011;52(5):2250–2254. doi: 10.1167/iovs.10-6311. [DOI] [PMC free article] [PubMed] [Google Scholar]
- Gallemore RP, Steinberg RH. Effects of dopamine on the chick retinal pigment epithelium. Membrane potentials and light-evoked responses. Invest Ophthalmol Vis Sci. 1990;31(1):67–80. [PubMed] [Google Scholar]
- Harrison JM, O’Connor PS, Young RS, Kincaid M, Bentley R. The pattern ERG in man following surgical resection of the optic nerve. Invest Ophthalmol Vis Sci. 1987;28(3):492–499. [PubMed] [Google Scholar]
- Hodos W, Ghim MM, Potocki A, Fields JN, Storm T. Contrast sensitivity in pigeons: a comparison of behavioral and pattern ERG methods. Doc Ophthalmol. 2002;104(1):107–118. doi: 10.1023/a:1014427615636. [DOI] [PubMed] [Google Scholar]
- Kruse R, Schwahn H, Gekeler F, Weiss S, Schaeffel F. Measurement of refractive state and visual acuity of chickens by pattern electroretinograms (perg) Invest Ophthalmol Vis Sci. 1999;40 (E-abstract 4459) [Google Scholar]
- Luo X, Frishman LJ. Retinal pathway origins of the pattern electroretinogram (PERG) Invest Ophthalmol Vis Sci. 2011;52(12):8571–8584. doi: 10.1167/iovs.11-8376. [DOI] [PMC free article] [PubMed] [Google Scholar]
- Mafei L, Fiorentini A. Electroretinographic responses to alternating gratings before and after section of the optic nerve. Science. 1981;211(4485):953–955. doi: 10.1126/science.7466369. [DOI] [PubMed] [Google Scholar]
- Maffei L, Fiorentini A. Electroretinographic responses to alternating gratings in the cat. Exp Brain Res. 1982;48(3):327–334. doi: 10.1007/BF00238608. [DOI] [PubMed] [Google Scholar]
- Maffei L, Fiorentini A, Bisti S, Hollander H. Pattern ERG in the monkey after section of the optic nerve. Exp Brain Res. 1985;59(2):423–425. doi: 10.1007/BF00230925. [DOI] [PubMed] [Google Scholar]
- McCulloch DL, Marmor MF, Brigell MG, Hamilton R, Holder GE, Tzekov R, Bach M. ISCEV Standard for full-field clinical electroretinography (2015 update) Doc Ophthalmol. 2015;130(1):1–12. doi: 10.1007/s10633-014-9473-7. [DOI] [PubMed] [Google Scholar]
- Miura G, Wang MH, Ivers KM, Frishman LJ. Retinal pathway origins of the pattern ERG of the mouse. Exp Eye Res. 2009;89(1):49–62. doi: 10.1016/j.exer.2009.02.009. [DOI] [PMC free article] [PubMed] [Google Scholar]
- Penn RD, Hagins WA. Signal transmission along retinal rods and the origin of the electroretinographic a-wave. Nature. 1969;223(5202):201–204. doi: 10.1038/223201a0. [DOI] [PubMed] [Google Scholar]
- Pickett-Seltner RL, Sivak JG, Pasternak JJ. Experimentally induced myopia in chicks: morphometric and biochemical analysis during the first 14 days after hatching. Vision Res. 1988;28(2):323–328. doi: 10.1016/0042-6989(88)90160-5. [DOI] [PubMed] [Google Scholar]
- Porciatti V, Francesconi W, Bagnoli P. The pigeon pattern electroretinogram is not affected by massive loss of cell bodies in the ganglion layer induced by chronic section of the optic nerve. Doc Ophthalmol. 1985;61(1):41–47. doi: 10.1007/BF00143214. [DOI] [PubMed] [Google Scholar]
- Riggs LA, Johnson EP, Schick AM. Electrical Responses of the Human Eye to Moving Stimulus Patterns. Science. 1964;144(3618):567. doi: 10.1126/science.144.3618.567. [DOI] [PubMed] [Google Scholar]
- Robson JG, Frishman LJ. Response linearity and kinetics of the cat retina: the bipolar cell component of the dark-adapted electroretinogram. Vis Neurosci. 1995;12(5):837–850. doi: 10.1017/s0952523800009408. [DOI] [PubMed] [Google Scholar]
- Rymer J, Choh V, Bharadwaj S, Padmanabhan V, Modilevsky L, Jovanovich E, Yeh B, Zhang Z, Guan H, Payne W, Wildsoet CF. The albino chick as a model for studying ocular developmental anomalies, including refractive errors, associated with albinism. Exp Eye Res. 2007;85(4):431–442. doi: 10.1016/j.exer.2007.06.010. [DOI] [PMC free article] [PubMed] [Google Scholar]
- Schaeffel F, Glasser A, Howland HC. Accommodation, refractive error and eye growth in chickens. Vision Res. 1988;28(5):639–657. doi: 10.1016/0042-6989(88)90113-7. [DOI] [PubMed] [Google Scholar]
- Schaeffel F, Rohrer B, Lemmer T, Zrenner E. Diurnal control of rod function in the chicken. Vis Neurosci. 1991;6(6):641–653. doi: 10.1017/s0952523800002637. [DOI] [PubMed] [Google Scholar]
- Schmid KL, Wildsoet CF. Assessment of visual acuity and contrast sensitivity in the chick using an optokinetic nystagmus paradigm. Vision Res. 1998;38(17):2629–2634. doi: 10.1016/s0042-6989(97)00446-x. [DOI] [PubMed] [Google Scholar]
- Sivak JG, Barrie DL, Callender MG, Doughty MJ, Seltner RL, West JA. Optical causes of experimental myopia. Ciba Found Symp. 1990;155:160–172. doi: 10.1002/9780470514023.ch10. discussion 172–167. [DOI] [PubMed] [Google Scholar]
- Tran N, Chiu S, Tian Y, Wildsoet CF. The significance of retinal image contrast and spatial frequency composition for eye growth modulation in young chicks. Vision Res. 2008;48(15):1655–1662. doi: 10.1016/j.visres.2008.03.022. [DOI] [PMC free article] [PubMed] [Google Scholar]
- Troilo D, Gottlieb MD, Wallman J. Visual deprivation causes myopia in chicks with optic nerve section. Curr Eye Res. 1987;6(8):993–999. doi: 10.3109/02713688709034870. [DOI] [PubMed] [Google Scholar]
- Vaegan, Arden GB. Effect of pattern luminance profile on the pattern ERG in man and pigeon. Vision Res. 1987;27(6):883–892. doi: 10.1016/0042-6989(87)90004-6. [DOI] [PubMed] [Google Scholar]
- Viswanathan S, Frishman LJ, Robson JG, Harwerth RS, Smith EL., 3rd The photopic negative response of the macaque electroretinogram: reduction by experimental glaucoma. Invest Ophthalmol Vis Sci. 1999;40(6):1124–1136. [PubMed] [Google Scholar]
- Wallman J, Winawer J. Homeostasis of eye growth and the question of myopia. Neuron. 2004;43(4):447–468. doi: 10.1016/j.neuron.2004.08.008. [DOI] [PubMed] [Google Scholar]
- Wildsoet C, Pettigrew JD. Experimental myopia and anamalous eye growth patterns unaffected by optic nerve section in chickens: Evidence for local control of eye growth. Clinical Vision Sciences. 1988;3(2):9. [Google Scholar]
- Wildsoet CF, Schmid KL. Optical correction of form deprivation myopia inhibits refractive recovery in chick eyes with intact or sectioned optic nerves. Vision Res. 2000;40(23):3273–3282. doi: 10.1016/s0042-6989(00)00138-3. [DOI] [PubMed] [Google Scholar]
- Zhao L, Wang Y, Chen CX, Xu L, Jonas JB. Retinal nerve fibre layer thickness measured by Spectralis spectral-domain optical coherence tomography: The Beijing Eye Study. Acta Ophthalmol. 2013;92(1):35–41. doi: 10.1111/aos.12240. [DOI] [PubMed] [Google Scholar]