

Abstract
We have analyzed gene expression in various brain regions of humans and chimpanzees. Within both human and chimpanzee individuals, the transcriptomes of the cerebral cortex are very similar to each other and differ more between individuals than among regions within an individual. In contrast, the transcriptomes of the cerebral cortex, the caudate nucleus, and the cerebellum differ substantially from each other. Between humans and chimpanzees, 10% of genes differ in their expression in at least one region of the brain. The majority of these expression differences are shared among all brain regions. Whereas genes encoding proteins involved in signal transduction and cell differentiation differ significantly between brain regions within individuals, no such pattern is seen between the species. However, a subset of genes that show expression differences between humans and chimpanzees are distributed nonrandomly across the genome. Furthermore, genes that show an elevated expression level in humans are statistically significantly enriched in regions that are recently duplicated in humans.
One of the challenges in the wake of the completion of the human genome sequence is to better understand the genetic and evolutionary background of phenotypic traits that set humans apart from our closest evolutionary relatives, the chimpanzees. Such phenotypic traits include aspects of anatomy, locomotion, technology, and communication (Olson and Varki 2003). The draft sequence of the chimpanzee genome will allow most nucleotide differences between the two species to be listed. However, to interpret these differences in terms of function, an important step is to know how gene expression has changed between humans and chimpanzees. Because several important phenotypic differences that distinguish humans and apes are associated with cerebral activity, it is of particular interest to investigate the gene expression patterns in brains of humans and chimpanzees.
A first study of the transcriptomes of humans and chimpanzees (Enard et al. 2002) found that although the transcriptomes of the left prefrontal area of the brain as well as the liver vary substantially among individuals within the species, species-specific changes in expression pattern can be identified. Interestingly, although the total amount of gene expression differences is larger in liver than in the prefrontal area of the brain, the amount of changes on the evolutionary lineage to humans relative to the amount on the lineage to chimpanzees was higher in the brain than in the liver (Enard et al. 2002). Subsequent reanalyses of these data have confirmed this as well as pointed out that there is an apparent increase in gene expression of many genes in the human lineage (Gu and Gu 2003). Further reanalyses of the data have suggested that the acceleration and up-regulation of genes in the human lineage are unlikely to be caused by biases resulting from DNA sequence differences between the species (Hsieh et al. 2003). An independent study using various samples of the cerebral cortex recently arrived at similar results (Caceres et al. 2003).
To gain a better understanding of the evolution of the brain transcriptome in humans and chimpanzees, it is necessary to analyze gene expression in different regions of the brain in multiple individuals to gauge to what extent brain regions differ in gene expression within individuals, between individuals and between species. So far, this has only been done in inbred strains of mice, wherein one study found that the cortex, cerebellum, and the midbrain differ relatively little, whereas the cerebellum was the most unique region of those tested (Sandberg et al. 2000). Here, we describe the analysis of gene expression patterns in several regions within the human brain as well as in homologous regions of the brains of chimpanzees. We put the differences found within individuals in relation to those seen between individuals and between the species as well as to genomic features such as segmental duplications and chromosomal rearrangements.
RESULTS
Patterns of Gene Expression Within Human and Chimpanzee Brains
Four regions of the cerebral cortex (dorsolateral prefrontal cortex, anterior cingulate cortex, primary visual cortex, Broca's area), the central part of the cerebellum (Vermis cerebelli), and the caudate nucleus were dissected in three adult male humans and three adult male chimpanzees (Fig. 1). In addition, the premotor cortex and the area homologous to Broca's area in the right hemisphere were isolated from three humans.
Figure 1.

Location of areas sampled from the human cerebral cortex. The size of the marked areas corresponds approximately to the size of the dissected tissue sample. The sample from the right hemisphere (not shown) was taken from the location that mirrors the location of Broca's area. The human brain pictures are reprinted with permission from the Digital Anatomist Project, Department of Biological Structure, University of Washington © 1998 (http://www9.biostr.washington.edu/da.html).
Total RNA from each sample was isolated, labeled, and hybridized to Affymetrix oligonucleotide arrays containing probes to ∼10,000 human genes. All reliably measured expression differences within the species were summarized for each pairwise comparison and visualized in a multidimensional scaling plot for humans (Fig. 2A) and chimpanzees (Fig. 2C). Although the differences among the individuals are substantial, the caudate nucleus, the cerebellum, and the cerebral cortex regions are clearly differentiated in one dimension of the plot. In contrast, all regions of the cerebral cortex group together according to the individual from which they derive rather than according to the respective regions. This effect is particularly pronounced in humans, but also apparent in chimpanzees when the caudate nucleus and cerebellum are excluded from the analysis (Fig. 2B,D). When the expression differences within the brain are compared in the two species, the distance between the cerebellum and each of the other five brain regions studied is found to be slightly but significantly greater in humans than in chimpanzees (p = 0.015 for Broca's area, p = 0.009 for prefrontal cortex, p = 0.034 for primary visual cortex, p = 0.025 for anterior cingulate cortex, and p = 0.018 for caudate nucleus, Student's t-tests), but no significant differences are seen for any other pairs of regions (p > 0.05).
Figure 2.

Multidimensional scaling plots of gene expression differences identified within species. The colors refer to individuals. (A) Expression differences in humans. (B) Expression differences within the human cerebral cortex. (A) Broca's area; (B) homolog of Broca's area in the right hemisphere; (C) prefrontal cortex; (D) premotor cortex; (E) primary visual cortex; (F) anterior cingulate cortex. (C) Expression differences in chimpanzees. (D) Expression differences within the chimpanzee cerebral cortex. Labels as in (B).
Another way to gauge the difference in gene expression within the brain is to determine the number of genes that differ significantly in expression between brain regions in all three individuals within a species (Table 1). In the cerebral cortex, the biggest difference in gene expression is between the primary visual cortex and the anterior cingulate cortex in both humans and chimpanzees, where 193 and 227 genes differ in expression in humans and chimpanzees, respectively. Many fewer differences are found among the other regions of the cortex. For example, only one gene out of the 4998 genes with detectable expression differs in expression between Broca's area and the left prefrontal cortex in all three humans analyzed and none in chimpanzees. Similarly, only four genes differ between Broca's area and its homolog in the right hemisphere in humans. Because the number of differences seen between independent experimental replicates of the same region of the brain in the same individual is one to two (data not shown), this means that we cannot reliably detect any differences among the transcriptomes of these regions. In contrast, ∼500–600 genes differ in expression level between the caudate nucleus and the regions of the cerebral cortex in both species, whereas ∼1400 genes differ between the cerebellum and the other brain regions in humans and ∼1200 in chimpanzees.
Table 1.
Number of Gene Expression Differences Between the Brain Regions
|
Humans
|
Chimpanzees
|
|||||||||||
|---|---|---|---|---|---|---|---|---|---|---|---|---|
| Region | B | BR | PFC | PMC | PVC | ACC | CN | B | PFC | PVC | ACC | CN |
| BR | 4 | |||||||||||
| PFC | 1 | 5 | 0 | |||||||||
| PMC | 23 | 3 | 38 | |||||||||
| PVC | 21 | 77 | 37 | 23 | 130 | 114 | ||||||
| ACC | 40 | 42 | 29 | 158 | 193 | 5 | 17 | 227 | ||||
| CN | 473 | 598 | 493 | 560 | 485 | 594 | 601 | 557 | 710 | 548 | ||
| CB | 1327 | 1423 | 1414 | 1332 | 1017 | 1453 | 1601 | 1181 | 1205 | 892 | 1224 | 1320 |
(B) Broca's area; (BR) the homologous area to Broca's area in the right hemisphere; (PFC) prefrontal cortex; (PMC) premotor cortex; (PVC) primary visual cortex; (ACC) anterior cingulate cortex; (CN) caudate nucleus; (CB) cerebellum.
Region-Specific Expression Differences
Next, we determined if genes with expression patterns specific to a brain region in one species also display such specificity in the other species. In Figure 3A, it can be seen that 473 genes show no difference in expression level among the four cerebral cortex regions but differ in their expression from both the caudate nucleus and the cerebellum within all three humans and/or all three chimpanzees. Of these genes, 22 genes (4.6%) show a difference in either humans or chimpanzees but not in the other species. For the caudate nucleus, 255 genes differ in one or both of the species, and three of these (1.2%) differ in only one species. For the cerebellum, the corresponding numbers of genes are 749 and 19 (2.5%), respectively. Thus, it appears that relatively more genes show species-specific expression patterns in the cerebral cortex than in the caudate nucleus or the cerebellum (p = 0.017 and 0.05, respectively, Fisher's exact test).
Figure 3.

Number of genes exhibiting expression patterns specific to brain regions in humans and chimpanzees. (A) Genes with region-specific expression among the cerebral cortex (CX), the caudate nucleus (CN), and cerebellum (CB). Genes with expression specific for the cerebral cortex were defined as not showing any significant difference among the four cerebral cortex regions but significant differences to both the caudate nucleus and the cerebellum in at least one of these four regions. The numbers of genes with correlation coefficients <0.6 between human and chimpanzee brain expression profiles are shown in parentheses. (B) Genes with region-specific expression among four brain regions in a broader analysis of the transcriptome including the anterior cingulate cortex (ACC) and Broca's area (B).
To investigate if this is the case, we used the full set of five Affymetrix arrays that together allow the expression levels of ∼40,000 transcripts to be determined to study Broca's area, the cingulate cortex, the caudate nucleus, and the cerebellum in humans and chimpanzees. Figure 3B shows that 29 and 25 genes are specific to Broca's area and the cingulate cortex, respectively, in either humans or chimpanzees or in both species. Of these, five and seven, or 17% and 28%, respectively, show specificity in only one of the two species. For the caudate nucleus and cerebellum, 794 and 2962 genes are specific to the respective regions in one or the other species, and nine and 72 genes, or 1.1% and 2.4%, in one species and not the other, respectively. Thus, the cerebral cortex differs from the other two regions of the brain in that a larger proportion of genes show region-specific expression patterns that differ between the two species.
Functional Differences Among Brain Regions
We used the categories defined by the Gene Ontology (GO) Consortium (Ashburner et al. 2000) to investigate whether genes differentially expressed among brain regions are over- or underrepresented in particular functional groups. First, we investigated the 3817 genes that were differentially expressed among two cerebral cortex regions, the caudate nucleus and cerebellum, in all three individuals of one or both species (Fig. 3B). GO provides three functional taxonomies of genes: “cellular component,” “biological process,” and “molecular function.” To determine if the distribution of differentially expressed genes across the functional groups within each taxonomy differs significantly from the distribution of detected genes, the sum of the χ2 distances between the two distributions was calculated and compared with the sums calculated for 10,000 sets of genes randomly selected from all genes with detectable expression. According to this criterion, all three taxonomies were significantly changed (p < 0.0001).
Single functional groups that contain significantly more, or significantly fewer, differentially expressed genes than expected from a hypergeometric distribution were identified within each GO taxonomy (Supplemental Table 1). In the taxonomy “biological process” (Fig. 4), 18 groups of genes contain a significant excess of expression differences between brain regions, and 12 of these are associated with neuronal function, differentiation, and development in a broad sense: Eight groups are involved in synaptic transmission and signal transduction, and four are involved in cell differentiation, neurogenesis, and development, whereas one group each contains genes involved in protein phosphorylation, ion transport, and cyclic nucleotide metabolism, respectively. In contrast, of the 11 groups of genes that are significantly conserved in their expression, eight are involved in protein metabolism and transport in a broad sense. Similarly, in the taxonomy “molecular function,” of 22 groups with an excess of differentially expressed genes, 19 are involved in signal transduction, ion transport, and regulation of phosphorylation or sulforylation, whereas out of eight conserved groups of genes, six are involved in protein synthesis and turn-over. The taxonomy “cellular component” contains seven groups that are significantly changed among brain regions, four of which are associated with vesicles and membranes, whereas the 13 groups of genes that are significantly conserved encode intracellular gene products. Thus, among brain regions, genes whose products are involved in signal transduction and neurogenesis are significantly more changed with respect to their expression than other groups of genes. In contrast, genes involved in protein synthesis and turn-over are significantly conserved when different regions of the brain are compared.
Figure 4.

Groups of genes that show significant excess or significant lack of gene expression differences among brain regions in the GO taxonomy “biological process.” Red indicates significant excess of differentially expressed genes, and blue indicates significant lack of expression differences. Numbers of detected and differentially expressed genes in a group are shown in parentheses. Brackets to the right indicate cases in which the same functional group occurs multiple times in the tree.
We used the same approach to determine whether particular functional groups of genes are over- or underrepresented among 389 genes that were differentially expressed between any two cerebral cortex regions in all three humans and/or all three chimpanzees. Although much fewer genes are considered, the distribution of differentially expressed genes across the functional groups differs significantly from the distribution of all detected genes in all three GO taxonomies (p < 0.001; Supplemental Table 2). In the taxonomy “biological process,” four out of 14 groups of genes containing a significant excess of expression differences are associated with cell communication, differentiation, and development; in the taxonomy “molecular function,” eight out of 12 such groups are related to signal transduction; and in the taxonomy “cellular component,” all six such groups are associated with the plasma membrane and the extracellular space.
Expression Differences Between the Species
There are at least three issues that may complicate comparisons between humans and chimpanzees using microarrays. One such issue is experimental variation. This is unlikely to be a problem here because analysis of independent experimental replicates of the same tissue samples indicates that <1% of expression differences between the species are caused by experimental error (data not shown).
A second issue is that the extent of variation in gene expression among individuals within the species may be so large that any differences seen between the species are due to chance. To address this, we randomized the expression measurements for all genes with respect to the individual and species in which they occurred for each of the six brain regions. The results (see Methods) show that ∼5% of the observed differences between the species are expected to be caused by the variation among individuals within each of the two species. Furthermore, we compared the current data to data generated more than two years ago (Enard et al. 2002) in which four out of six individuals analyzed were different and found very few disagreements in the results (Fig. 5A). Finally, we compared our data to a recently published study (Caceres et al. 2003) of gene expression in various parts of the cerebral cortex of five humans and four chimpanzees. Out of 22 genes that were found to differ in expression in the cerebral cortex of five humans and four chimpanzees and were verified using quantitative real-time PCR, 15 show significant differences in expression in the same direction in our data whereas the remaining seven genes show expression differences in the same direction that are not classified as significant by our criteria.
Figure 5.

Gene expression differences between humans and chimpanzees. (A) Hierarchical clustering of expression differences between humans and chimpanzees in the prefrontal cortex in the current data set with (PFC) and without (PFC N) masking of the sequence differences between the species and previously published prefrontal cortex (PFC′) and liver data (Enard et al. 2002). All genes differentially expressed in at least one tissue and detected in the other one are shown. The vertical black bar indicates the cluster of expression differences that disappears after the masking procedure. (B) Hierarchical clustering of genes classified as differentially expressed between humans and chimpanzees in at least one out of six studied brain regions. Each row represents a gene and each column represents a pairwise comparison between one human and one chimpanzee in a given tissue. The magnitude of expression differences is shown as the base two logarithm of the ratio of the gene expression level in humans to the one in chimpanzees. Higher expression in humans is shown in red and higher expression in chimpanzees in blue, with color intensity being proportional to the magnitude of the expression difference as indicated by the color bar at the bottom of the figure. (B) Broca's area; (PFC) prefrontal cortex; (PVC) primary visual cortex; (ACC) anterior cingulate cortex; (CN) caudate nucleus; and (CB) cerebellum.
A third issue that may complicate interspecies comparisons is that chimpanzee cDNAs differ on average at 0.8% of nucleotide positions from homologous human cDNAs (Hellmann et al. 2003). Because the arrays carry oligonucleotides designed to match human DNA sequences, nucleotide sequence differences between the species will contribute to apparent differences in gene expression between the species. We tested to what extent this may influence the results by using 262 chimpanzee transcripts for which the complete target sequences used for the hybridizations are known. The results (see Methods) indicate that ∼22% of the genes that show differential expression between humans and chimpanzees may do so because of nucleotide sequence differences between the species. A similar proportion of expression differences was suggested to be due to the differences in nucleotide sequence in other studies of gene expression in humans and chimpanzees using oligonucleotide-based microarrays (Caceres et al. 2003; Karaman et al. 2003).
Because DNA sequence differences between the species represent the major source of potential bias in the results, we used a computational algorithm that identifies oligonucleotides that hybridized inconsistently in the two species across the 16 oligonucleotides used to detect each transcript (M. Lachmann, I. Hellmann, H. Boris, and P. Khaitovich, in prep.). As implemented, this algorithm identifies 41% of human–chimpanzee sequence differences with a false-positive rate of ∼4%. An advantage of this approach is that it identifies such sequence differences that affect hybridization while it tends to ignore differences that do not affect hybridization. A further advantage is that it can be applied irrespective of the availability and quality of chimpanzee genome sequence data currently available. This is crucial because the chimpanzee draft genome sequence contains a large proportion of errors (I. Hellmann, unpubl.). After removing oligonucleotides using this algorithm, we retained probe sets where at least eight out of 16 probes remained. This resulted in a total of 18,522 probe sets with an average of 14.9 probes.
For each brain region, we defined an expression difference as a significant difference (p ≥ 0.95 or p ≤ 0.05 and ≥1.15-fold change) seen in all nine comparisons performed between the species. Using this criterion, 143 to 268 out of 4726 to 5001 genes with expression levels detectable above background, that is, 3%–5.5% of expressed genes, differ in expression in any one of the six regions of the brain analyzed in both species (Table 2). In the experiments in which the set of five arrays was used to study four regions of the brain, 636–1186 out of 13,693–15,233 detected genes, that is, 4.5%–7.8%, differ in at least one region of the brain. Overall, a total of 2014 genes or ∼10% of genes analyzed differed in expression between humans and chimpanzees in at least one region of the brain (Supplemental Table 3). In general agreement, a total of 1234 genes were classified as being differentially expressed between humans and chimpanzees using more stringent criteria (p ≥ 0.95 or p ≤ 0.95 and ≥1.4-fold change).
Table 2.
Gene Expression Differences Between Humans and Chimpanzees
|
U95A array
|
U95A-E arrays
|
|||||
|---|---|---|---|---|---|---|
| Region | Detected | Changed | % | Detected | Changed | % |
| B | 4726 | 143 | 3 | 13716 | 685 | 5 |
| PFC | 4943 | 175 | 3.5 | |||
| PVC | 4820 | 148 | 3.1 | |||
| ACC | 5001 | 157 | 3.1 | 14081 | 636 | 4.5 |
| CN | 4828 | 157 | 3.3 | 13693 | 735 | 5.4 |
| CB | 4915 | 268 | 5.5 | 15233 | 1186 | 7.8 |
| Combined | 5839 | 528 | 9 | 18516 | 1945 | 10.5 |
(B) Broca's area; (PFC) prefrontal cortex; (PVC) primary visual cortex; (ACC) anterior cingulate cortex; (CN) caudate nucleus; (CB) cerebellum.
When differences between the species found in any of the six brain regions studied in humans and chimpanzees are hierarchically clustered (Fig. 5B), it can be seen that the patterns of differences found within each region are very similar. Only the cerebellum shows several genes that differ in their expression between the species in this particular brain region and not in the other ones. This is seen also in the comparison of four brain regions with the five arrays (data not shown). Thus, a large proportion of the expression differences found between the species is not restricted to one particular region of the brain and may even be common to several different organs.
To verify this result, we reanalyzed data masking all array oligonucleotides that did not match the chimpanzee DNA sequence perfectly or where the chimpanzee sequence was unknown using all available chimpanzee DNA sequences. This resulted in a set of 3838 genes that could be reliably detected in either one or both species in at least one of the six brain regions with eight or more oligonucleotide probes. In this case, 406 genes (10.6%) were differentially expressed between the species, and 79% showed the same expression pattern difference in all six brain regions analyzed (data not shown). In addition, we compared the data collected using Affymetrix arrays with data collected by spotted cDNA arrays for six human and five chimpanzee prefrontal cortex samples (P. Khaitovich, unpubl.). Because cDNA arrays have different sources of experimental error, they can be used to verify Affymetrix data (Lee et al. 2003). Out of 175 genes classified as differentially expressed between humans and chimpanzees in prefrontal cortex using Affymetrix arrays, 54 were present on the cDNA arrays. Out of these, 40 (74%) changed significantly between humans and chimpanzees (Student's t-test, p < 0.05). The proportion of verified genes thus agrees well with other studies using the same approach (Caceres et al. 2003; Lee et al. 2003).
Functional Differences Between Humans and Chimpanzees
We tested whether the 2014 genes that are differentially expressed between humans and chimpanzees are differently distributed among functional GO groups than the 18,522 genes with detectable expression in at least one species. None of the three GO taxonomies “biological process” (p = 0.12), “cellular component” (p = 0.68), and “molecular function” (p = 0.18) showed any significant difference between the two distributions.
Genomic Localization and Segmental Duplications
To determine the genomic localization of genes that differ in expression between humans and chimpanzees, we mapped all genes present on the full set of arrays to the human genome. The ratio of differentially expressed to detected genes varied among the chromosomes, ranging from 9.4% on Chromosome 19 to 17.3% on Chromosome 9 (Table 3). Using a sliding window of 21 genes with detected expression, we determined the distribution of genes differentially expressed between humans and chimpanzees along the chromosomes (Fig. 6). To assess if the observed distribution deviates from what may be expected by chance, we compared it with 1,500,000 permutations of the assignments of expression differences among the detected genes (data not shown). The observed distribution differs significantly from the simulated one with an excess of windows having both more and less differentially expressed genes than expected (Table 4). We repeated using sliding windows containing 11, 31, and 41 genes; the distributions of differentially expressed genes were similarly found to differ from what is expected by chance (data not shown). Thus, genes that differ in their expression between humans and chimpanzees are nonrandomly distributed over the genome.
Table 3.
Distribution of Expression Differences Among Human Chromosomes
|
Number of genes
|
|||
|---|---|---|---|
| Chromosome | Detected | Changed | % changed |
| Chr. 19 | 715 | 67 | 9.4 |
| Chr. 21 | 146 | 14 | 9.6 |
| Chr. X | 464 | 46 | 9.9 |
| Chr. 20 | 343 | 38 | 11.1 |
| Chr. 11 | 758 | 87 | 11.5 |
| Chr. 14 | 471 | 55 | 11.7 |
| Chr. 10 | 577 | 70 | 12.1 |
| Chr. 12 | 760 | 92 | 12.1 |
| Chr. 17 | 712 | 87 | 12.2 |
| Chr. 18 | 242 | 30 | 12.4 |
| Chr. Y | 8 | 1 | 12.5 |
| Chr. 1 | 1348 | 177 | 13.1 |
| Chr. 3 | 870 | 114 | 13.1 |
| Chr. 16 | 567 | 76 | 13.4 |
| Chr. 4 | 585 | 79 | 13.5 |
| Chr. 8 | 560 | 76 | 13.6 |
| Chr. 2 | 1023 | 141 | 13.8 |
| Chr. 6 | 712 | 99 | 13.9 |
| Chr. 7 | 678 | 95 | 14 |
| Chr. 22 | 295 | 43 | 14.6 |
| Chr. 5 | 747 | 112 | 15 |
| Chr. 15 | 479 | 73 | 15.2 |
| Chr. 13 | 293 | 47 | 16 |
| Chr. 9 | 560 | 97 | 17.3 |
Shading indicates chromosomes containing rearrangements between humans and chimpanzees.
Figure 6.

Distribution of gene expression differences between human and chimpanzee brains across the human genome. The profile over each chromosome shows the proportion of the differentially expressed genes in sliding windows containing 21 detected genes. Red horizontal lines indicate 5% significance cutoff. Red vertical bars indicate cytological bands to which the breakpoints of chromosomal rearrangements between humans and chimpanzees have been mapped (Yunis and Prakash 1982).
Table 4.
Distribution of Gene Expression Differences Between Humans and Chimpanzees Across the Human Genome
|
Changed genes
|
Number of windows
|
||
|---|---|---|---|
| Observed | Simulated mean | p-value | |
| 0/21 | 1024 | 705 | <0.0001 |
| 1/21 | 2561 | 2241 | 0.0006 |
| 2/21 | 3195 | 3380 | 0.9385 |
| 3/21 | 2812 | 3219 | 0.9997 |
| 4/21 | 2000 | 2172 | 0.9720 |
| 5/21 | 900 | 1104 | 0.9997 |
| 6/21 | 493 | 439 | 0.1085 |
| 7/21 | 263 | 140 | <0.0001 |
| 8/21 | 108 | 36 | <0.0001 |
| 9/21 | 41 | 8 | 0.0002 |
| 10/21 | 23 | 1 | 0.0000 |
| 11/21 | 9 | 0 | 0.0009 |
| 12/21 | 6 | 0 | 0.0005 |
| 13/21 | 5 | 0 | 0.0001 |
| 14/21 | 2 | 0 | <0.0001 |
| 15/21 | 2 | 0 | <0.0001 |
| 16/21 | 1 | 0 | <0.0001 |
The numbers of 21-gene-windows showing different numbers of differently expressed genes are given for the observed data as well as for the mean of 1.5 million permutated data sets. Significant differences (p < 0.05) between the observed and the simulated random data are indicated by italicized p-values.
We furthermore analyzed whether expression differences between humans and chimpanzees are associated with genomic regions enriched for segmental duplications, that is, the 5% of the human genome that occurs as two or more copies with >90% similarity to each other (Bailey et al. 2001, 2002). Table 5 shows that segmental duplications are significantly overrepresented among genes differentially expressed between humans and chimpanzees (p < 0.05, Fisher exact test). When the segmental duplications are divided into those with 90%–95%, 95%–98%, and 98%–100% sequence similarity, the overrepresentation is significant in all cases but increases with increasing sequence similarity. The most extreme overrepresentation of differentially expressed genes is observed among the duplications that are >98% identical, in which nearly 25% of all duplications that harbor genes show significant differences in gene expression. When genes were further subdivided according to whether they are more highly expressed in chimpanzee or in humans, the overrepresentation of duplicated genes is significant only for the genes that are more highly expressed in humans and not for those that are more highly expressed in chimpanzees (Table 5).
Table 5.
Association Between Segmental Duplications and Gene Expression Differences
|
Expressed genes
|
Differently expressed genes
|
Higher in humans
|
Higher in chimpanzees
|
||||||||
|---|---|---|---|---|---|---|---|---|---|---|---|
| Duplicationsa | Detected | % | Detected | % | p-valueb | Detected | % | p-value | Detected | % | p-value |
| 90%-95% | 663 | 3.6 | 7.4 | 3.7 | 0.049 | 51 | 4.1 | 0.043 | 23 | 3.1 | 0.064 |
| 95%-98% | 448 | 2.4 | 59 | 3.0 | 0.024 | 37 | 3.0 | 0.039 | 22 | 2.9 | 0.063 |
| 98%-100% | 483 | 2.6 | 120 | 6.0 | <0.0001 | 103 | 8.2 | <0.0001 | 17 | 2.3 | 0.083 |
| All genes | 18,340 | 100 | 1999 | 100 | 1250 | 100 | 747 | 100 | |||
Grouped by the percent of sequence identity between the duplicated copies.
p-values calculated using Fisher's Exact test.
DISCUSSION
Region-Specific Gene Expression
Gene expression as measured from tissue samples reflects cellular RNA levels as well as cellular composition of the tissues. Because discrete regions within the brain have different motoric, sensory, and cognitive functions, it is of interest to explore to what extent differences in gene expression can be detected between functionally different brain regions. The results show that the cerebellum differs the most from the other regions. Similar observations have been previously reported in inbred strains of mouse (Sandberg et al. 2000). The caudate nucleus also differs to a substantial degree from other brain regions analyzed, whereas various regions of the cerebral cortex differ little from each other. Notably, the cerebellum is the only part of the brain that shows a greater distance to the other regions in humans than in chimpanzees.
Within the cerebral cortex, we find the biggest difference in gene expression between the anterior cingulated cortex and the primary visual and primary motor cortex areas (Table 1). Interestingly, there are much fewer differences between the two primary areas, despite substantial differences in function and cytoarchitecture (Kandel et al. 2000). We are unable to identify any significant expression differences between Broca's area located in the left frontal lobe, which is associated with speech production, and the corresponding area in the right hemisphere, nor between Broca's area and the left prefrontal cortex. In fact, the transcriptomes of the prefrontal cortex, Broca's area, the anterior cingulate cortex, and the primary visual cortex differ less within individuals than each of these regions differ between the three individuals (Fig. 2B). Thus, we conclude that no major change in expression pattern occurred in Broca's area resulting from the acquisition of language in humans. However, it should be noted that the tissue samples analyzed represent a complex mixture of different cell types and that we are therefore not able to detect expression differences confined to a small proportion of cells. This problem is particularly pronounced for cerebral cortex samples because of their more heterogeneous cellular composition compared with caudate nucleus or cerebellum. It is therefore possible that gene expression changes in certain cells may have been involved in language acquisition. Detailed studies of gene expression in isolated cells may eventually reveal this.
It may seem surprising that some cerebral cortex regions show little or no difference in terms of gene expression although they differ considerably in function (Kandel et al. 2000). In this regard, it is of interest that the main groups of genes that differ between cerebellum, caudate nucleus, and the cerebral cortex as well as between regions of the cortex are involved in signal transduction. Accordingly, changes of gene expression programs involved in signal transduction could also be involved when different regions of the cerebral cortex acquire the functions of other regions, sometimes even during adult life, as a consequence of brain damage (Finger and Stein 1982), blindness (Sadato et al. 1996), or redirection of sensory inputs (von Melchner et al. 2000). It will be extremely interesting to elucidate if such changes in function result in changes in gene expression similar to the ones identified here.
Differences Between Individuals
When gene expression differences of the cerebral cortex are analyzed between individuals (Fig. 2B,D), it becomes clear that the transcriptomes of the different cortex regions are more similar within individuals than between individuals. This may have several causes. One possibility is that it reflects individual differences in how the cerebral cortex is formed during fetal life. This process involves large numbers of migrations of cells and formation of connections between them that cannot be genetically predetermined but has to involve stochastic or epigenetic events that will differ from individual to individual. However, it is also possible that it reflects responses of different individuals to environmental or physiological differences throughout life or immediately before death. Only the systematic study of a larger number of individuals will be able to resolve the basis for the interindividual differentiation of the cerebral cortex.
It is noteworthy that regions of the cerebral cortex differ approximately twofold more among the humans than among the chimpanzees. Because this is not true for the caudate nucleus and the cerebellum, this is unlikely to be caused by undetected differences in RNA quality or to post mortem conditions affecting the brain as a whole. It is not likely to be caused by differences in the amount of DNA sequence variation within the species because chimpanzees carry on average more DNA sequence differences between individuals than humans (Kaessmann et al. 1999). A possible explanation is that the cerebral cortex may be more influenced by environmental and physiological conditions than the other brain regions and that the humans differ more than the chimpanzees in living conditions. This is compatible with the fact that genes highly variable among humans are involved in cell–cell signaling and cell adhesion (data not shown). Alternatively, there might be more individual differences in how the cerebral cortex is formed in humans than in chimpanzees, because in humans the myelinization of parts of the cortex is finalized only in the late teens, whereas it is finished earlier in chimpanzees. Interestingly, when the between-individual variation of expression levels is compared in humans and in chimpanzees, the same genes tend to vary between individuals in both species (data not shown). Further studies may clarify whether this reflects responses to environmental stimuli or simply a lack of regulatory constraints.
Evolution of Brain Transcriptomes
The overwhelming majority of gene expression differences between humans and chimpanzees are found in all regions studied. Thus, the overall gene expression patterns are very similar within the human and the chimpanzee brain. The only exceptions are the larger differentiation of the cerebellum relative to other parts of the brain both within human individuals and between the species, and the larger differentiation of the cerebral cortex between individuals in humans. This general picture agrees with the notion that when human-specific cognitive abilities arose, they recruited pre-existing brain structures that already carried the appropriate cytoarchitecture as well as underlying molecular functions for the novel functions.
Two previous studies have compared gene expression profiles in brains of humans and chimpanzees (Enard et al. 2002; Caceres et al. 2003). One study used samples from the prefrontal cortex, whereas the other used different cortical regions in different individuals. The data of both studies suggest that more genes are up-regulated than down-regulated in humans relative to chimpanzees than vice versa (Caceres et al. 2003; Gu and Gu 2003). The same phenomenon is seen here: Out of 2014 genes differentially expressed between the species, 1270 genes are more highly expressed in humans than in chimpanzees, whereas 744 are more highly expressed in chimpanzees (p ≪ 0.001). The most trivial explanation for this would be that the array oligonucleotides are designed according to human gene sequences and that thus they fit less well to chimpanzee genes. This would lead to a systematic bias in which human genes would seem to be more highly expressed than chimpanzee genes. Because oligonucleotides that show inconsistent hybridization patterns are removed here, this is unlikely to be the explanation. This said, it should be noted that when the analysis is confined to the 406 differentially expressed genes for which the chimpanzee DNA sequence is known, 207 are more highly expressed in humans and 199 in chimpanzees. Thus, although the up-regulation of genes on the human lineage may be real, further work is needed to verify it. This might be done using cDNA arrays that are less sensitive to DNA sequence changes or, alternatively, with arrays designed based on chimpanzee genes.
Another observation from previous studies is that proportionally more genes have changed in the human lineage than in the chimpanzee lineage and that this acceleration in transcriptome change is specific to the brain (Enard et al. 2002; Caceres et al. 2003). Because samples from different regions of orangutans are not available and the rhesus macaque carries too many sequence differences to be reliably analyzed to the human oligonucleotide arrays (M. Lachmann, unpubl.), we are not able to analyze this effect for these samples. Future work using arrays that are suitable for the rhesus macaque samples as well as for the samples from other nonhuman primates would allow this question to be addressed systematically.
Although “interesting” hypothetical stories can be construed for many genes that are differentially expressed between humans and chimpanzees, we prefer to take a statistical approach and test by resampling (see Methods) if any of the functional groups of genes defined in the GO show an excess or lack of genes that differ in expression. When genes that differ in expression between different brain regions are tested in this way, groups of genes involved in cell communication, differentiation, and development tend to differ more than expected, whereas groups of genes involved in protein synthesis and turn-over differ less (Fig. 4). In contrast, when the genes that differ in their expression between humans and chimpanzees are analyzed, none of the three GO taxonomies shows a significant excess neither of differentially expressed genes nor of genes conserved with respect to expression. Thus, under the statistical approach used, no groups of genes stand out as changed in expression between humans and chimpanzees. This result does not support the recent claim that genes involved in neural functions and in aerobic energy metabolism are significantly up-regulated in humans relative to chimpanzees (Uddin et al. 2004).
Genomic Localization and Gene Expression
Because gene expression differences between the species are nonrandomly distributed over the genome (Fig. 6), an obvious question is if they correlate with any other genomic feature. For instance, it has been suggested that large-scale chromosomal rearrangements may play a role in speciation by reducing recombination in the heterokaryotypes (Navarro and Barton 2003a) and that chromosomes and chromosomal regions carrying rearrangements may therefore be more likely to carry genes that have changed in such a way that their two forms result in reduced fitness in heterozygotes. In support of this idea, it was recently claimed that human Chromosomes 1, 2, 4, 5, 9, 12, 15, 16, 17, and 18, which carry rearrangements between humans and chimpanzees, show more indications of selection in coding regions than nonrearranged chromosomes (Navarro and Barton 2003b). Although this may be caused by the biased set of genes analyzed (Lu et al. 2003), it is striking that the number of genes that are differentially expressed on the 10 chromosomes rearranged between humans and chimpanzees is significantly greater than on the other 14 chromosomes that carry no rearrangements (χ2 = 4.26, p = 0.039). This is not caused by local effects close to chromosomal breakpoints (data not shown). In contrast, no such association was found in a comparison of human and bonobo fibroblast cell lines (Karaman et al. 2003). This may be because of differences in the statistical criteria used for defining differentially expressed genes, the lower number of genes interrogated in these studies, or differences between cultured cells and tissues. Clearly, more work is needed to elucidate if and to what extent chromosomal rearrangements have played a role in speciation during human evolution.
Gene expression differences between humans and chimpanzees are furthermore associated with regions of segmental duplications in the human genome (Table 5). This association is seen for genes that show higher expression levels in humans than in chimpanzees, whereas there is no statistically significant association with genes that are more highly expressed in chimpanzees. Although other methodological issues cannot be precluded, the fact that segmental duplications were ascertained in the human genome and not in the chimpanzee genome is the most likely basis for this difference (Samonte and Eichler 2002). A more systematic study of the distribution of segmental duplications in humans and chimpanzees in conjunction with gene expression studies will eventually clarify this issue.
It is furthermore noteworthy that the association between interspecies expression differences and segmental duplications is greatest for the duplications that are most identical in DNA sequence (Table 5). Because duplications that arose more recently are expected to show higher sequence identity, recently duplicated genes are more likely to be associated with a difference in expression. One possible explanation may be that once a gene has been duplicated and its expression therefore increased, secondary mutations may often ensue that decrease expression to levels approximating those that existed before the duplication. Consequently, more recent duplications will show greater differences in expression between humans and chimpanzees.
METHODS
Tissue Samples and Microarray Data Collection
Entire brains were removed at autopsies from three male humans who were 45, 45, and 70 years old, had no history of brain-related diseases, and suffered sudden deaths without associated brain damage. Approximately 200 mg of tissue was dissected from Broca's area (Brodmann area 44, left hemisphere), Broca's area homolog from the right hemisphere (Brodmann area 44, right hemisphere), dorsolateral prefrontal cortex (Brodmann area 9, left hemisphere), premotor cortex (Brodmann area 6, left hemisphere), primary visual cortex (Brodmann area 17, left hemisphere), anterior cingulate cortex (Brodmann area 24, left hemisphere), the caudate nucleus, and Vermis cerebelli.
Entire brains were similarly removed at autopsies from three male chimpanzees who were 12, 12, and approximately 40 years old. The two 12-yr-old chimpanzees were sired by the same male and the 40 yr old is unrelated to them. They had all died from natural causes, had no history of brain-related diseases, and suffered sudden deaths without associated brain damage. From these brains, the following brain regions homologous to the corresponding human regions were removed by the same neuroanatomist (T. Arendt) who dissected the human brains: Broca's area, dorsolateral prefrontal cortex, primary visual cortex, anterior cingulate cortex, caudate nucleus, and Vermis cerebelli.
Total RNA was isolated using the TRIZol reagent according to the manufacturer's instructions and purified with QIAGEN RNeasy kit following the “RNA cleanup” protocol. All RNAs were of high and comparable quality as gauged by the ratio of 28S to 18S ribosomal RNAs visualized on agarose gels and by the signal ratios between the probes for the 3′- and 5′-ends of the mRNAs of GAPDH and β-actin genes used as quality controls on Affymetrix microarrays. Labeling of 5 mg of the RNA, hybridization, staining, washing steps, and array scanning were carried out following Affymetrix protocols.
Expression data were collected using Affymetrix HG U95Av2 arrays as well as Affymetrix HG U95B, C, D, and E arrays and analyzed with Affymetrix Microarray Suite v5.0 using default parameters. Arrays were scaled to the same average intensity using all probes on the array. All primary expression data are publicly available at the authors' Web site (http://www.eva.mpg.de/∼khaitovi/supplement2.html) and at ArrayExpress (http://www.ebi.ac.uk/arrayexpress/).
Multidimensional Scaling
The sum of the absolute values of the “signal log ratios” for all genes was calculated for all possible pairwise comparisons among all human and all chimpanzee tissue samples. In each comparison, if a given gene was not reliably detected on both arrays (detection p-value ≥0.06) or did not show a significant change in expression (change p-value 0.003–0.997), the “signal log ratio” was set to zero. The sum was normalized to the number of genes reliably detected on at least one of the arrays in each pairwise comparison. The stress values for the plots shown in Figure 2 are 0.071, 0.063, 0.045, and 0.102, respectively.
Differences Between the Brain Regions
Genes differentially expressed between brain regions were determined using comparisons within each individual according to the following criteria: (1) The gene had to be reliably detected in one of the regions in all three individuals from a species (detection p-value ≤0.05). (2) The gene had to show a significant change in expression in the same direction in all three comparisons (change p-value [two-tailed] ≤0.05 or ≥0.95). (3) The “signal log ratio” in all three comparisons had to be ≥0.5 or ≤–0.5. These criteria were set up using three sets of duplicate experiments, each consisting of two independently prepared and hybridized probes of the same brain region for three individuals. The first set of duplicates was Broca's regions from the three human samples used in this project. The other two sets consisted of replicates for the prefrontal cortex region for three humans and three chimpanzees, respectively, previously analyzed (Enard et al. 2002). For these data sets, we found two, one, and two false-positive genes, respectively (out of ∼12,600 tested), that satisfied the above criteria.
Differences Between the Species
Gene expression levels were compared in each brain region separately in all nine possible pairwise comparisons among the three individuals of each species. The criteria used were the same as for the comparisons between the brain regions within individuals except that the “signal log ratio” had to be ≥0.2 or ≤–0.2 in all nine comparisons. These criteria were set up to ensure a number of false positives similar to the ones seen within species as described above. Thus, with these criteria, we find one, zero, and one false positives, respectively, in the three sets of duplicates. Note that although the minimal “signal log ratio” difference of 0.2 corresponds to a “fold change” of only ∼1.15, the average “fold change” is higher than the minimal threshold because this cutoff was used for all nine comparisons. In addition, we used more stringent selection criterion where “signal log ratio” had to be ≥0.5 or ≤–0.5 in all nine comparisons. The use of more stringent criteria did not affect the results (data not shown).
Estimating the Effect of Intraspecific Variation in Gene Expression
To evaluate to what extent three human and three chimpanzee individuals are enough to gauge interspecies gene expression differences, we randomized the expression measurements for all genes with respect to the individual (irrespective of species affiliation) in which it occurred for each of the six brain regions. For 54 such data sets, we found on average 14 genes (range: 0 to 92) that differed significantly between the two groups of three individuals in all nine possible comparisons. Because on average 302 differences (range: 275 to 378) are found in the nonrandomized data, ∼5% of the observed differences between the species are expected to be caused by the variation among individuals within the two species.
Estimating the Effect of Interspecific DNA Sequence Differences
To test to what extent nucleotide sequence differences between humans and chimpanzees may influence the results, we extracted all 262 genes from the available chimpanzee data that encompass the target sequences for all 16 oligonucleotides used to measure the expression of transcripts on the Affymetrix arrays. Whenever a substitutional or indel difference between humans and chimpanzees was observed in a target sequence, that oligonucleotide was deleted from the analysis. In total, 940 out of 4192 oligonucleotides were deleted such that each gene was detected by an average 12.4 oligonucleotides (range: 0 to 16). The number of interspecies expression differences found with the 262 genes was 21. When we deleted 940 randomly chosen oligonucleotides having the same distribution among the genes as the deleted oligonucleotides with sequence differences, 27 expression differences were seen. Thus, ∼22% of the genes classified as differentially expressed between humans and chimpanzees are caused by nucleotide sequence differences between the species.
Eliminating Influence of Sequence Differences Between Humans and Chimpanzees
We used two approaches to eliminate oligonucleotide probes on the Affymetrix arrays that may not hybridize equally well to human and chimpanzee transcripts. In the first approach, we used available chimpanzee sequence information to exclude all oligonucleotide probes that do not match perfectly between humans and chimpanzees. To do this, we downloaded all publicly available chimpanzee sequences from GenBank (02/03). Using BLAT (Kent 2002), we matched chimpanzee sequences with Affymetrix target sequences containing the 16 oligonucleotide probes (NetAFFX; http://www.affymetrix.com/analysis/download_center.affx), requiring at least 95% sequence identity. Target sequences with more than 20 BLAT matches to the chimpanzee sequence were excluded, and for the remaining ones the best match was accepted. We then identified all oligonucleotide probes within target sequences that matched the chimpanzee sequence perfectly. These probes were used for the analysis while the rest were masked.
In the second approach, we identified and masked the oligonucleotide probes that differ in their binding characteristics between humans and chimpanzees as described in Lachmann et al. (M. Lachmann, I. Hellmann, H. Boris, P. Khaitovich, in prep.). Briefly, we first estimated the relative binding efficiency for each probe in the probe set by comparing the signal intensity of this probe to the intensities of all other probes within a probe set. Then we compared the calculated binding efficiencies of the probes between all human and all chimpanzee samples using a t-test. If the binding efficiency of a probe differed significantly between human and chimpanzee samples (p < 0.001), the probe was masked. Note that this algorithm does not allow the identification of genes with deletions or duplications that span the probe selection region in chimpanzees.
Functional Annotation
To functionally annotate the probe sets on the Affymetrix HG U95 arrays, we integrated information from four public databases: Affymetrix NetAffx (http://www.affymetrix.com; November 2003 release), UniGene (http://www.ncbi.nlm.nih.gov/UniGene/; Build 163), LocusLink (ftp://ftp.ncbi.nih.gov/refseq/LocusLink; release from 11/2003, Built LL3_031115), and GeneOntology (GO; http://www.godatabase.org/dev/database/archive; November 2003 release). Relevant information from these databases was downloaded and stored locally in a relational MySQL database. First, the Affymetrix probe sets were linked to the corresponding UniGene clusters using GenBank accession numbers provided by NetAffx. When a single UniGene cluster was represented by multiple probe sets, the cluster was classified as detected if at least one probe set was detected and classified as differentially expressed if at least one probe set was differentially expressed. Second, the UniGene clusters were assigned to genes and their GO annotations from each of the three GO taxonomies (“molecular function,” “biological process,” and “cellular component”) using LocusLink. Note that a gene belongs to its assigned GO group as well as all higher groups in the taxonomy.
To assess if the overall distribution of differentially expressed genes across the groups in a GO taxonomy differs significantly from the distribution of all detected genes, we compared it with 10,000 random sets in which the same number of differentially expressed genes was randomly drawn from the annotated detected genes. For each of the 10,000 random sets as well as for the observed data, a χ2 distance (dt) was calculated for each group in the GO taxonomy according to the formula:
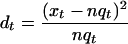 |
where xt is the number of differentially expressed genes in the group t, nt is the number of detected genes in group t,and q is the ratio of all differentially expressed genes to all detected genes. The overall distance was calculated as the sum of the χ2 distances in a given GO taxonomy. p-values were calculated as the proportion of random sets with a distance greater than or equal to the observed distances.
We used the hypergeometric distribution to test if individual functional groups contain a significantly higher or lower number of differentially expressed genes than expected from the number of detected genes. We calculated the number of significant groups in the observed data and in 10,000 random sets of detected genes at the 1% significance level. We did not correct for multiple tests, because the global tests already suggested a significant deviation and we were interested in identifying the groups responsible for this. The percentage of false positives was estimated from the ratio of the number of significant groups in the observed data to the average number of the significant groups in 10,000 random sets. In comparisons between the brain regions, we expect 11%, 45% (at 5% significance level), and 7% false positives for the groups with significant excess and 9%, 2%, and 8% false positives for the groups with significant lack of expression differences in the taxonomies “biological process,” “cellular component,” and “molecular function,” respectively. In comparisons between the cerebral cortex regions, we expect 13%, 12%, and 15% false positives for the groups with significant excess and 4%, 2%, and 5% false positives for the groups with significant lack of expression differences in the respective taxonomies.
To find out if groups on higher levels of the GO taxonomies are significant solely because they contain significant subgroups, we removed all significant subgroups from each significant group and tested the remaining genes against the distribution of the detected genes using the hypergeometric distribution. If the group lost its significance, it was removed from further analysis. If it remained significant, the next higher group in the taxonomy was tested using the same procedure.
Genomic Localization
We mapped the 61,648 probe sets on the Affymetrix HGU95 GeneChips to the human genome (NCBI assembly, July 2003, Build 34) using BLAT (Kent 2002). Multiple probe sets that map to the same UniGene cluster or transcript were removed, leaving only one entry per transcript. When multiple probe sets were mapped to the same transcript and at least one of them was classified as differentially expressed, the transcript was classified as differentially expressed.
We used overlapping sliding windows containing 21 detected transcripts to calculate the proportion of differentially expressed transcripts per window along the genome. The Y-chromosome was excluded from this analysis because very few transcripts were detected there. We simulated the random distribution by 1,500,000 permutations of the original data set with respect to the assignment of expression differences to detected genes. The p-values were calculated as the proportion of random sets that contained a number of windows with a certain ratio of differentially expressed transcripts equal to or greater than the number of windows with that ratio in the observed data.
Segmental Duplications and Gene Expression Differences
Segmental duplication content was assessed based on analyses of the human genome reference sequence. Two complementary detection strategies were used. A BLAST-based detection scheme was used to identify all pairwise similarities representing duplicated regions (≥1 kb and ≥90% identity) within the finished human genome sequence (Bailey et al. 2001). Highly identical duplications were then confirmed by a second detection strategy that assays for excess random-read coverage across the genome (Bailey et al. 2002). Each oligonucleotide used in the microarray expression studies was individually mapped and the duplication and unique sequence content determined. A gene was considered duplicated if at least one oligonucleotide mapped to duplicated sequence in this analysis. A total of 18,340 genes could be unambiguously mapped to build 34, of which 1999 (10.9%) were scored as duplicated.
Acknowledgments
We thank A. Sajantila for help in collection of the human brain samples; R. Bontrop, W. Collignon, W. Scheffrahn, and G. Anzenberger for help in collection of the chimpanzee brain samples; K. Bauer for help in sample dissection; S. Ptak for help with statistical analysis; and M. Przeworski and M. Hofreiter for critical reading of the manuscript and many helpful discussions. We are indebted to the Bundesministerium für Bildung und Forschung and the Max Planck Society for financial support.
The publication costs of this article were defrayed in part by payment of page charges. This article must therefore be hereby marked “advertisement” in accordance with 18 USC section 1734 solely to indicate this fact.
Article and publication date are at http://www.genome.org/cgi/doi/10.1101/gr.2538704.
Footnotes
[Supplemental material is available online at www.genome.org.]
References
- Ashburner, M., Ball, C.A., Blake, J.A., Botstein, D., Butler, H., Cherry, J.M., Davis, A.P., Dolinski, K., Dwight, S.S., Eppig, J.T., et al. 2000. Gene ontology: Tool for the unification of biology. The Gene Ontology Consortium. Nat. Genet. 25: 25–29. [DOI] [PMC free article] [PubMed] [Google Scholar]
- Bailey, J.A., Yavor, A.M., Massa, H.F., Trask, B.J., and Eichler, E.E. 2001. Segmental duplications: Organization and impact within the current human genome project assembly. Genome Res. 11: 1005–1017. [DOI] [PMC free article] [PubMed] [Google Scholar]
- Bailey, J.A., Gu, Z., Clark, R.A., Reinert, K., Samonte, R.V., Schwartz, S., Adams, M.D., Myers, E.W., Li, P.W., and Eichler, E.E. 2002. Recent segmental duplications in the human genome. Science 297: 1003–1007. [DOI] [PubMed] [Google Scholar]
- Caceres, M., Lachuer, J., Zapala, M.A., Redmond, J.C., Kudo, L., Geschwind, D.H., Lockhart, D.J., Preuss, T.M., and Barlow, C. 2003. Elevated gene expression levels distinguish human from non-human primate brains. Proc. Natl. Acad. Sci. 100: 13030–13035. [DOI] [PMC free article] [PubMed] [Google Scholar]
- Enard, W., Khaitovich, P., Klose, J., Zollner, S., Heissig, F., Giavalisco, P., Nieselt-Struwe, K., Muchmore, E., Varki, A., Ravid, R., et al. 2002. Intra- and interspecific variation in primate gene expression patterns. Science 296: 340–343. [DOI] [PubMed] [Google Scholar]
- Finger, S. and Stein, D.G. 1982. Brain damage and recovery: Research and clinical perspectives. Academic Press, New York.
- Gu, J. and Gu, X. 2003. Induced gene expression in human brain after the split from chimpanzee. Trends Genet. 19: 63–65. [DOI] [PubMed] [Google Scholar]
- Hellmann, I., Zollner, S., Enard, W., Ebersberger, I., Nickel, B., and Paabo, S. 2003. Selection on human genes as revealed by comparisons to chimpanzee cDNA. Genome Res. 13: 831–837. [DOI] [PMC free article] [PubMed] [Google Scholar]
- Hsieh, W.P., Chu, T.M., Wolfinger, R.D., and Gibson, G. 2003. Mixed-model reanalysis of primate data suggests tissue and species biases in oligonucleotide-based gene expression profiles. Genetics 165: 747–757. [DOI] [PMC free article] [PubMed] [Google Scholar]
- Kaessmann, H., Wiebe, V., and Pääbo, S. 1999. Extensive nuclear DNA sequence diversity among chimpanzees. Science 286: 1159–1162. [DOI] [PubMed] [Google Scholar]
- Kandel, E.R., Schwartz, J.H., and Jessell, T.M. 2000. Principles of neural science. McGraw-Hill Health Professions Division, New York.
- Karaman, M.W., Houck, M.L., Chemnick, L.G., Nagpal, S., Chawannakul, D., Sudano, D., Pike, B.L., Ho, V.V., Ryder, O.A., and Hacia, J.G. 2003. Comparative analysis of gene-expression patterns in human and African great ape cultured fibroblasts. Genome Res. 13: 1619–1630. [DOI] [PMC free article] [PubMed] [Google Scholar]
- Kent, W.J. 2002. BLAT—The BLAST-like alignment tool. Genome Res. 12: 656–664. [DOI] [PMC free article] [PubMed] [Google Scholar]
- Lee, J.K., Bussey, K.J., Gwadry, F.G., Reinhold, W., Riddick, G., Pelletier, S.L., Nishizuka, S., Szakacs, G., Annereau, J.P., Shankavaram, U., et al. 2003. Comparing cDNA and oligonucleotide array data: Concordance of gene expression across platforms for the NCI-60 cancer cells. Genome Biol. 4: R82. [DOI] [PMC free article] [PubMed] [Google Scholar]
- Lu, J., Li, W.H., and Wu, C.I. 2003. Comment on “Chromosomal speciation and molecular divergence-accelerated evolution in rearranged chromosomes.” Science 302: 988; author reply 988. [DOI] [PubMed] [Google Scholar]
- Navarro, A. and Barton, N.H. 2003a. Accumulating postzygotic genes in parapatry: A new twist on chromosomal speciation. Evol. Int. J. Org. Evol. 57: 447–459. [DOI] [PubMed] [Google Scholar]
- Navarro, A. and Barton, N.H. 2003b. Chromosomal speciation and molecular divergence—Accelerated evolution in rearranged chromosomes. Science 300: 321–324. [DOI] [PubMed] [Google Scholar]
- Olson, M.V. and Varki, A. 2003. Sequencing the chimpanzee genome: Insights into human evolution and disease. Nat. Rev. Genet. 4: 20–28. [DOI] [PubMed] [Google Scholar]
- Sadato, N., Pascual-Leone, A., Grafman, J., Ibanez, V., Deiber, M.P., Dold, G., and Hallett, M. 1996. Activation of the primary visual cortex by Braille reading in blind subjects. Nature 380: 526–528. [DOI] [PubMed] [Google Scholar]
- Samonte, R.V. and Eichler, E.E. 2002. Segmental duplications and the evolution of the primate genome. Nat. Rev. Genet. 3: 65–72. [DOI] [PubMed] [Google Scholar]
- Sandberg, R., Yasuda, R., Pankratz, D.G., Carter, T.A., Del Rio, J.A., Wodicka, L., Mayford, M., Lockhart, D.J., and Barlow, C. 2000. Regional and strain-specific gene expression mapping in the adult mouse brain. Proc. Natl. Acad. Sci. 97: 11038–11043. [DOI] [PMC free article] [PubMed] [Google Scholar]
- Uddin, M., Wildman, D.E., Liu, G., Xu, W., Johnson, R.M., Hof, P.R., Kapatos, G., Grossman, L.I., and Goodman, M. 2004. Sister grouping of chimpanzees and humans as revealed by genome-wide phylogenetic analysis of brain gene expression profiles. Proc. Natl. Acad. Sci. 101: 2957–2962. [DOI] [PMC free article] [PubMed] [Google Scholar]
- von Melchner, L., Pallas, S.L., and Sur, M. 2000. Visual behaviour mediated by retinal projections directed to the auditory pathway. Nature 404: 871–876. [DOI] [PubMed] [Google Scholar]
- Yunis, J.J. and Prakash, O. 1982. The origin of man: A chromosomal pictorial legacy. Science 215: 1525–1530. [DOI] [PubMed] [Google Scholar]
WEB SITE REFERENCES
- ftp://ftp.ncbi.nih.gov/refseq/LocusLink; LocusLink.
- http://www.affymetrix.com/analysis/download_center.affx; NetAFFX.
- http://www.ebi.ac.uk/arrayexpress/; ArrayExpress.
- http://www.eva.mpg.de/∼khaitovi/supplement2.html; Authors' Web site.
- http://www.godatabase.org/dev/database/archive; GeneOntology.
- http://www.ncbi.nlm.nih.gov/UniGene/; UniGene.
- http://www9.biostr.washington.edu/da.html; Digital Anatomist Project.