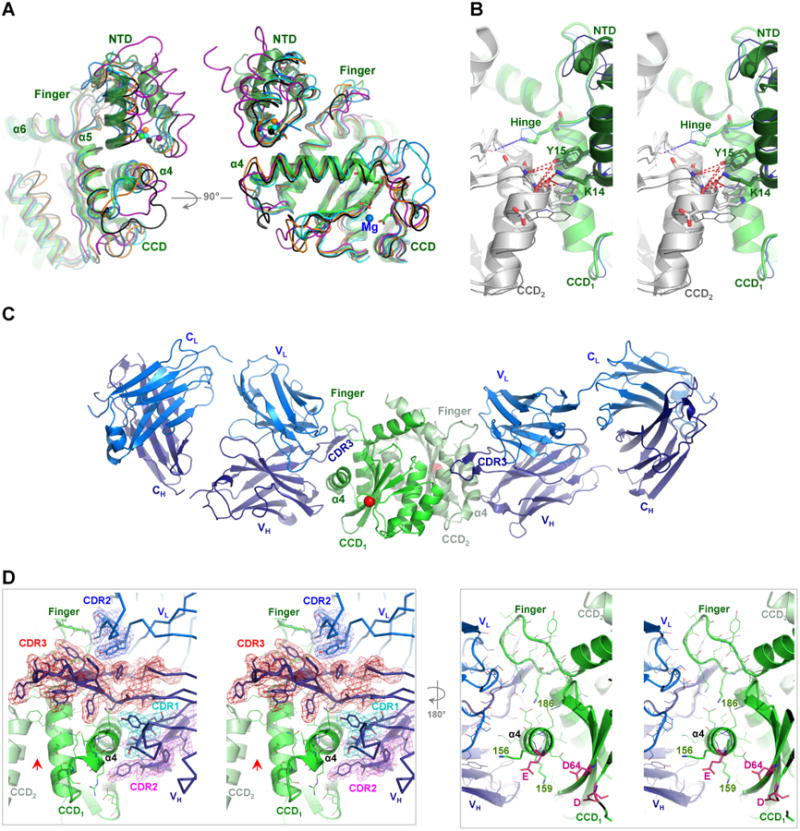
Figure 1. Crystal structure of IN CCD-Fab2 targeting the HTH-docking cleft.

A) NTD bound in the HTH-cleft between α4 and finger-loop. Superposition of IN CCD and NTD structures from HIV-1 (1K6Y, green), HIV-2 (3F9K, blue), maedi visna virus (MVV, 3HPH, cyan), RSV intasome (5EJK, black), PFV strand-transfer complex (3OS0, magenta) and MMTV intasome (3JCA, orange). Spheres indicate Zn2+ of HTH-motif. Catalytic site residues (D64-D116-E152 of HIV-1) are shown with green sticks and Mg2+ (3F9K) is shown with blue sphere. B) Walleye stereo view showing the HTH-motif bridging the two protomers (CCD1 and CCD2) of IN dimer. Hinge (e.g. F185K of HIV-1), polar and hydrophobic interacting residues are shown in sticks. HIV-1 (green cartoon) and HIV-2 (blue ribbon) are shown. NTDs are shown with darker hues. Red dashed-lines indicate interactions within 4 Å distances. C) Structure of crystallographic asymmetric unit containing two IN CCD protomers (green and pale green, Cα of catalytic D64 in red sphere) each bound to one Fab2 molecule. Fab2 light and heavy chains containing constant [C] and variable [V] regions are labeled CL and VL for light chain (blue) and CH and VH for heavy chain (deep blue). D) Walleye stereo view around α4 of one IN protomer (CCD1). Colored meshes represent electron density maps (2FO-FC, 1.0 σ) rendered around heavy chain CDR3 (red), CDR2 (magenta) and CDR1 (cyan), as well as around CDR2 of light chain (blue). Red arrow indicates the interface of the canonical dimer. Catalytic residues D64, D116 and E152 are shown in magenta sticks.
